Daten visuell ansprechend gestalten
Einführung in Tableau

Carl Rosseel
Head of BI Curriculum at DataCamp
Die Kunst der Formatierung
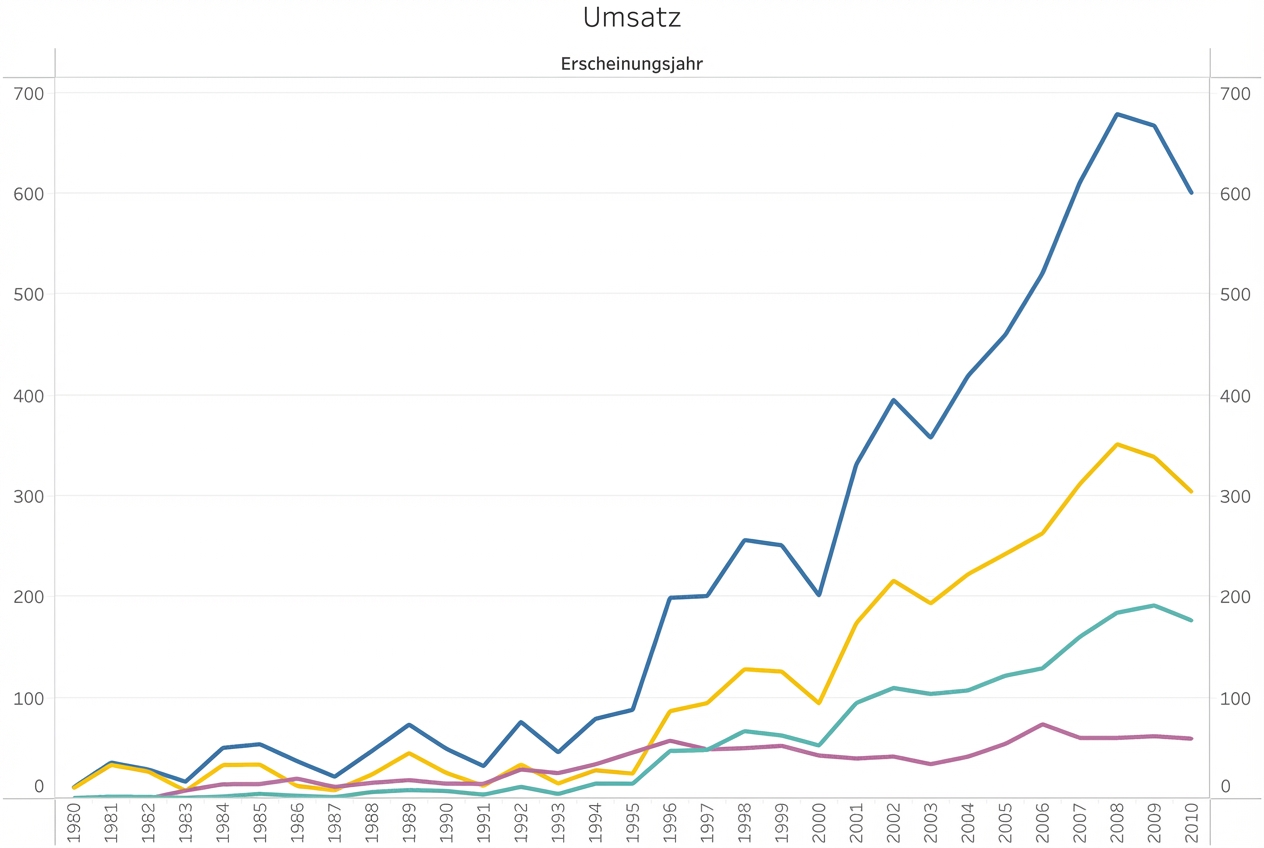
Aus einem Diagramm mit vielen Problemen...
Die Kunst der Formatierung
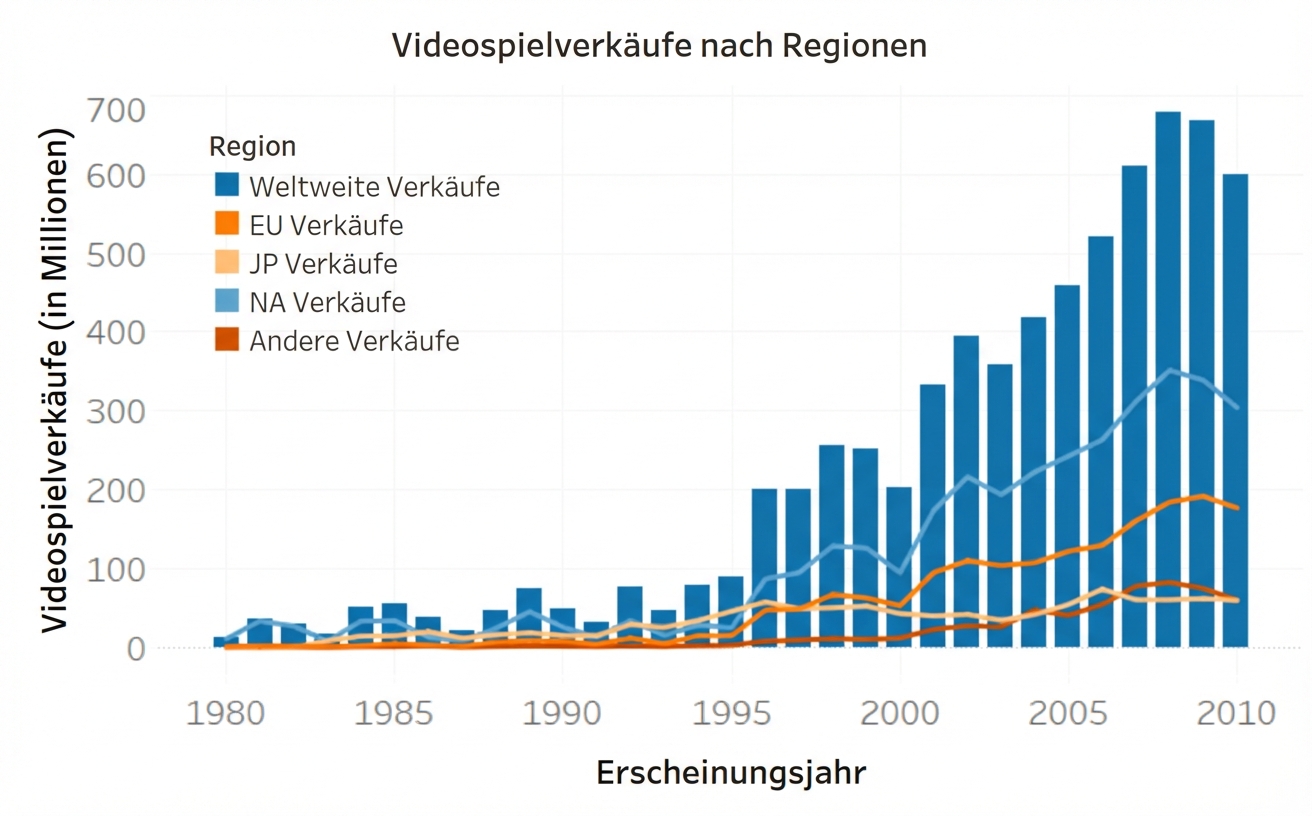
... zu einer klar erklärten Visualisierung
Format auf Arbeitsmappen- und Blattebene
Workbook:
- Was du zu Beginn einer Übung öffnest, wie zum Beispiel
1_1_loading_workbooks.twbx - Organisieren, speichern, teilen und veröffentlichen Sie Ergebnisse
- Enthält mehrere Blätter
- Ähnlich wie eine ganze Excel-Datei
Blatt:
- Ähnlich wie eine Registerkarte in einer Excel-Datei
- Unten in einer Arbeitsmappe als Registerkarten angezeigt
- Es gibt drei verschiedene Arten von Blättern:
- Arbeitsblatt (das hast du bisher benutzt)
- Dashboard (weiter unten in diesem Kapitel)
- Geschichte (weiter unten in diesem Kapitel)

