Gráficos básicos con Matplotlib
Python intermedio

Hugo Bowne-Anderson
Data Scientist at DataCamp
Gráficos básicos con Matplotlib
- Visualización

- Estructura de datos

- Estructuras de control

- Estudio de caso

visualización de datos
Muy importante en el análisis de datos
- Explorar los datos
- Información del informe
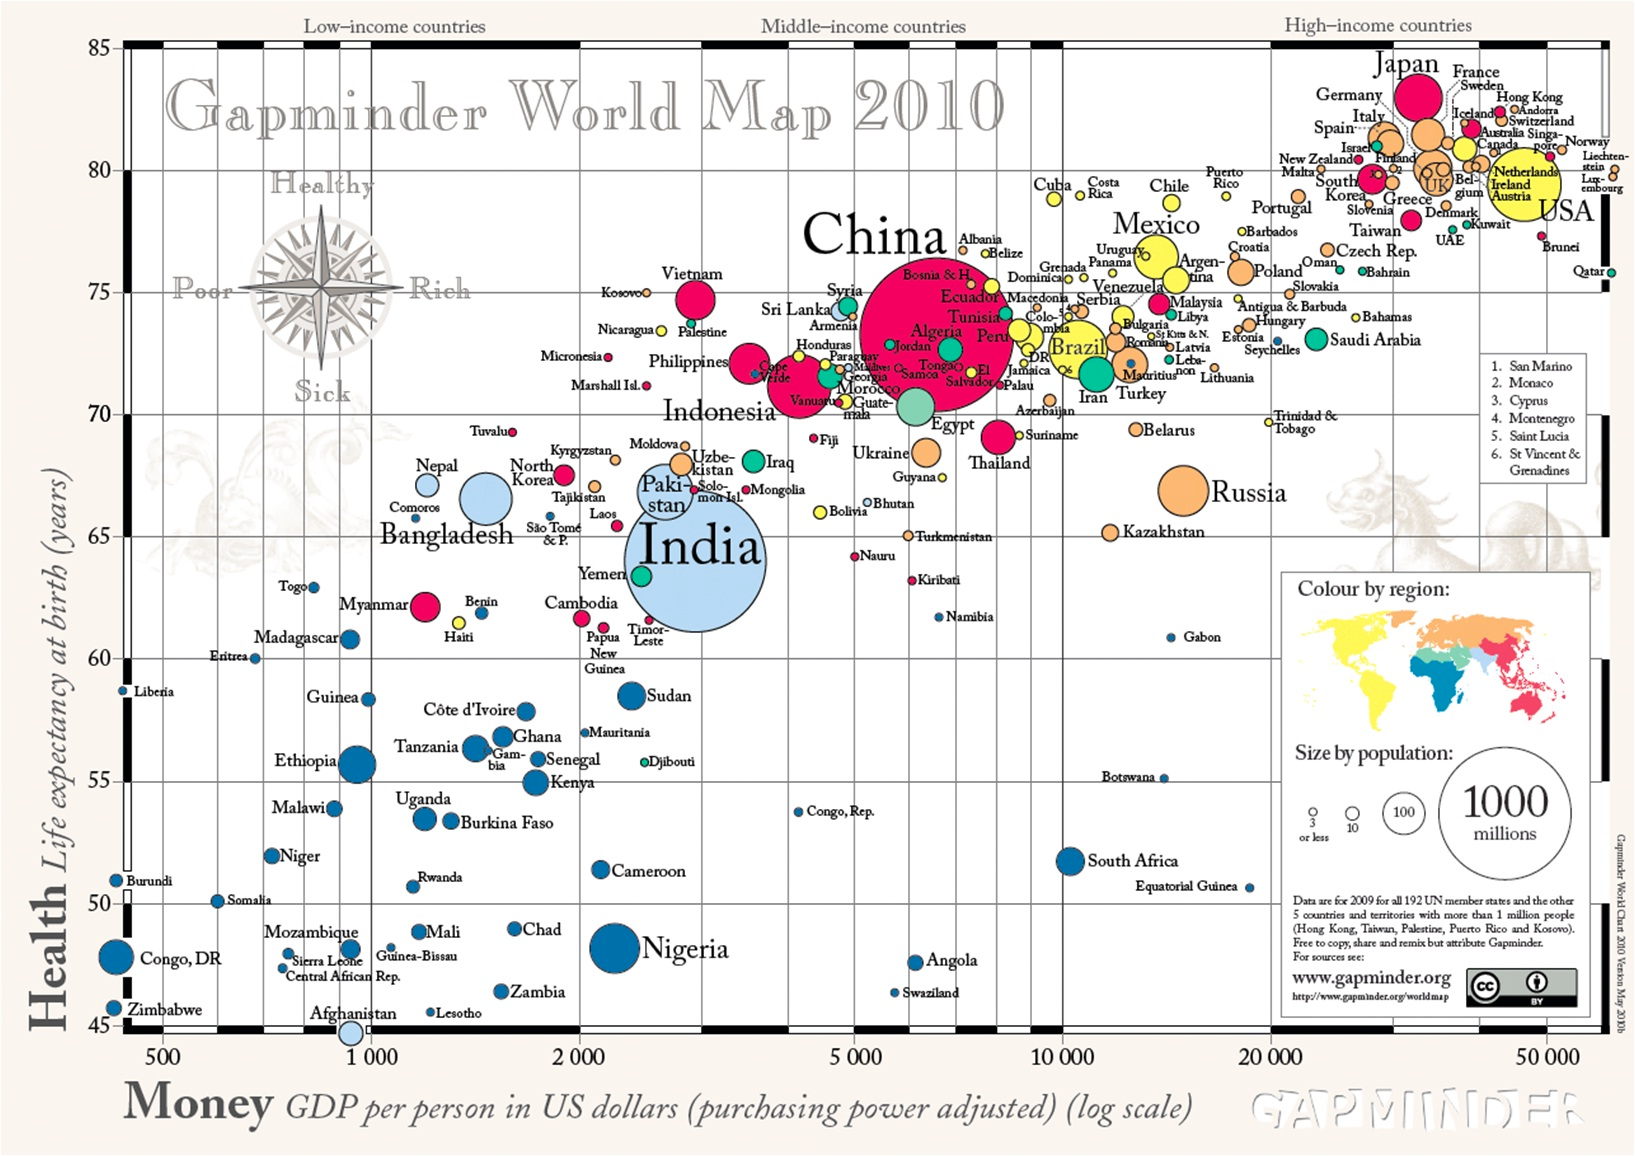
1 Fuente: GapMinder, Wealth and Health of Nations
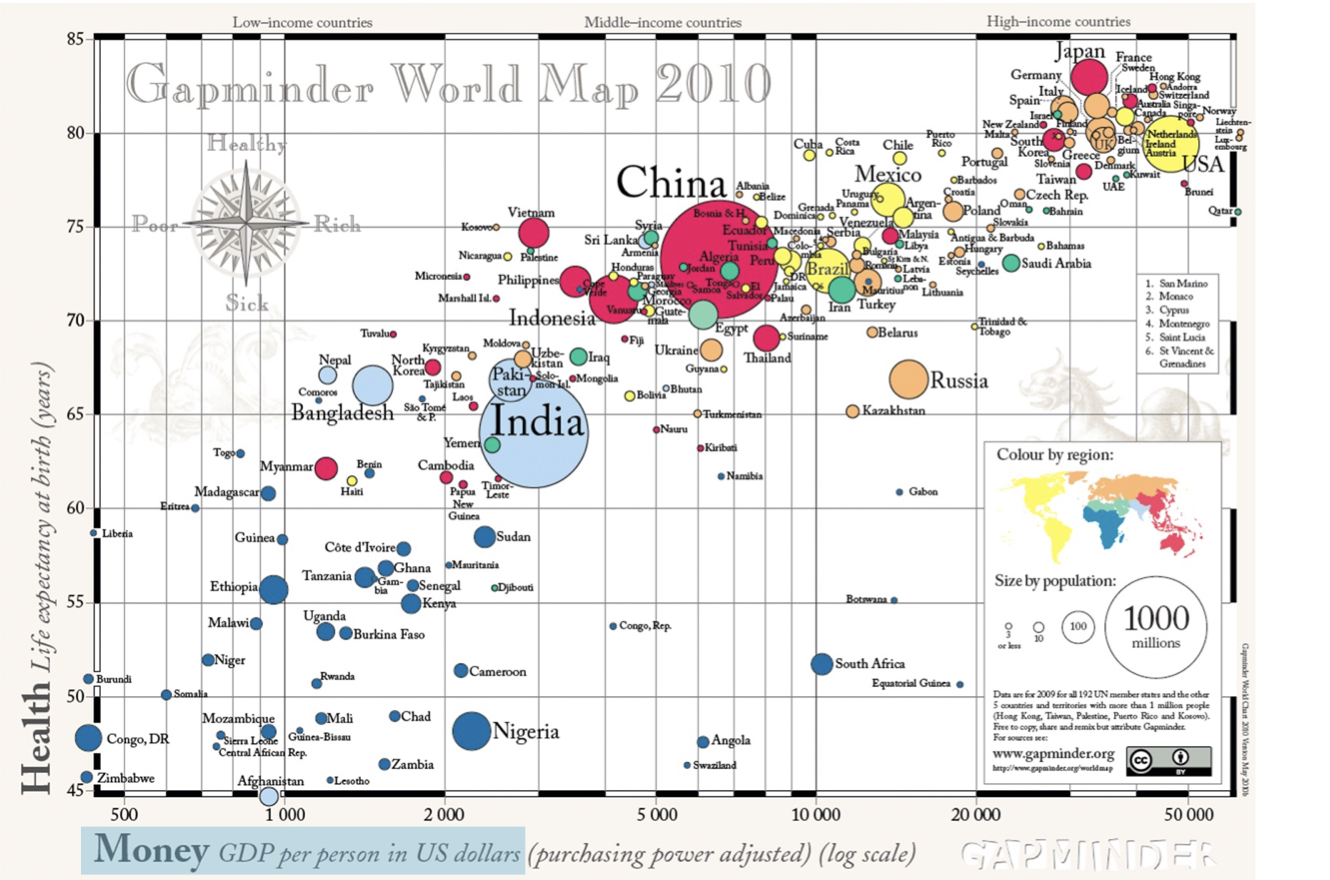
1 Fuente: GapMinder, Wealth and Health of Nations
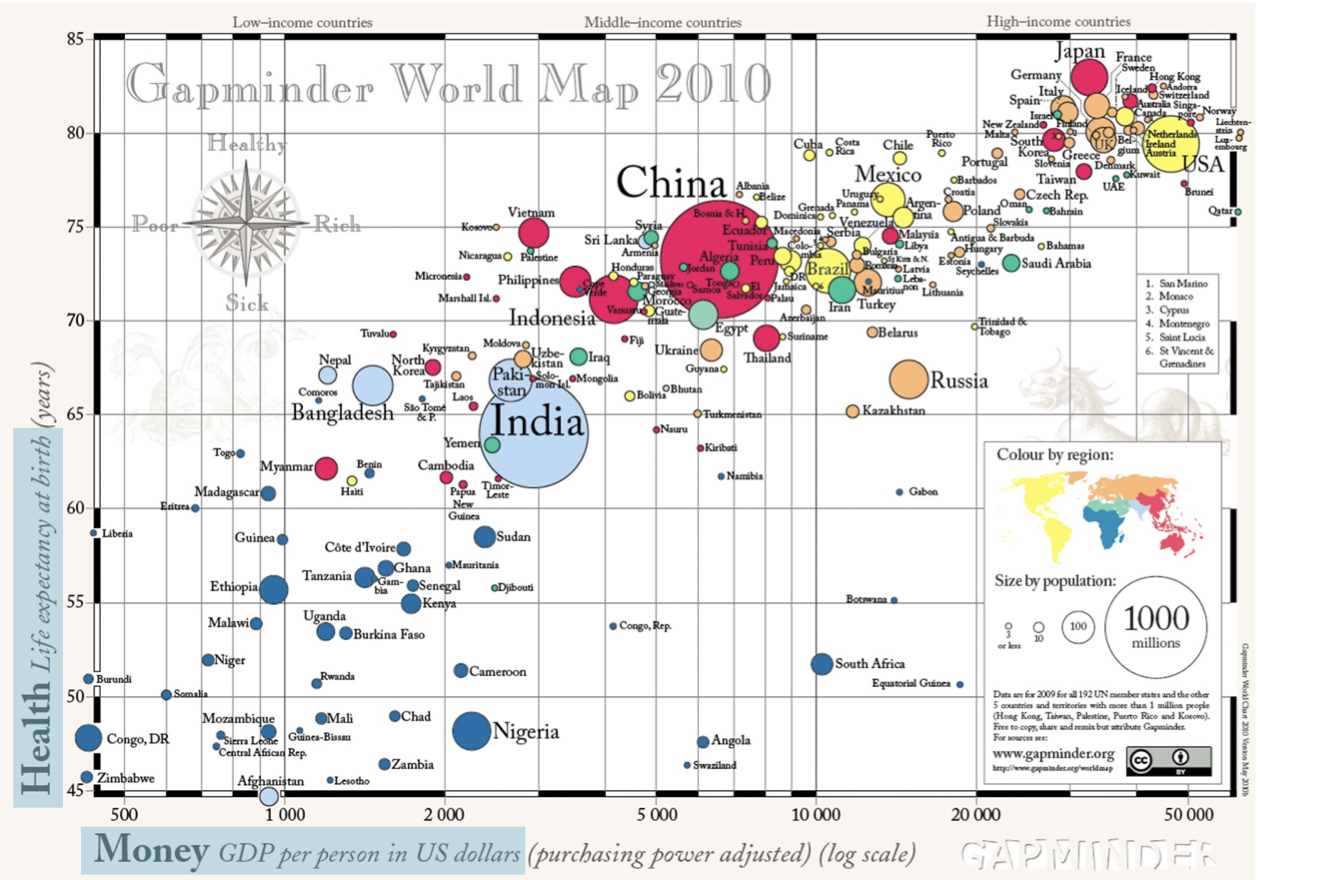
1 Fuente: GapMinder, Wealth and Health of Nations
Matplotlib
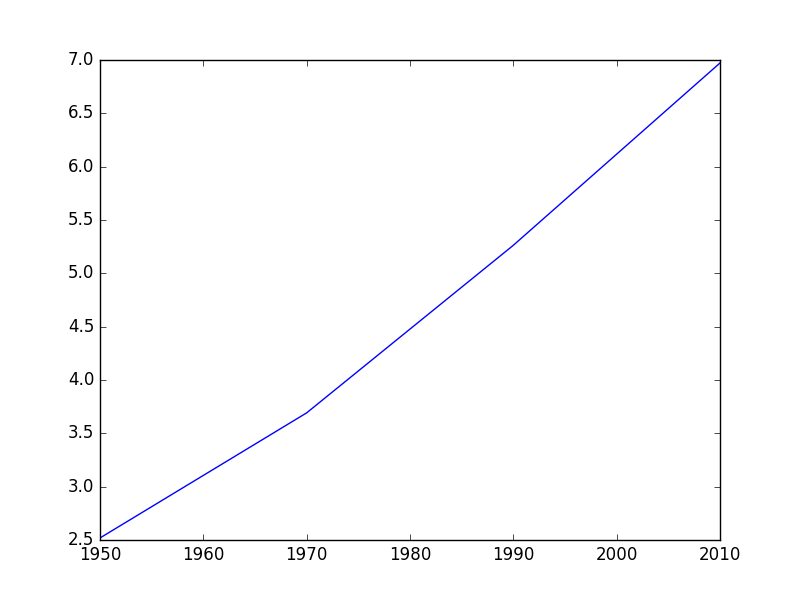
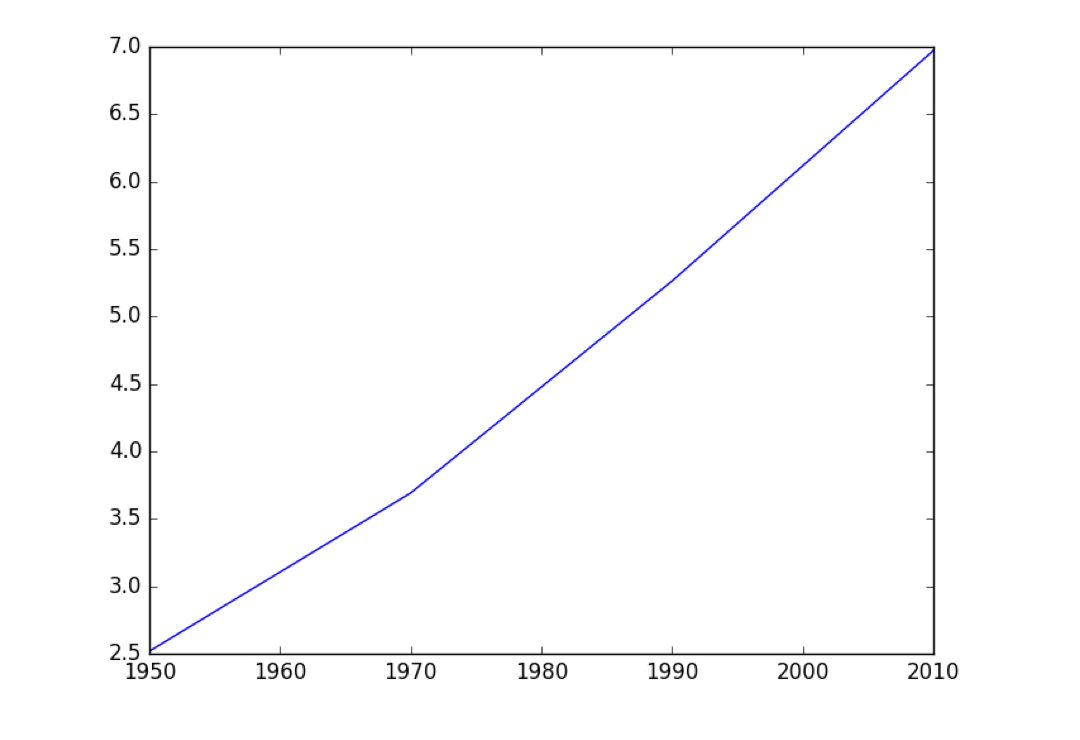
import matplotlib.pyplot as pltyear = [1950, 1970, 1990, 2010]pop = [2.519, 3.692, 5.263, 6.972]plt.plot(year, pop)plt.show()
Matplotlib
Matplotlib
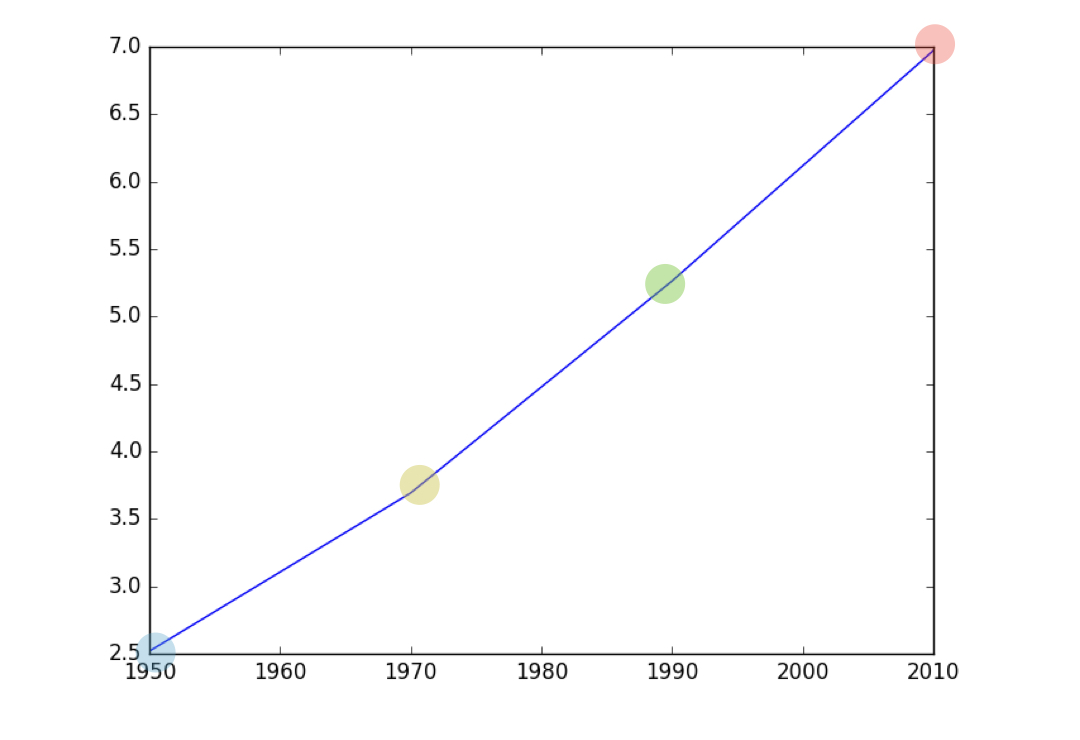
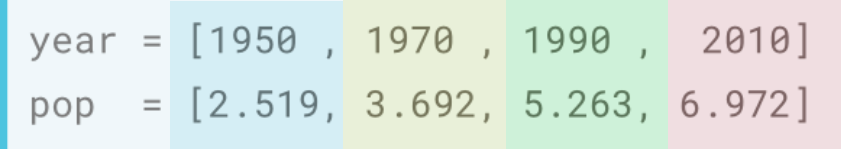
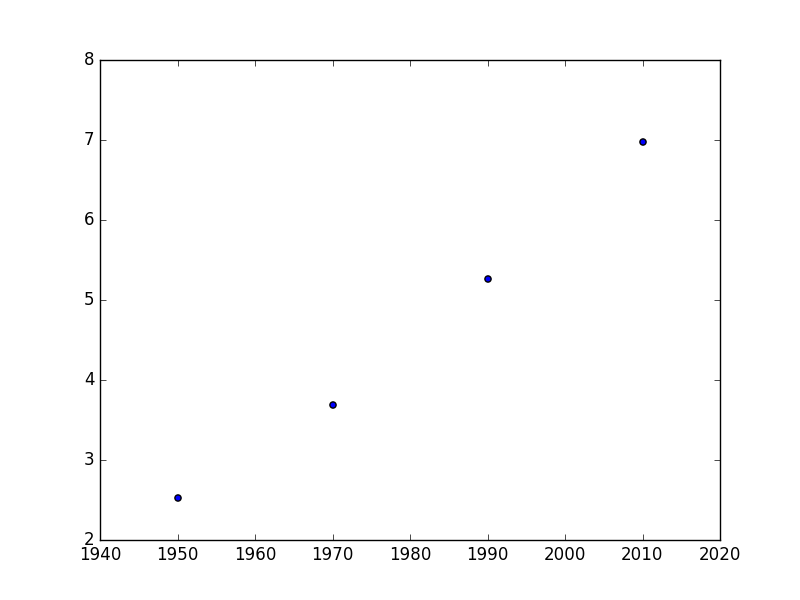
Diagrama de dispersión
import matplotlib.pyplot as plt
year = [1950, 1970, 1990, 2010]
pop = [2.519, 3.692, 5.263, 6.972]
plt.scatter(year, pop)
plt.show()