Etwas Stil hinzufügen
Einführung in Data Science mit Python

Hillary Green-Lerman
Senior Curriculum Lead, DataCamp
Viele Kilometer vor uns

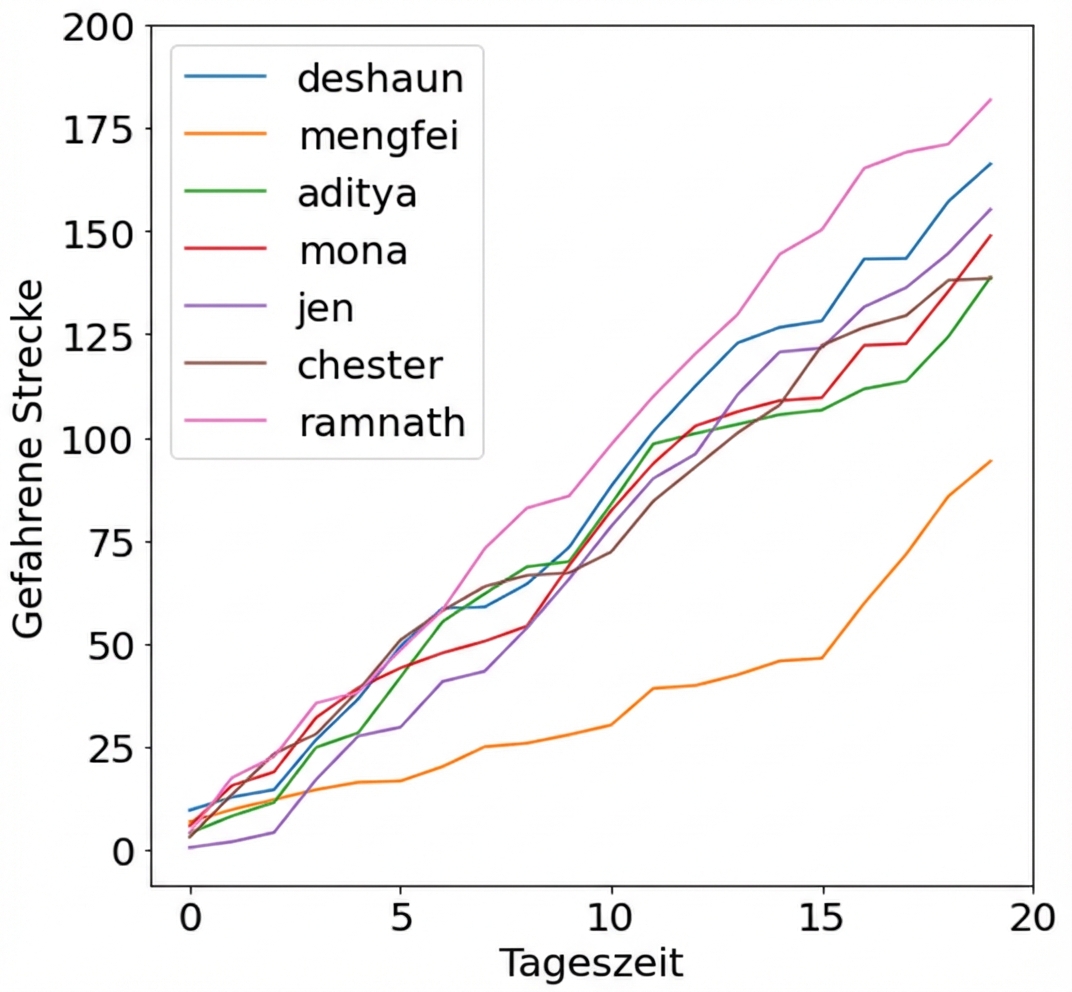
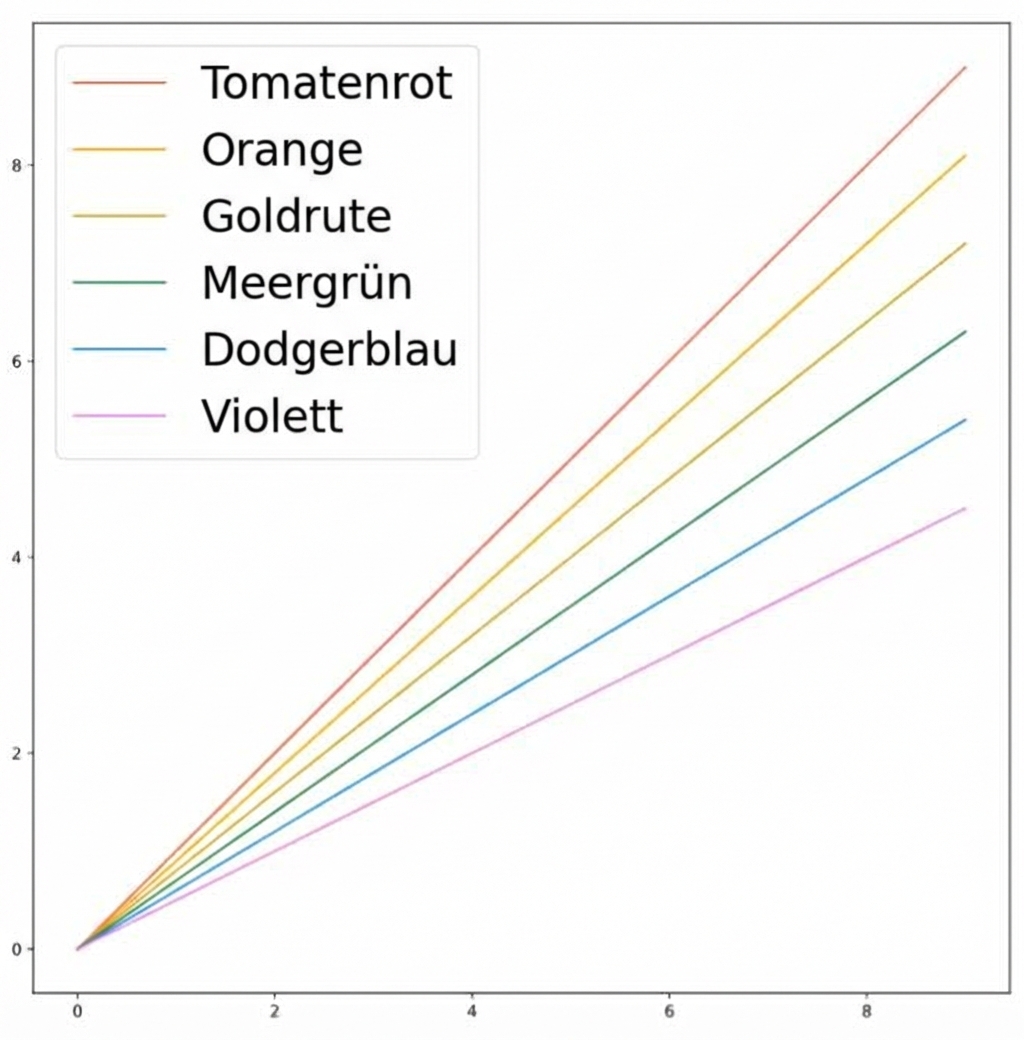
Linienfarbe ändern
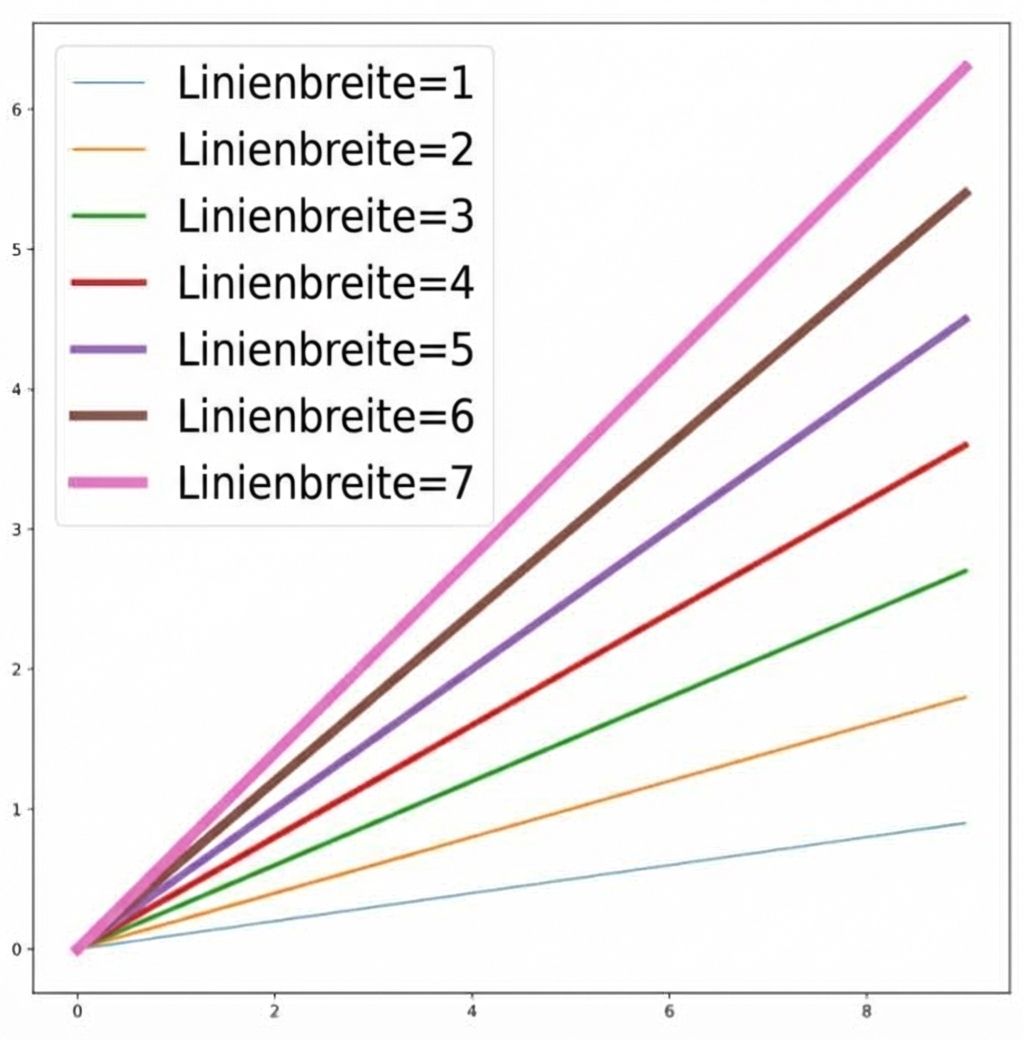
Ändern der Linienbreite
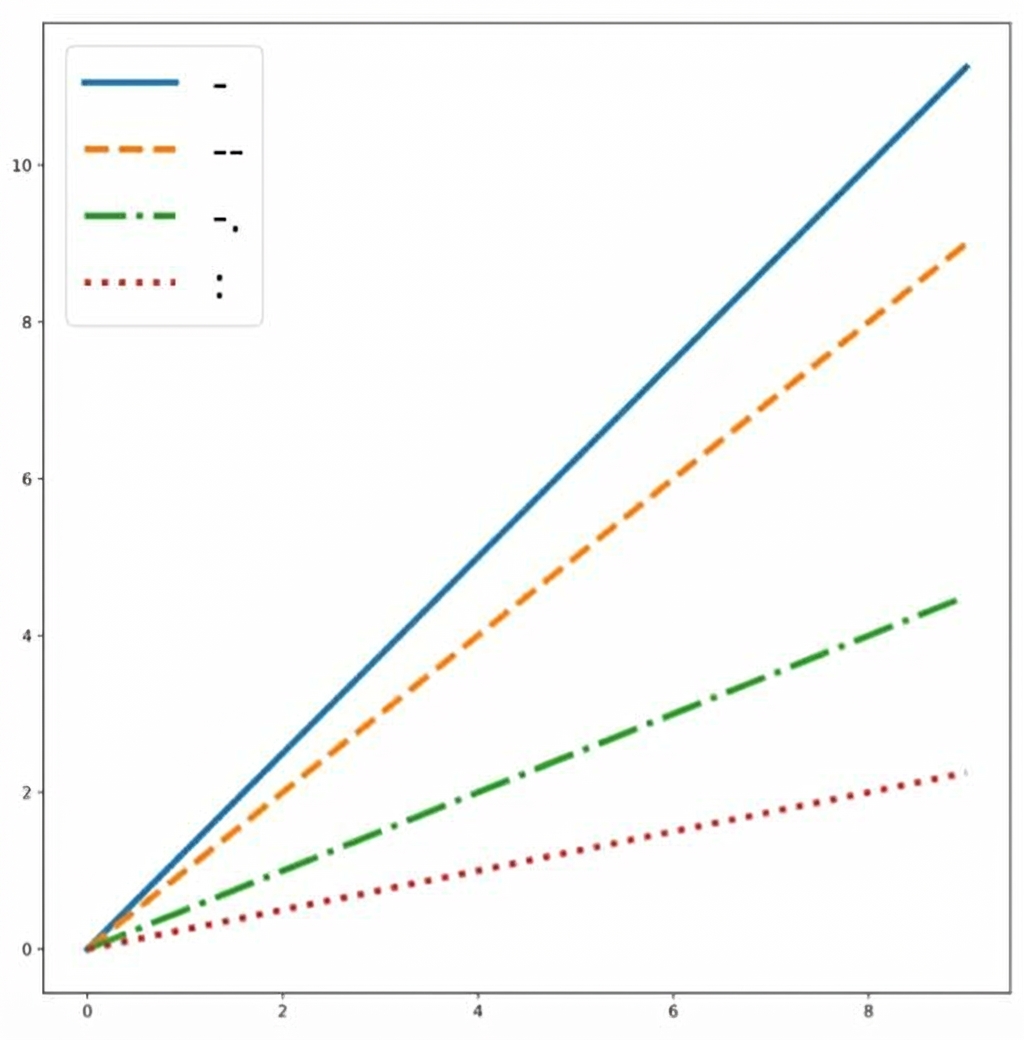
Linienstil ändern
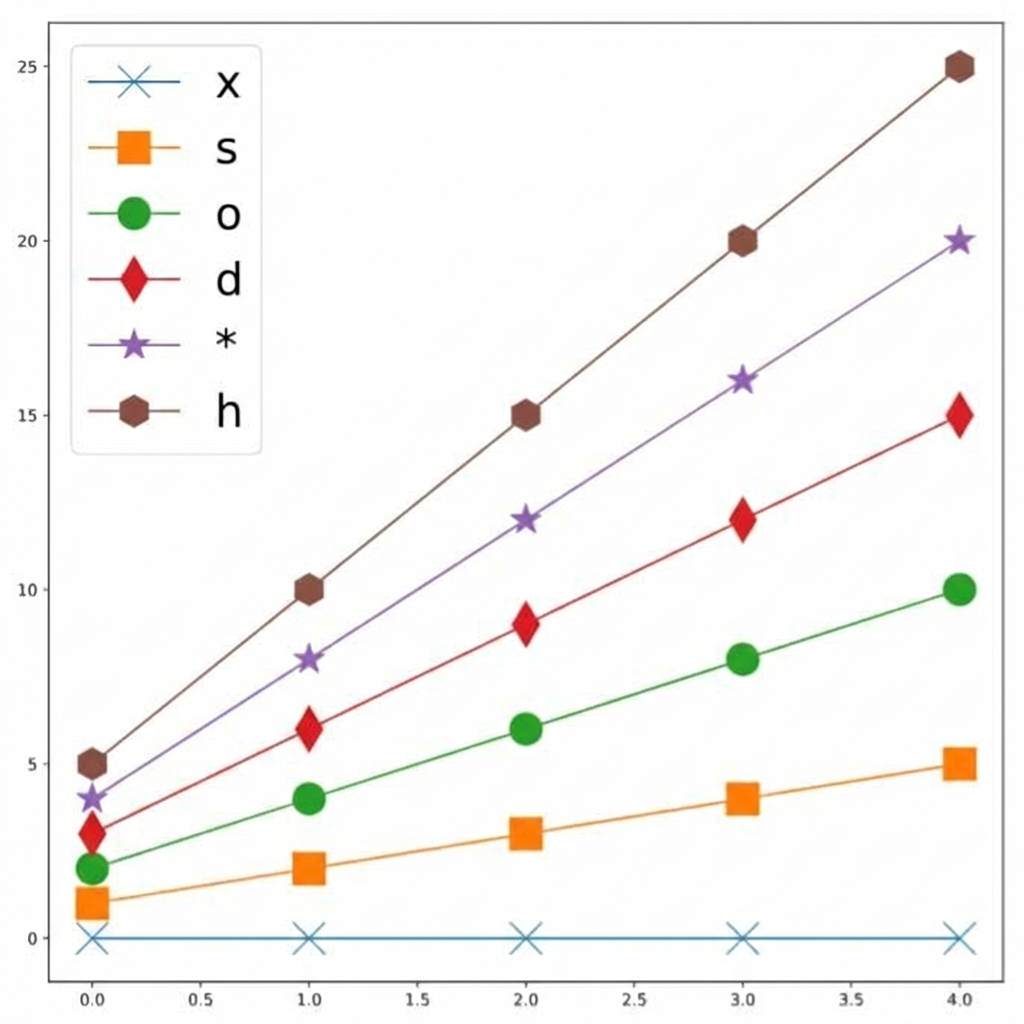
Marker hinzufügen
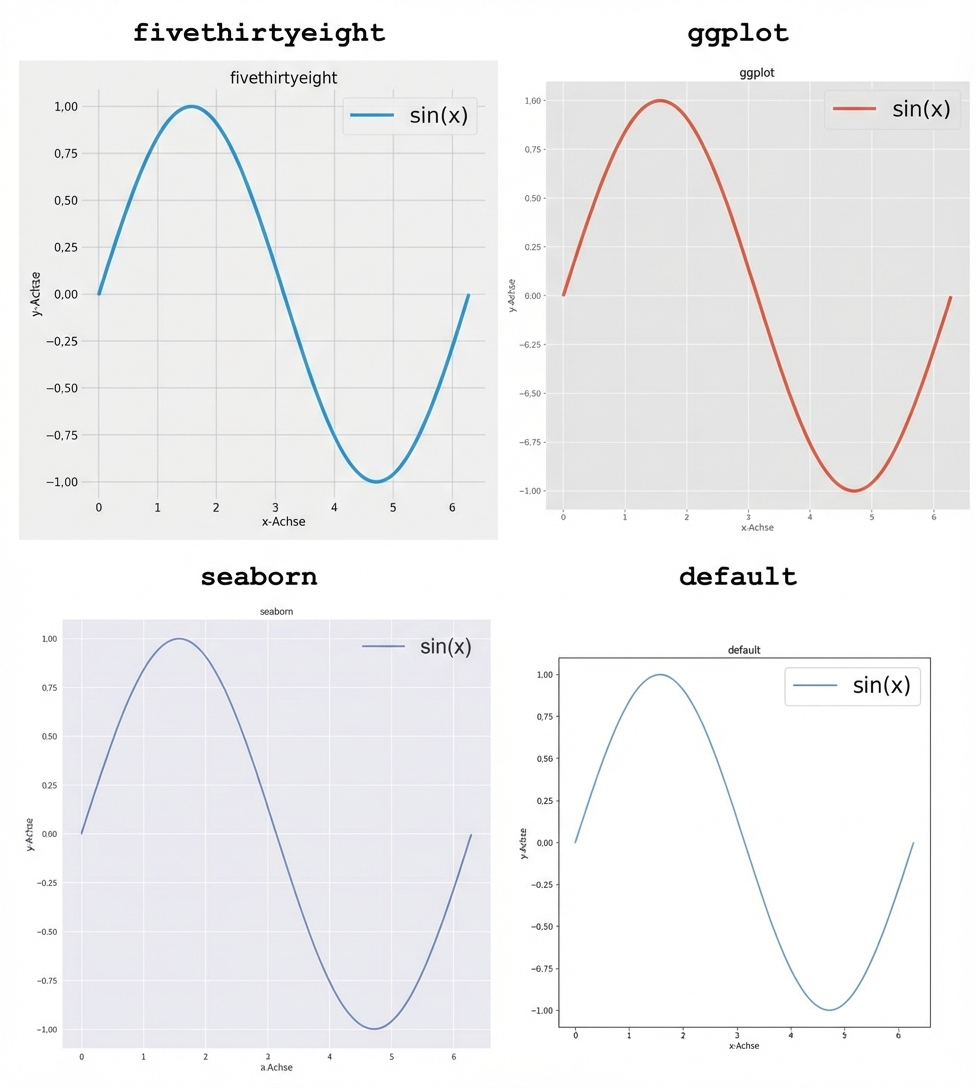
Einen Stil festlegen
Einführung in Data Science mit Python
Hillary Green-Lerman
Senior Curriculum Lead, DataCamp

