Eine Geschichte von zwei Variablen
Einführung in die Regression mit statsmodels in Python

Maarten Van den Broeck
Content Developer at DataCamp
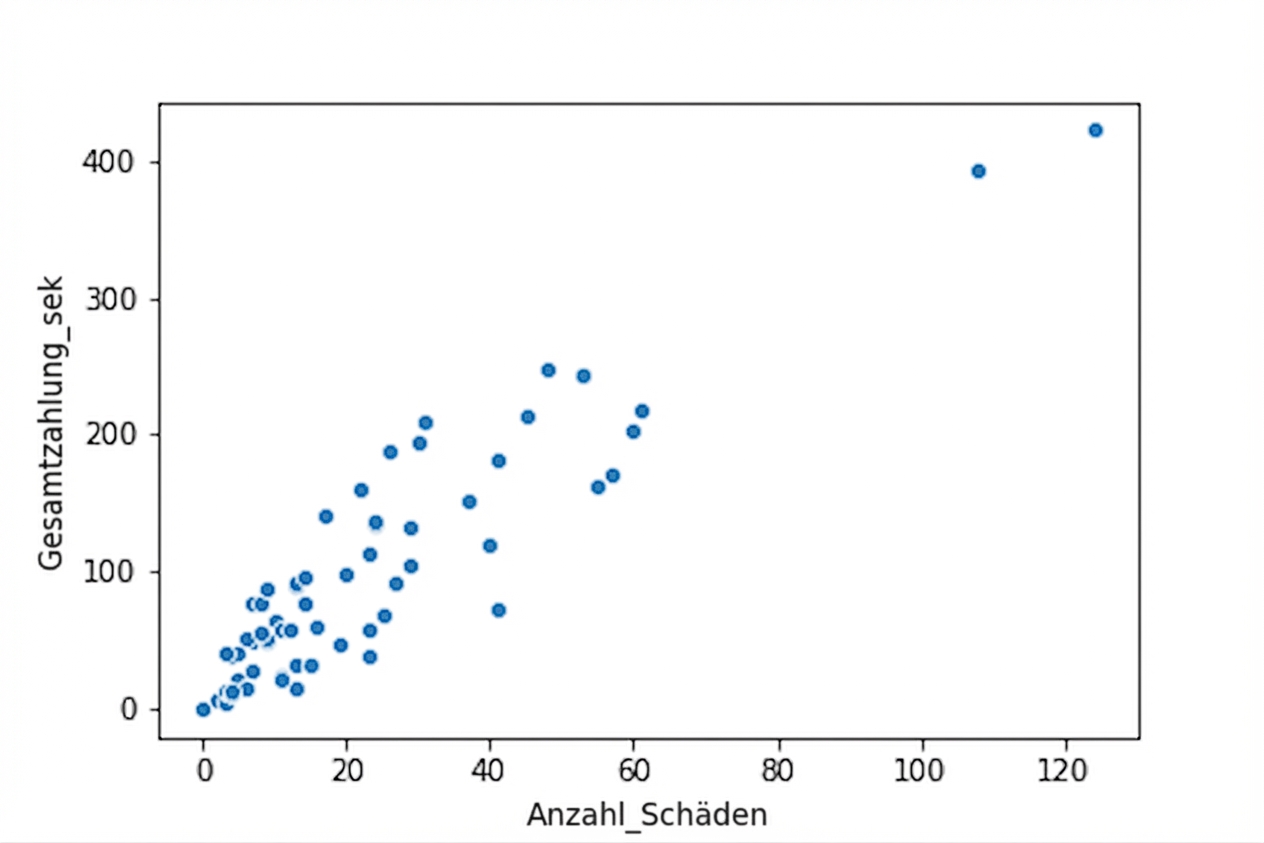
Paare von Variablen visualisieren
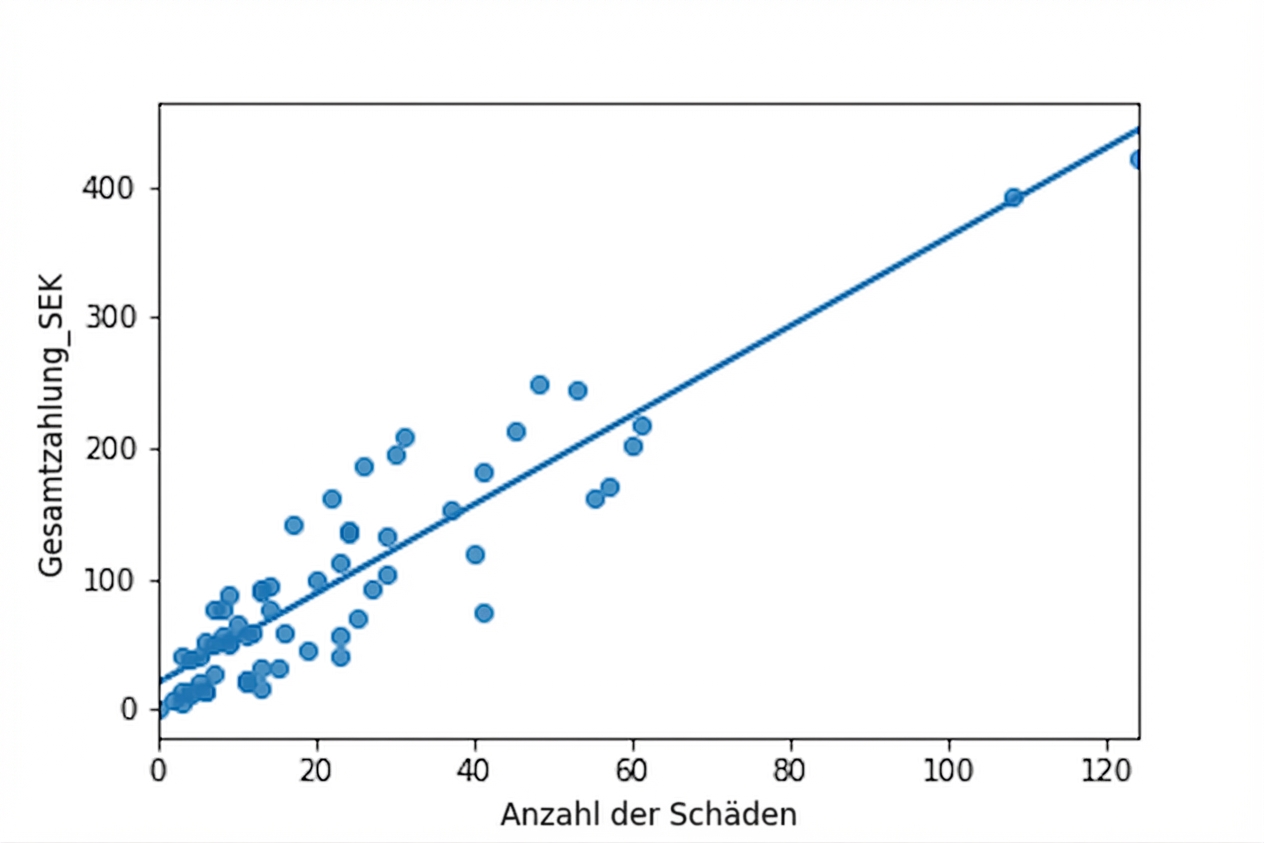
Lineare Trendlinie hinzufügen
Einführung in die Regression mit statsmodels in Python
Maarten Van den Broeck
Content Developer at DataCamp

