Ausreißer, Hebelwirkung und Einfluss
Einführung in die Regression mit statsmodels in Python

Maarten Van den Broeck
Content Developer at DataCamp
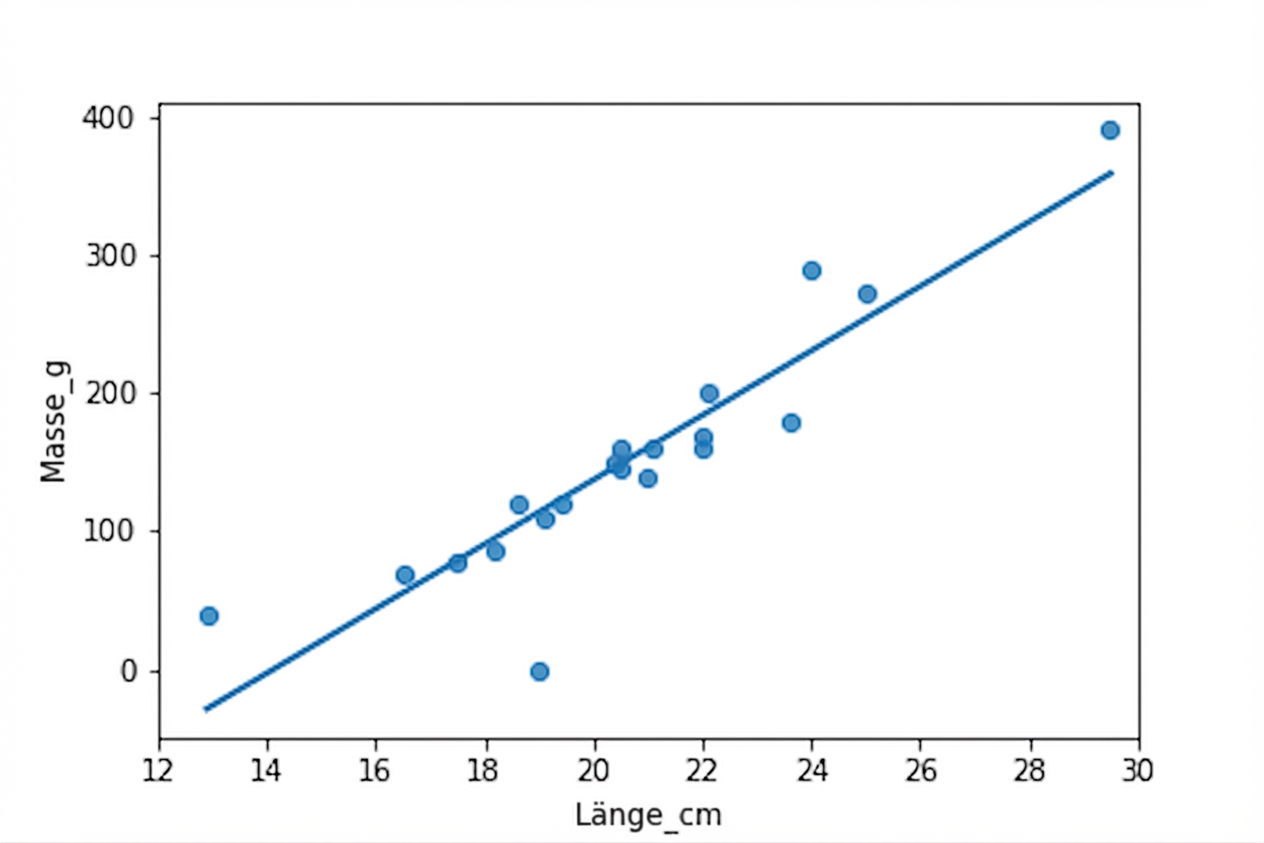
Rotaugendatensatz

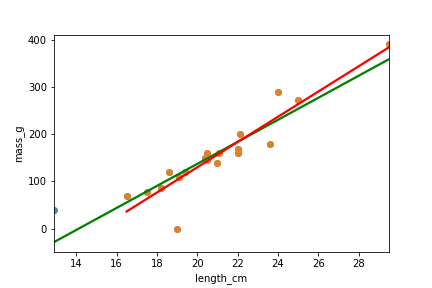
Welche Punkte sind Ausreißer?
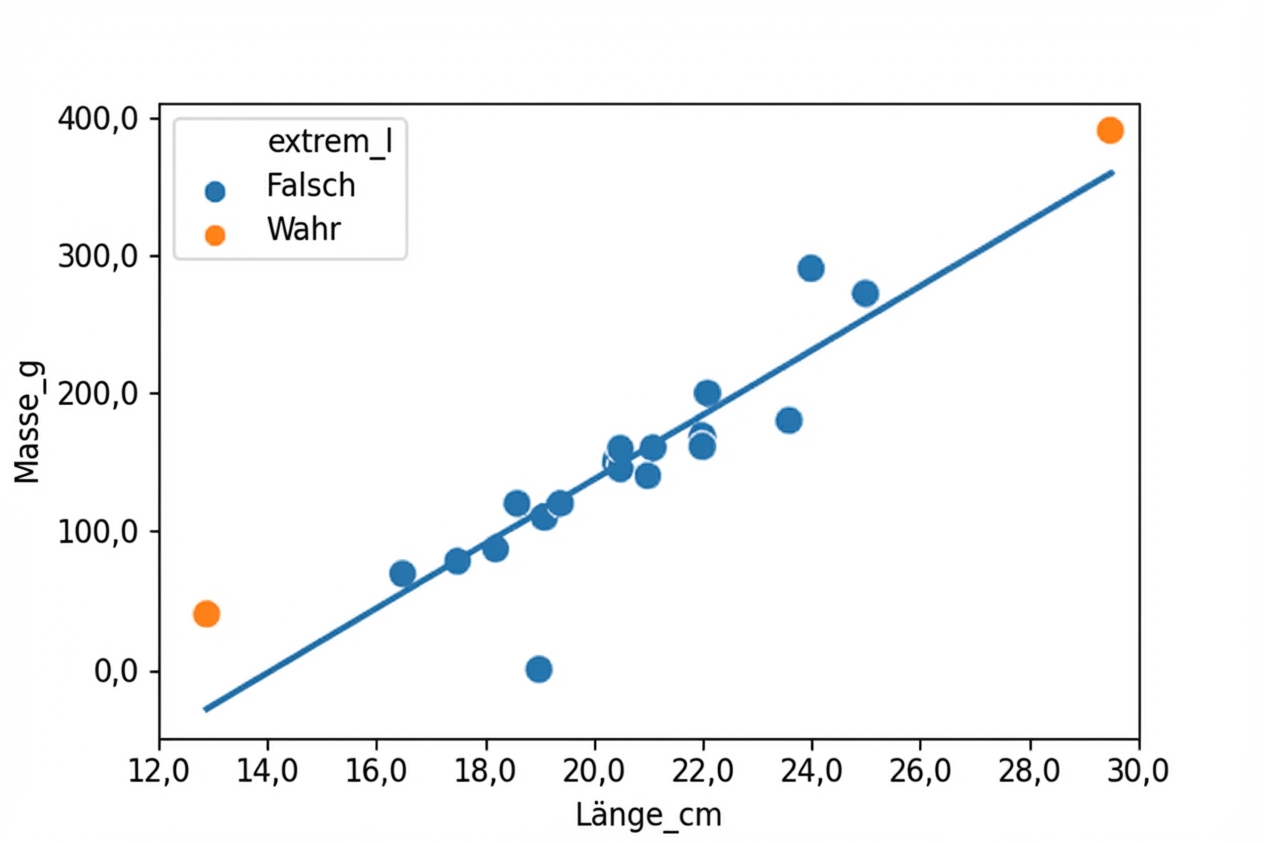
Extreme erklärende Werte
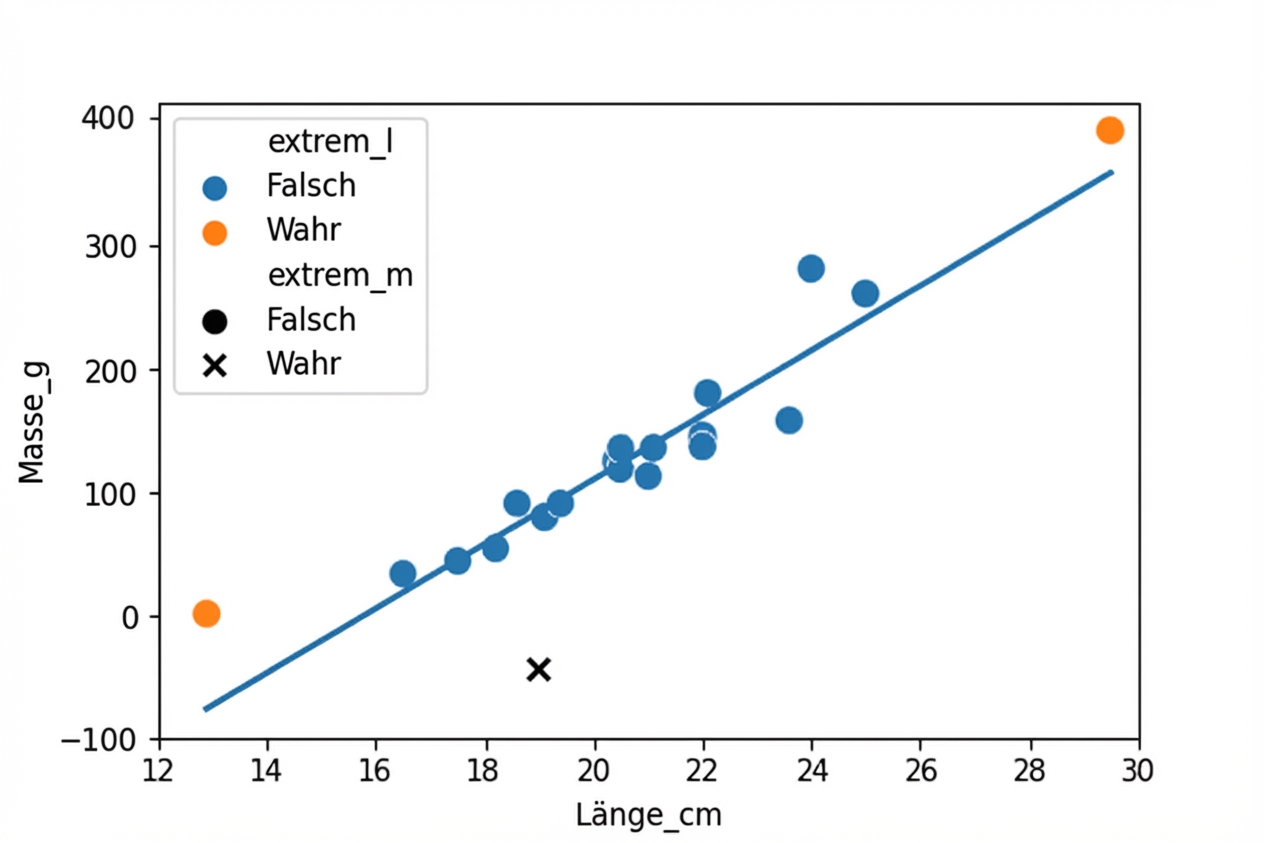
Werte, die von der Regressionsgeraden abweichen
Hebelwirkung und Einfluss
Die Hebelwirkung zeigt, wie extrem die Werte der erklärenden Variablen ausfallen.
Der Einfluss misst, wie stark sich das Modell ändern würde, wenn du die Beobachtung bei der Modellierung aus dem Datensatz weglassen würdest.

Das einflussreichste Rotauge loswerden