Quantifizierung der logistischen Regressionsgüte

Einführung in Regression mit statsmodels in Python

Maarten Van den Broeck

Content Developer at DataCamp

Die vier Ergebnisse

als „falsch“ vorhergesagt als „wahr“ vorhergesagt
tatsächlich falsch korrekt falsch positiv
tatsächlich wahr falsch negativ korrekt
Einführung in Regression mit statsmodels in Python

Konfusionsmatrix: Anzahl der Ergebnisse

actual_response = churn["has_churned"]
predicted_response = np.round(mdl_recency.predict())
outcomes = pd.DataFrame({"actual_response": actual_response,
                         "predicted_response": predicted_response})
print(outcomes.value_counts(sort=False))
actual_response  predicted_response
0                0.0                   141
                 1.0                    59
1                0.0                   111
                 1.0                    89
Einführung in Regression mit statsmodels in Python

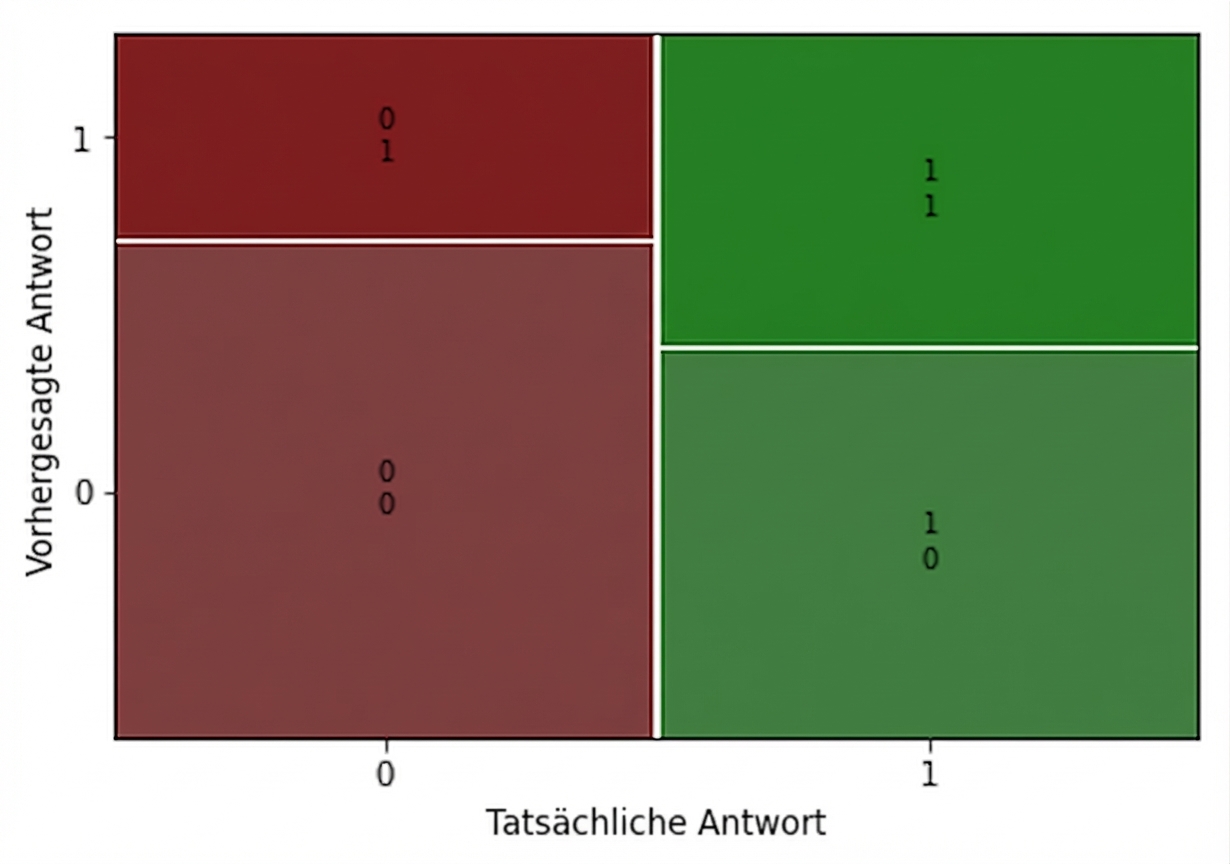
Visualisierung der Konfusionsmatrix

conf_matrix = mdl_recency.pred_table()

print(conf_matrix)
[[141.              59.]
 [111.              89.]] 
tatsächlich negativ falsch positiv
falsch negativ tatsächlich positiv
from statsmodels.graphics.mosaicplot
import mosaic

mosaic(conf_matrix)

Ein Mosaikdiagramm der Ergebnisse des Churn-versus-Recency-Modells. Es gibt jeweils 200 Beobachtungen für echte Abwanderungen und echte Nicht-Abwanderungen, sodass jede Spalte gleich breit ist.

Einführung in Regression mit statsmodels in Python

Genauigkeit

Genauigkeit ist der Anteil der korrekten Vorhersagen.

$$ \text{accuracy} = \frac{TN + TP}{TN + FN + FP + TP} $$

 [[141.,  59.],
  [111.,  89.]]
TN = conf_matrix[0,0]
TP = conf_matrix[1,1]
FN = conf_matrix[1,0]
FP = conf_matrix[0,1]
acc = (TN + TP) / (TN + TP + FN + FP)
print(acc)
0.575
Einführung in Regression mit statsmodels in Python

Empfindlichkeit

Sensitivität ist der Anteil der tatsächlich positiven Ergebnisse.

$$ \text{sensitivity} = \frac{TP}{FN + TP} $$

 [[141.,  59.],
  [111.,  89.]]
TN = conf_matrix[0,0]
TP = conf_matrix[1,1]
FN = conf_matrix[1,0]
FP = conf_matrix[0,1]
sens = TP / (FN + TP)
print(sens)
0.445
Einführung in Regression mit statsmodels in Python

Spezifität

Spezifität ist der Anteil der tatsächlichen Negativbefunde.

$$ \text{specificity} = \frac{TN}{TN + FP} $$

 [[141.,  59.],
  [111.,  89.]]
TN = conf_matrix[0,0]
TP = conf_matrix[1,1]
FN = conf_matrix[1,0]
FP = conf_matrix[0,1]
spec = TN / (TN + FP)
print(spec)
0.705
Einführung in Regression mit statsmodels in Python

Lass uns üben!

Einführung in Regression mit statsmodels in Python

Preparing Video For Download...