Data-driven product forecasting
Data-Driven Decision Making for Business

Ted Kwartler
Data Dude
Not always simple
$$

Products on products on products
The number of new products sold dictate the number of customer service phone calls received

Growth model example
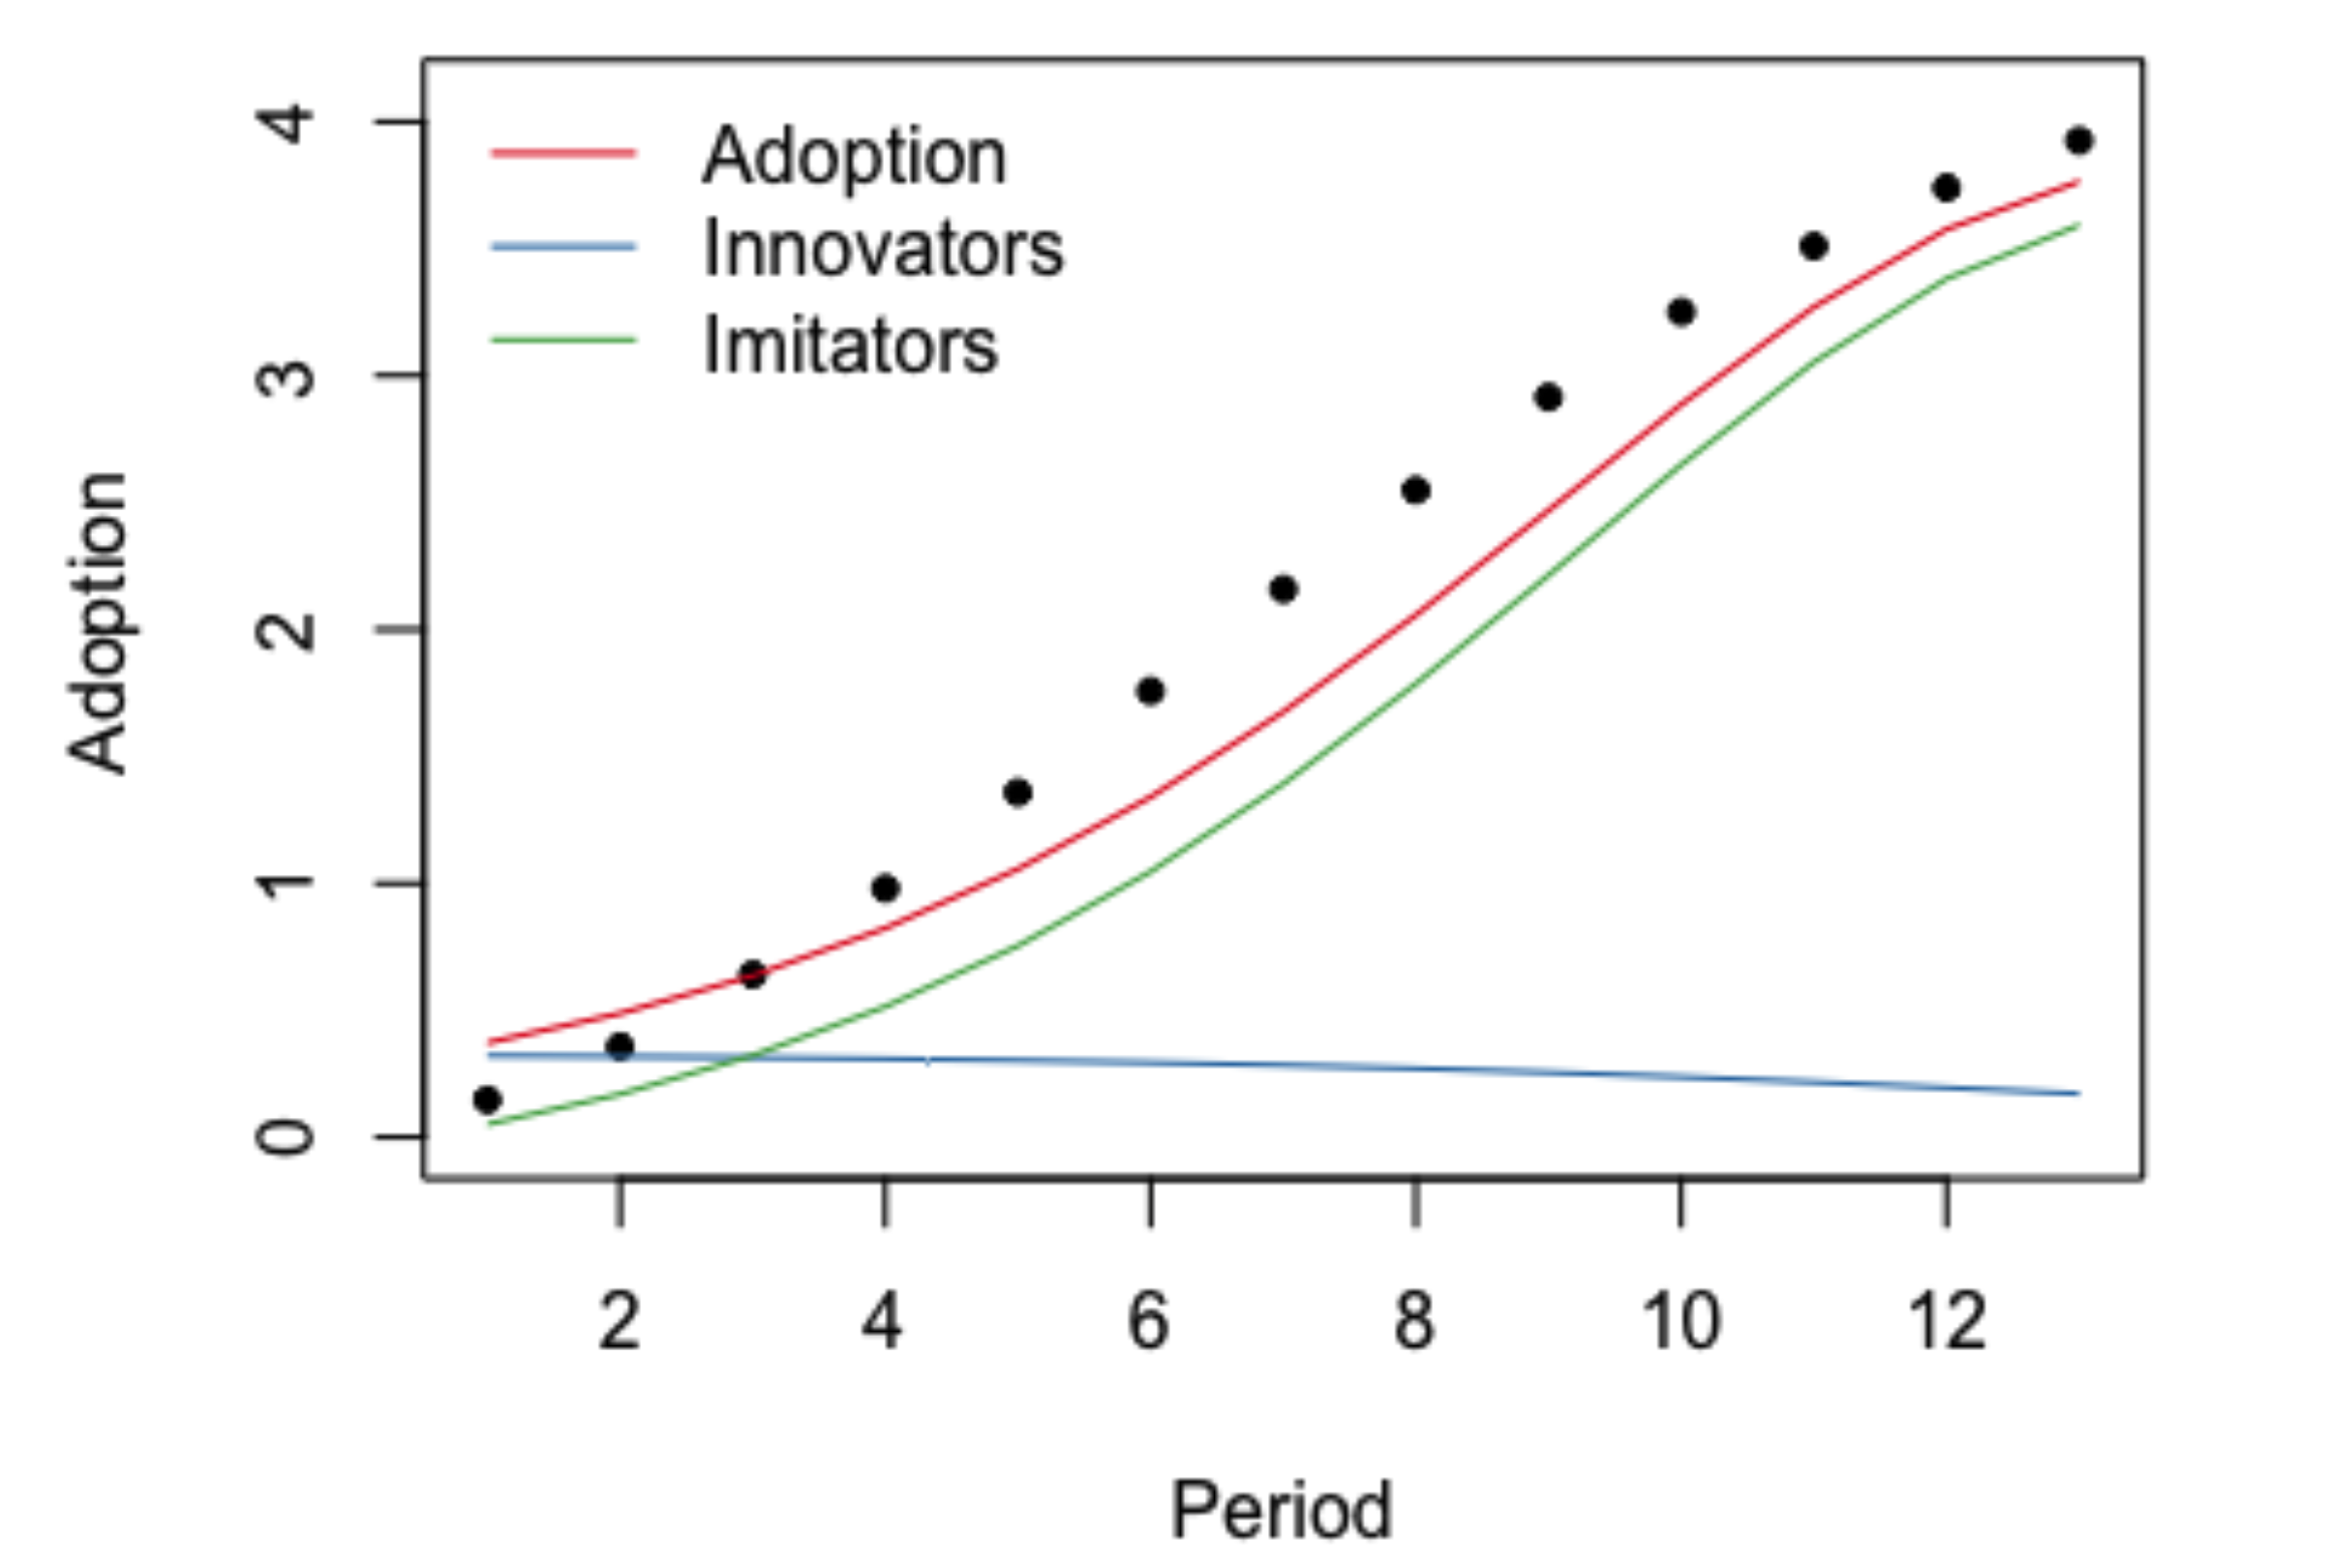
BASS model: early adopters curve and late adopter curve combine over time for the total market

Innovation vs. imitation
m: Total market capacityp: Rate of innovationq: Rate of imitation
At any given point in time, the forecast is the sum of p and q rates along reaching towards the total market capacity

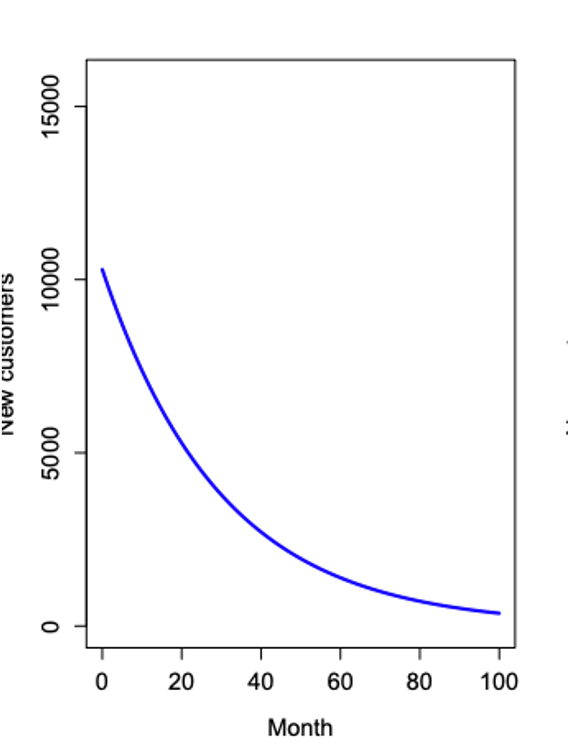
P: Innovation behavior
- Steep decline
- "People enticed and willing to take a chance"
- Smaller total number

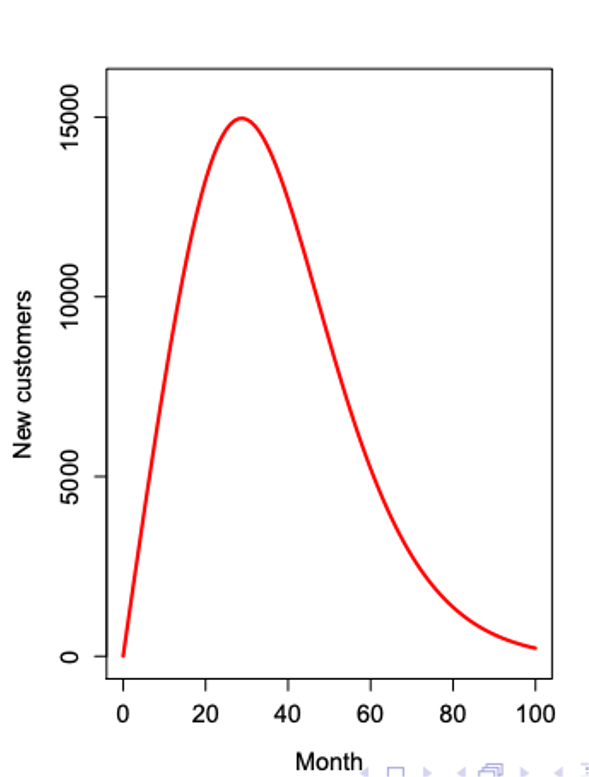
Q: Imitation behavior
- Larger total number
- Steep incline as they learn from innovators
- "People eventually won over"

P & Q side by side
P: Innovation

Q: Imitation

Altogether now

Historical P & Q
| Product | P-Inno | Q - Imit |
|---|---|---|
| B/W TV | .108 | .231 |
| Color TV | .059 | .146 |
| Room Air Con. | .006 | .185 |
| Dryers | .009 | .143 |
| CD Player | .055 | .378 |
| Cell Phones | .008 | .421 |
| Steam Iron | .031 | .128 |
| Microwave | .002 | .357 |
| Hybrid Corn | .000 | .797 |
| Home PC | .121 | .281 |
Averages:
- P = 0.03
- Q = 0.38
1 https://slideplayer.com/slide/1423750/
Let's practice!
Data-Driven Decision Making for Business

