Data-Driven Decision Making for Business
Ted Kwartler
Data Dude
$$

| Q1 (overall satisfaction) | Q2 | Q3 | Q4 | |
|---|---|---|---|---|
| Customer-1 | 1 | 5 | 5 | 5 |
| Customer-2 | 1 | 4 | 5 | 5 |
| Customer-3 | 0 | 1 | 3 | 1 |
| Customer-N | 1 | 1 | 4 | 4 |
| ... | ... | ... | ... | ... |
| Q1 (overall satisfaction) | Q2 | Q3 | Q4 | |
|---|---|---|---|---|
| Customer-1 | 1 | 5 | 5 | 5 |
| Customer-2 | 1 | 4 | 5 | 5 |
| Customer-3 | 0 | 1 | 3 | 1 |
| Customer-N | 1 | 1 | 4 | 4 |
| ... | ... | ... | ... | ... |
$$
| Q1 (overall satisfaction) | Q2 | Q3 | Q4 | |
|---|---|---|---|---|
| Customer-1 | 1 | 5 | 5 | 5 |
| Customer-2 | 1 | 4 | 5 | 5 |
| Customer-3 | 0 | 1 | 3 | 1 |
| Customer-N | 1 | 1 | 4 | 4 |
| ... | ... | ... | ... | ... |
$$
Logistic regression model
$f(\text{overall satisfaction}) = \beta_1 * Q2 + \beta_2 * Q3 + \beta_3 * Q4$
Logistic regression model
$f(\text{overall satisfaction}) = \beta_1 * Q2 + \beta_2 * Q3 + \beta_3 * Q4$
Model output
$f(\text{overall satisfaction}) = 0.25 * Q2 + 0.25 * Q3 + 1 * Q4$
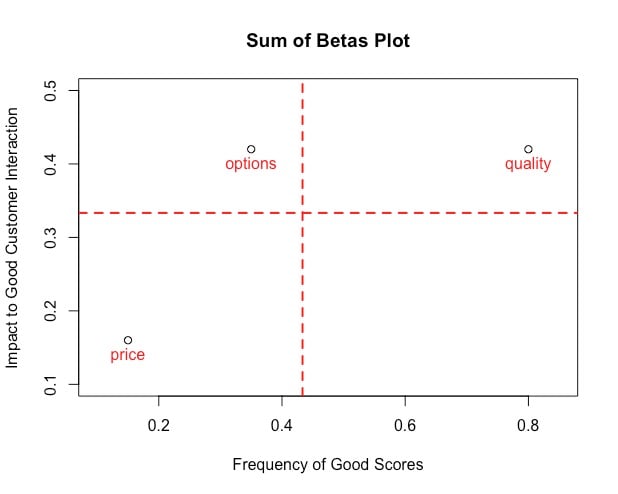
Sum of betas
| Beta | Sum of beta | Proportion | |
|---|---|---|---|
| Q2 | .25 | 0.6 | .42 |
| Q3 | .25 | 0.6 | .42 |
| Q4 | .1 | 0.6 | .16 |
$$
| Beta | Sum of beta | Proportion | |
|---|---|---|---|
| Q2 | .25 | 0.6 | .42 |
| Q3 | .25 | 0.6 | .42 |
| Q4 | .1 | 0.6 | .16 |
Adding the context of how often the organization does well in a category
| Beta | Sum of beta | Proportion | Frequency of a high score | |
|---|---|---|---|---|
| Q2 | .25 | 0.6 | .42 | .8 |
| Q3 | .25 | 0.6 | .42 | .35 |
| Q4 | .1 | 0.6 | .16 | .15 |

Data-Driven Decision Making for Business