Explainability in linear models
Explainable AI in Python

Fouad Trad
Machine Learning Engineer
Linear models
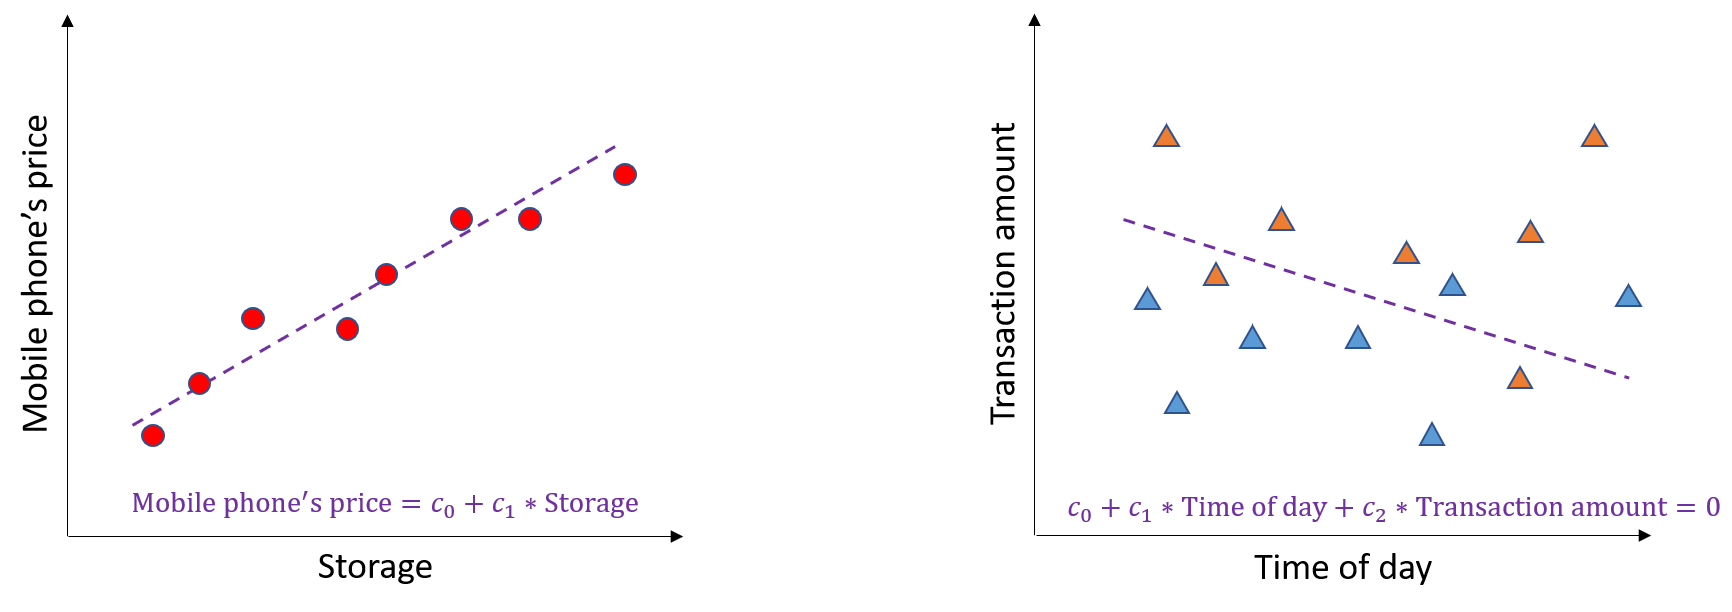
Linear regression
- Predicts continuous values

Linear models
Linear regression
- Predicts continuous values
Logistic regression
- Used for binary classification

Why are linear models explainable?
- Learn linear combination of input features
- $c_0 + c_1 \times \text{feature}_1 + c_2 \times \text{feature}_2 + \ldots + c_n \times \text{feature}_n$
Coefficients
- Tell us importance of each feature
- Higher absolute value → higher importance
- Lower absolute value → lower importance
- To compare coefficients → absolute values
- Note: Normalize feature scales before computing coefficients

Coefficients
- Tell us importance of each feature
- Higher absolute value → higher importance
- Lower absolute value → lower importance
- To compare coefficients → absolute values
- Note: Normalize feature scales before computing coefficients

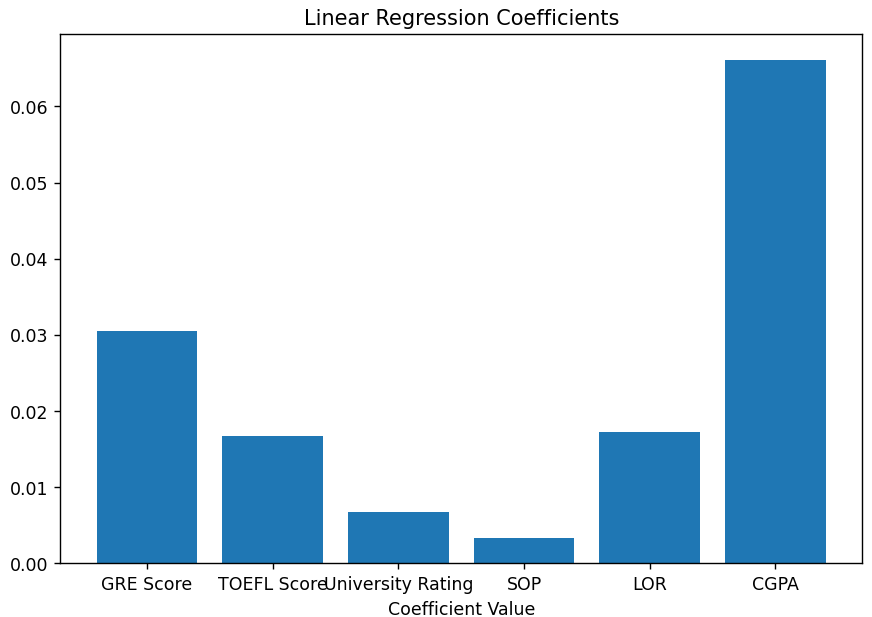
Visualizing coefficients
Linear regression
import matplotlib.pyplot as plt
plt.bar(X_train.columns, lin_reg.coef_)
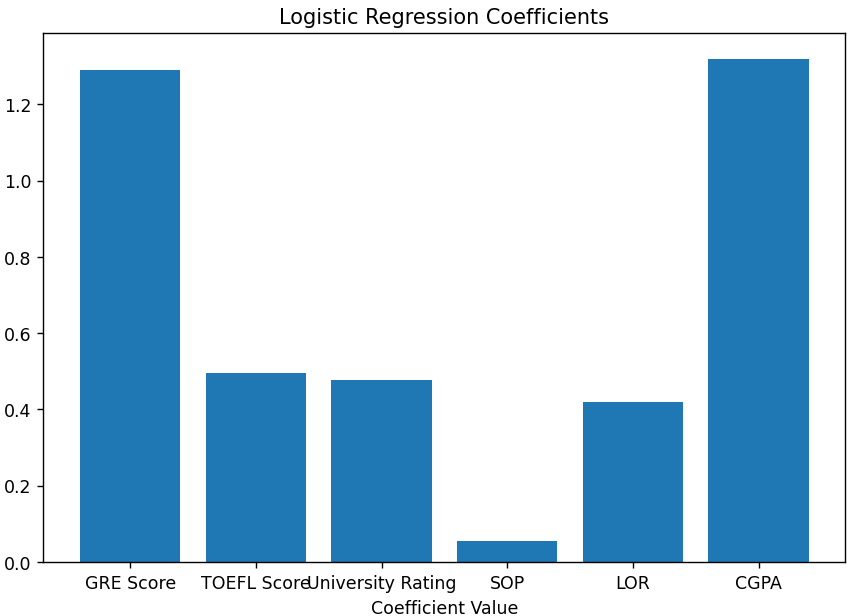
Logistic regression
import matplotlib.pyplot as plt
plt.bar(X_train.columns, log_reg.coef_[0])