Permutation importance
Explainable AI in Python

Fouad Trad
Machine Learning Engineer
Shuffling notes to determine instrument's importance

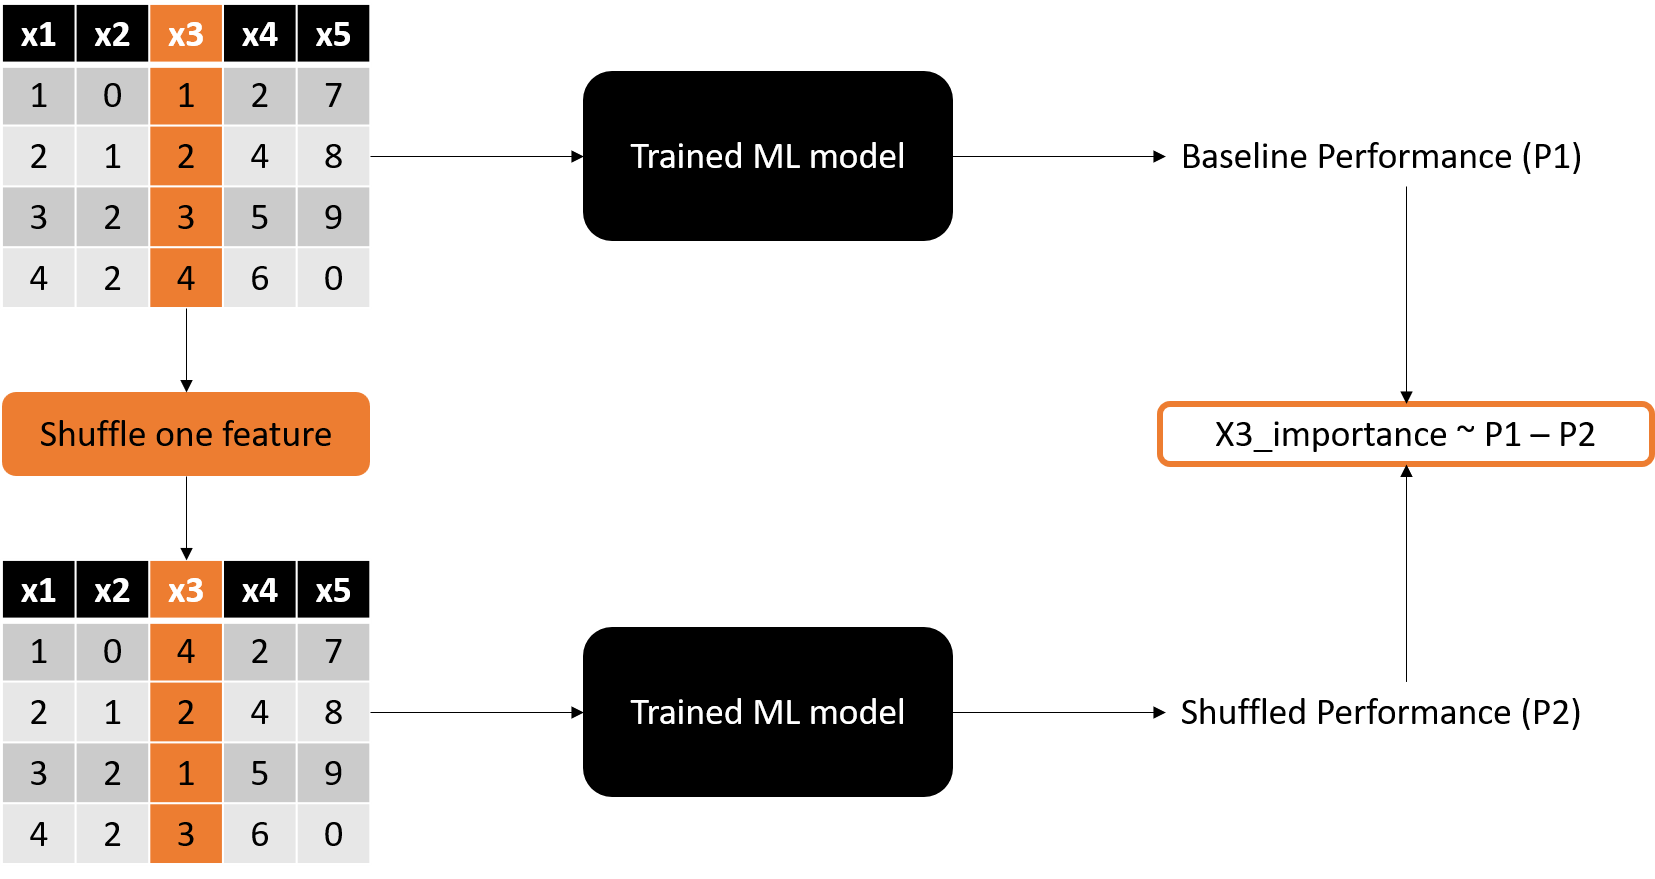
Permutation importance
Permutation importance in action
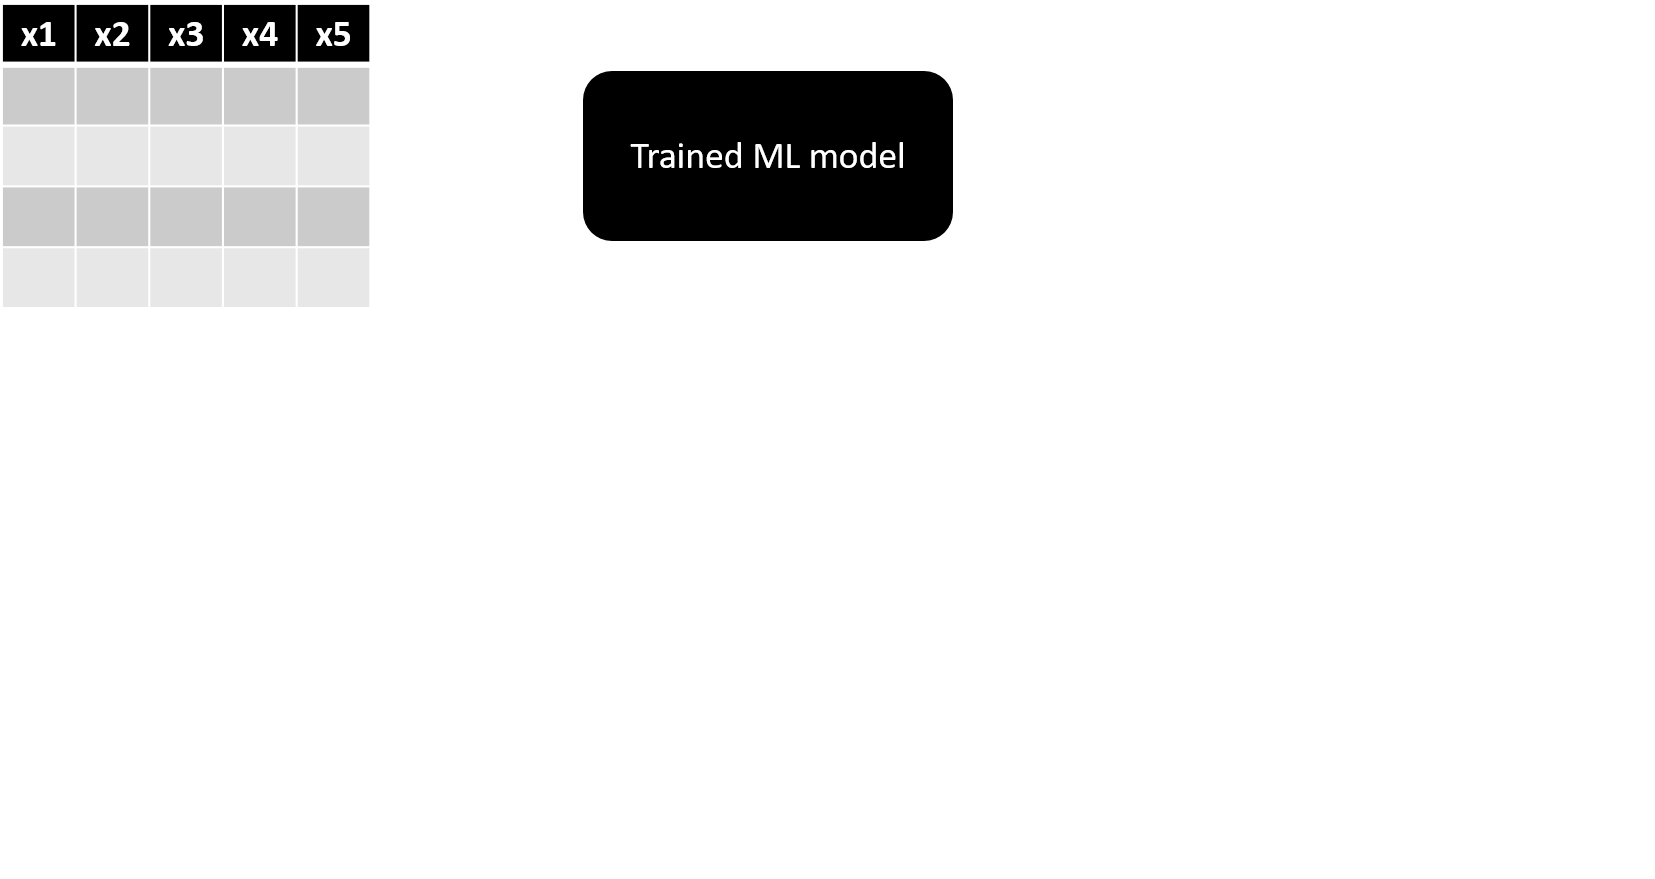
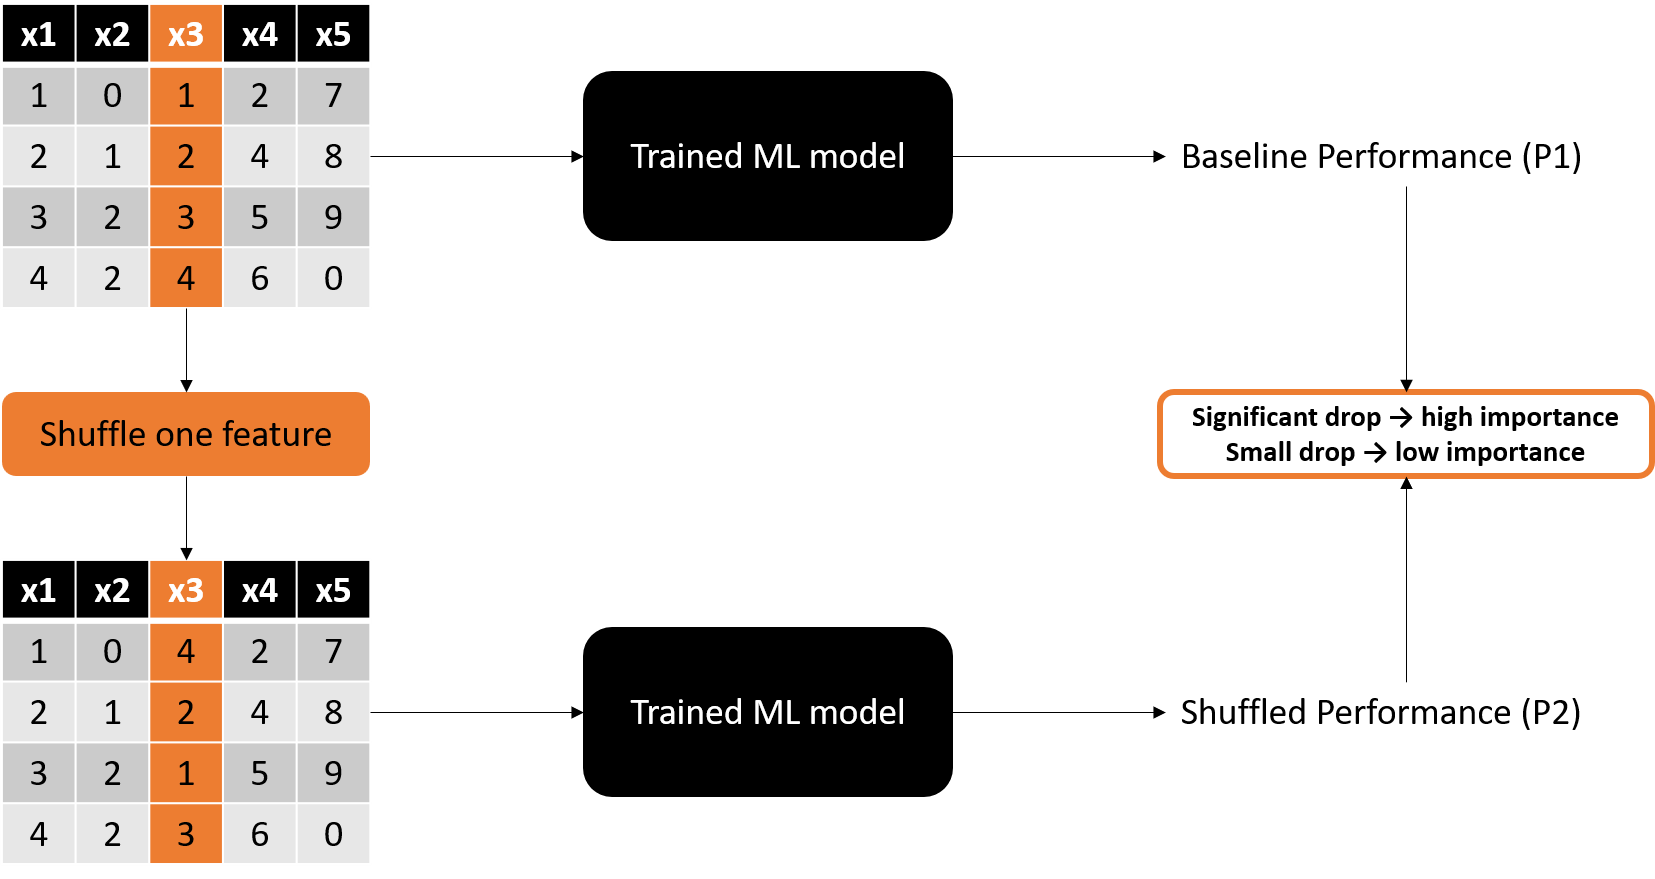
Permutation importance in action
Permutation importance in action
![Image showing that one feature is shuffled where in the original dataset its values were [1, 2, 3, 4] and in the shuffled one they became [4, 2, 1, 3]. The shuffled dataset is fed to the ML model to obtain the shuffled performance.](https://assets.datacamp.com/production/repositories/6745/datasets/8941afd8450944dd95675cf114c800a0de3d511c/PI_2.png)
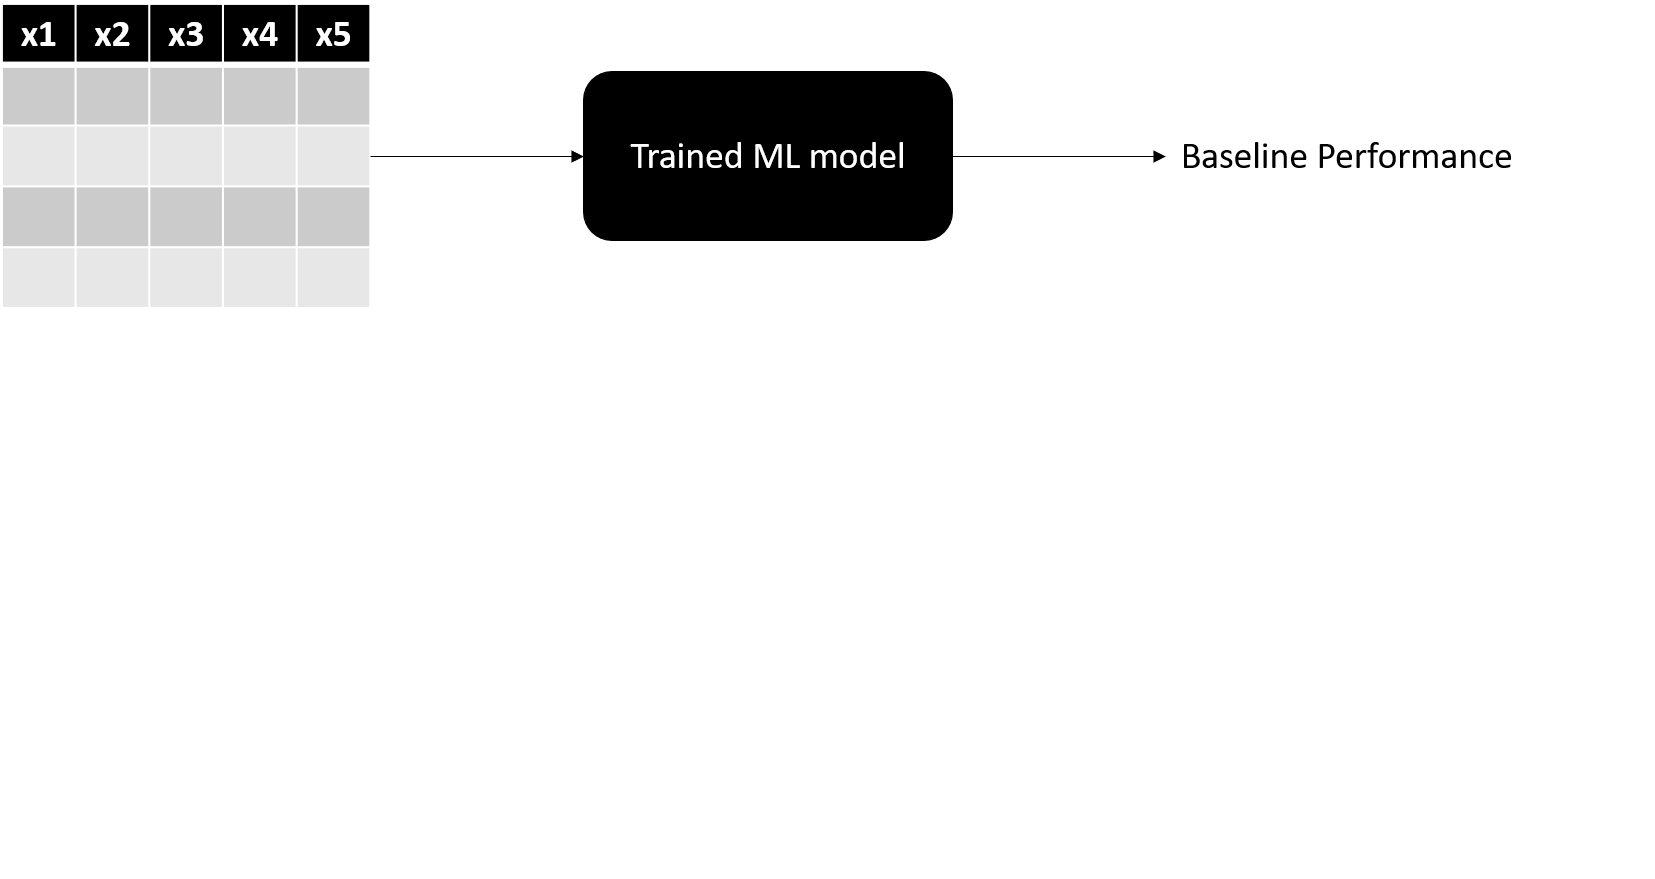
Permutation importance in action
Permutation importance in action
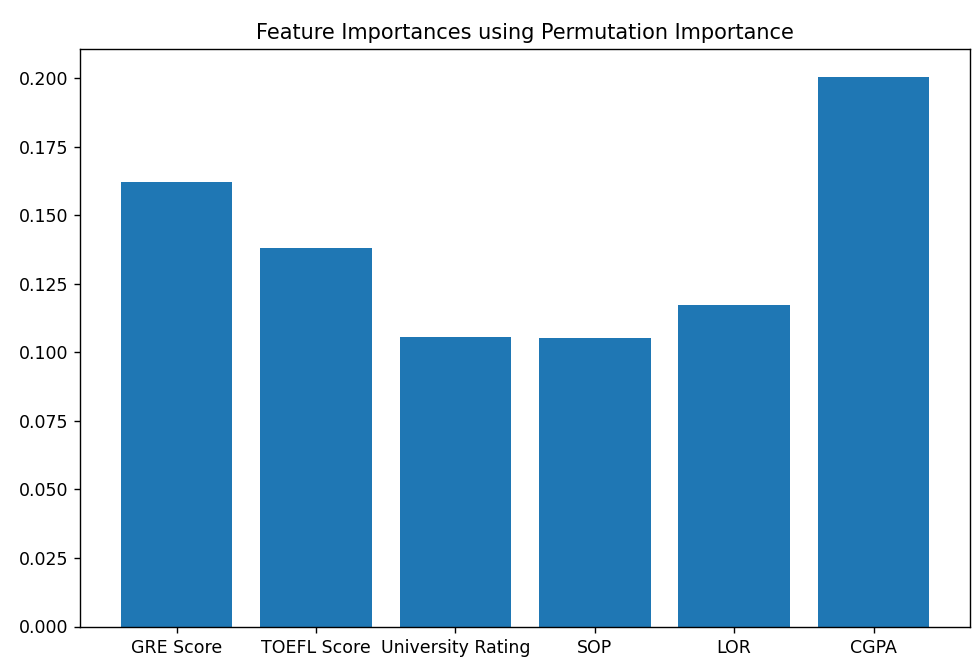
Visualizing importance
import matplotlib.pyplot as plt
plt.bar(X_train.columns,
        result.importances_mean)
Comparison with model-specific approaches
import matplotlib.pyplot as plt
plt.bar(X_train.columns,
        result.importances_mean)
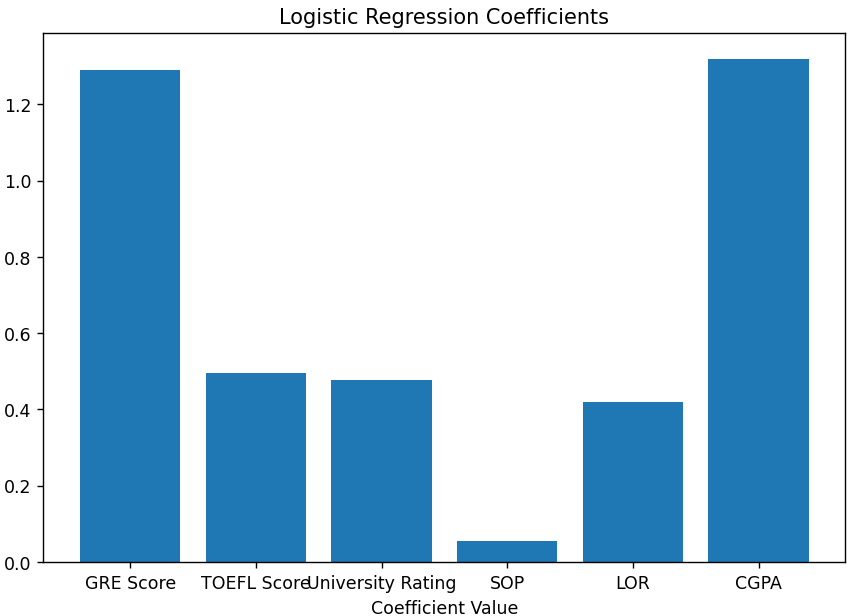
Logistic regression
plt.bar(X_train.columns, np.abs(log_reg.coef_[0]))