Visualizing SHAP explainability
Explainable AI in Python

Fouad Trad
Machine Learning Engineer
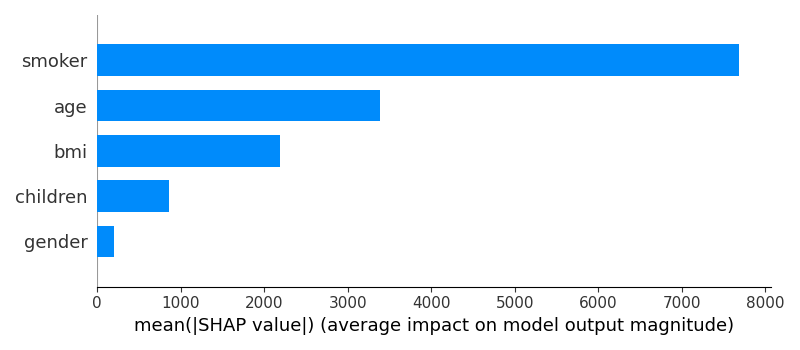
Feature importance plot
- Shows contribution of each feature on model output
shap.summary_plot(shap_values, X, plot_type="bar")
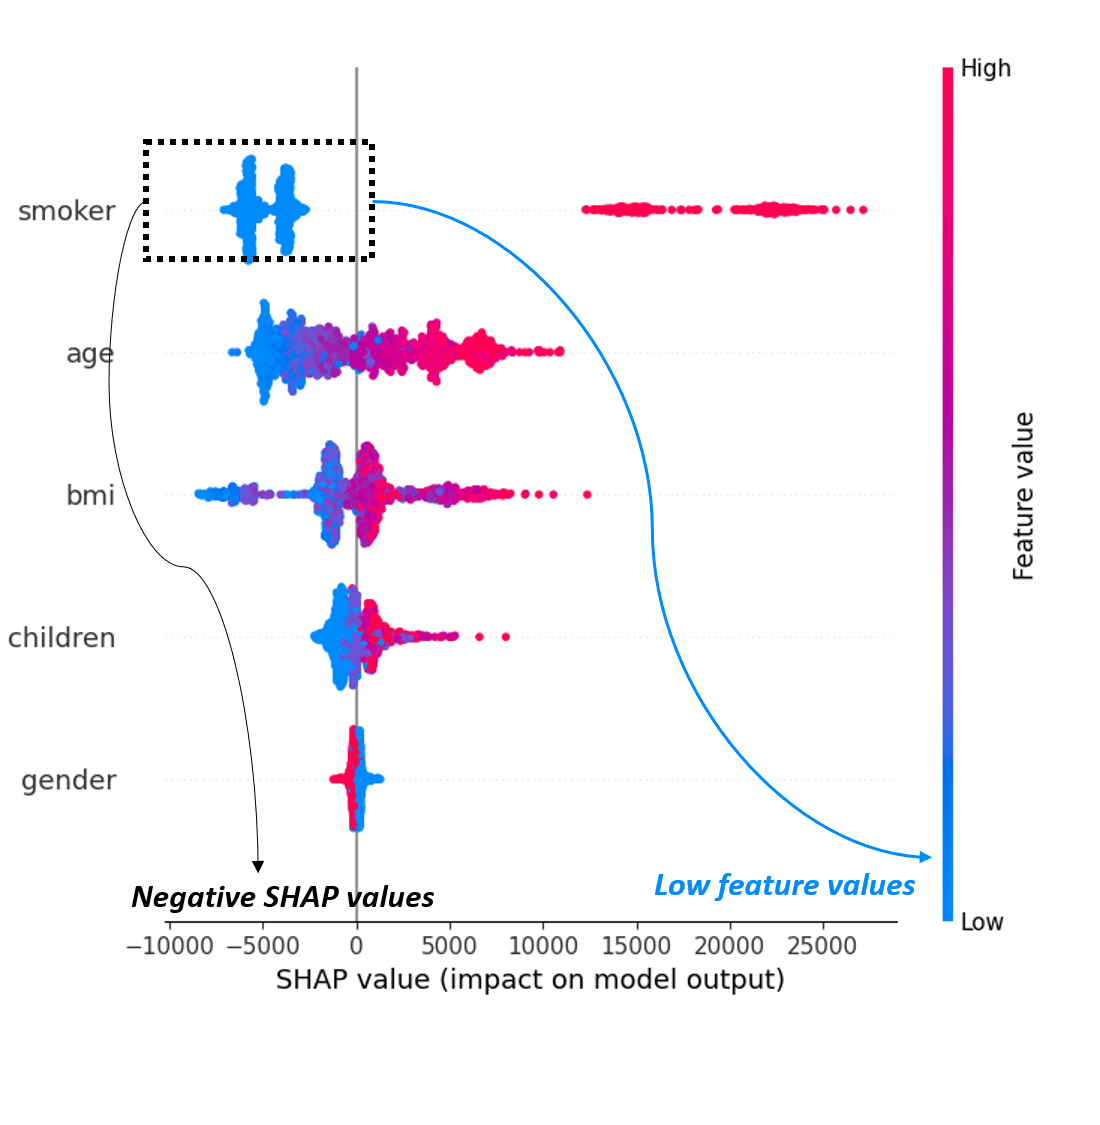
Beeswarm plot
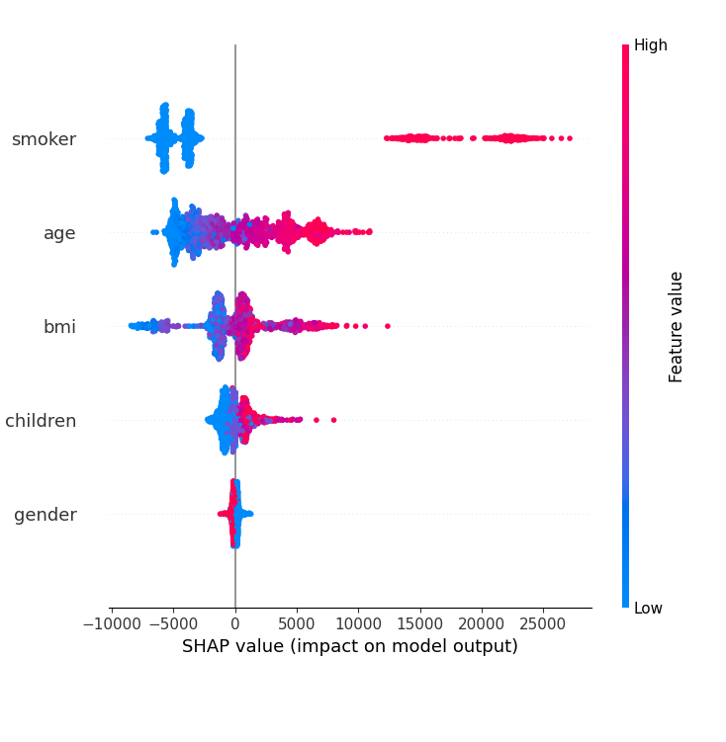
Beeswarm plot
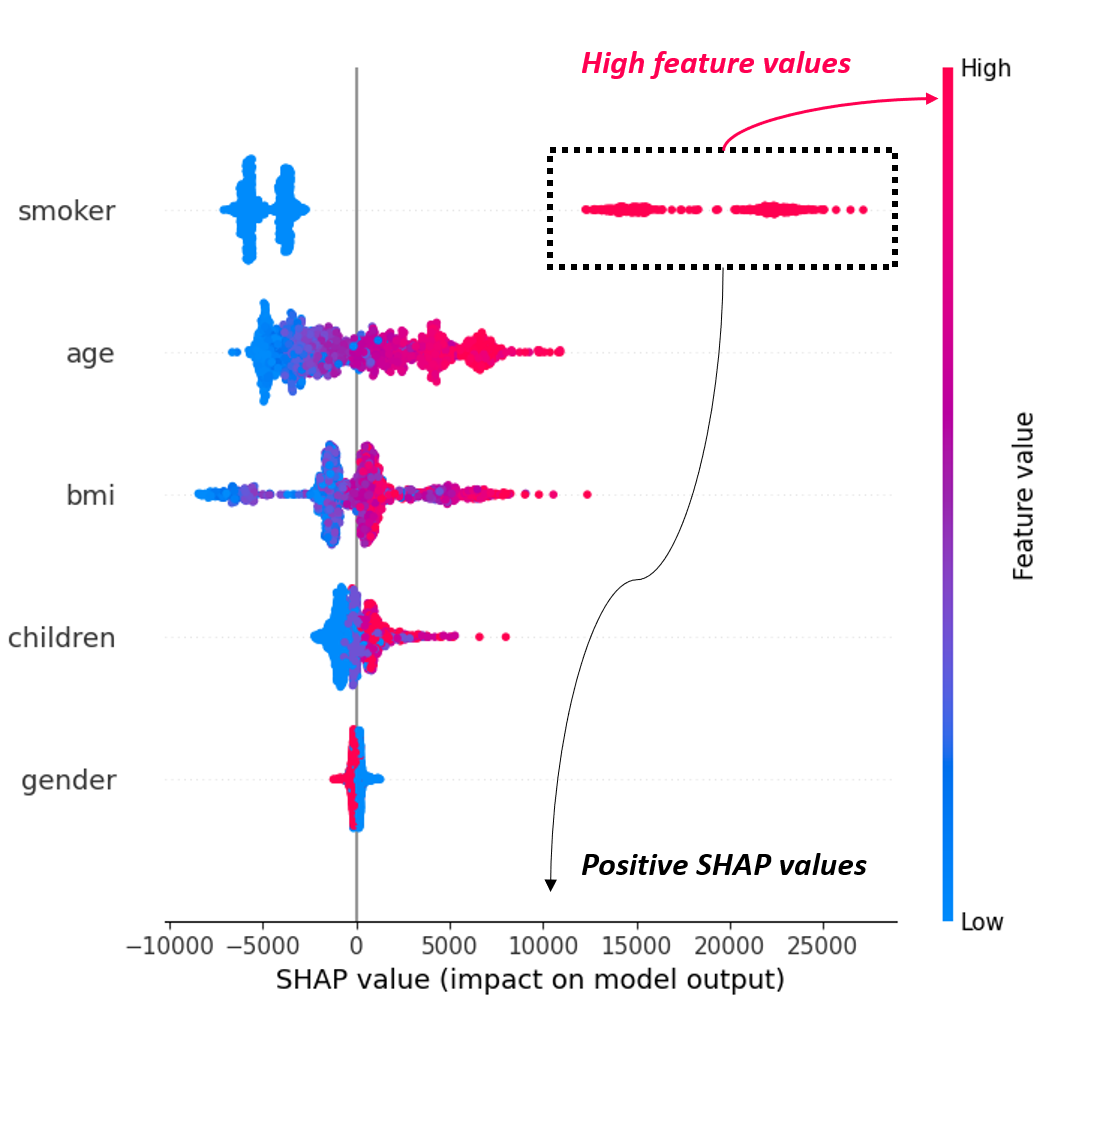
Beeswarm plot
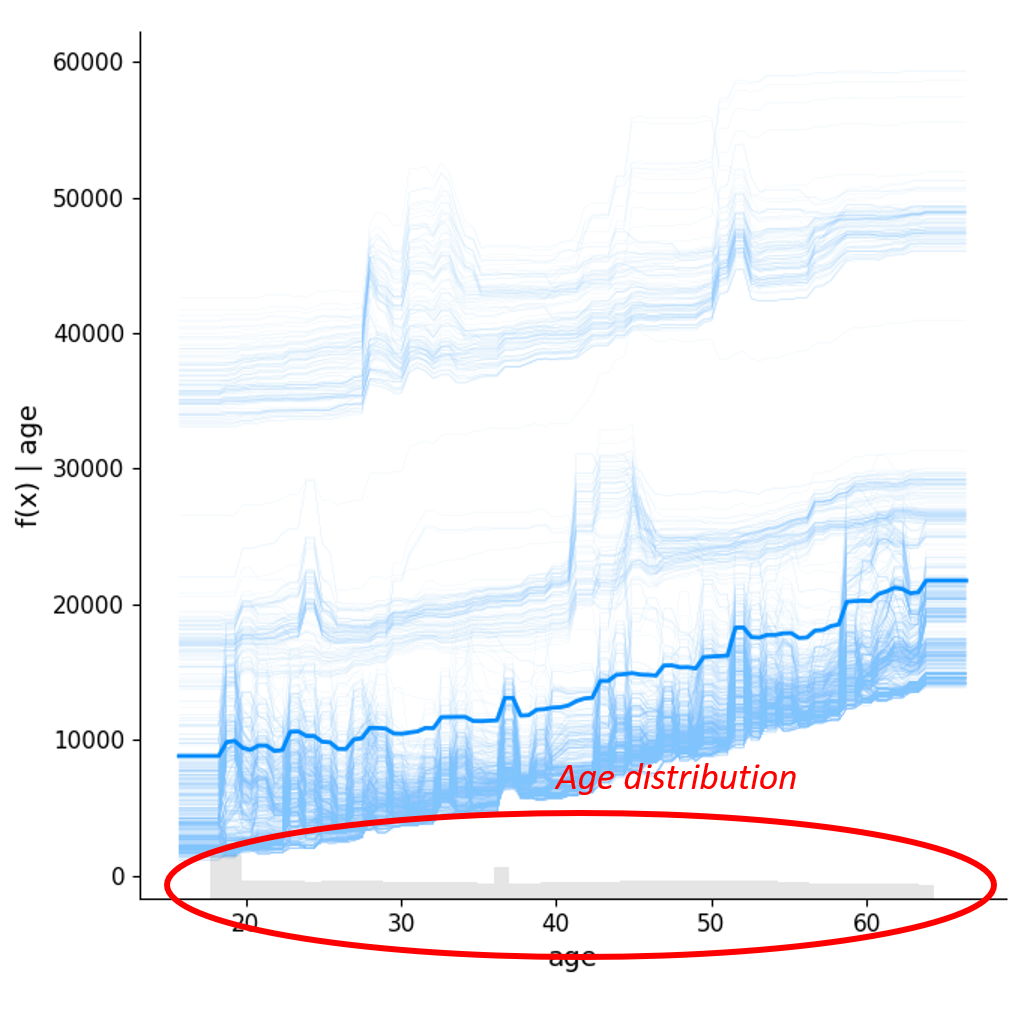
Partial dependence plot
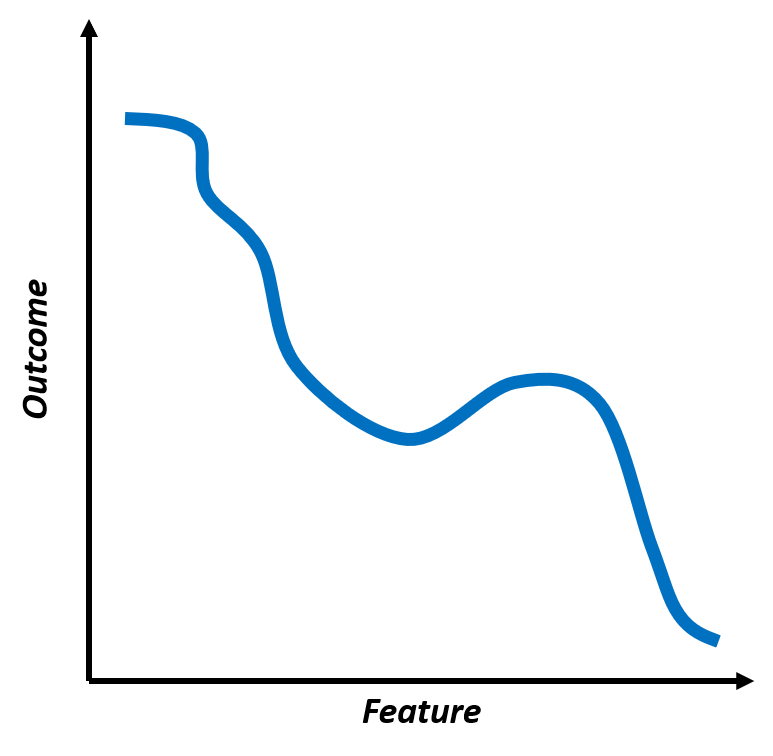
Partial dependence plot
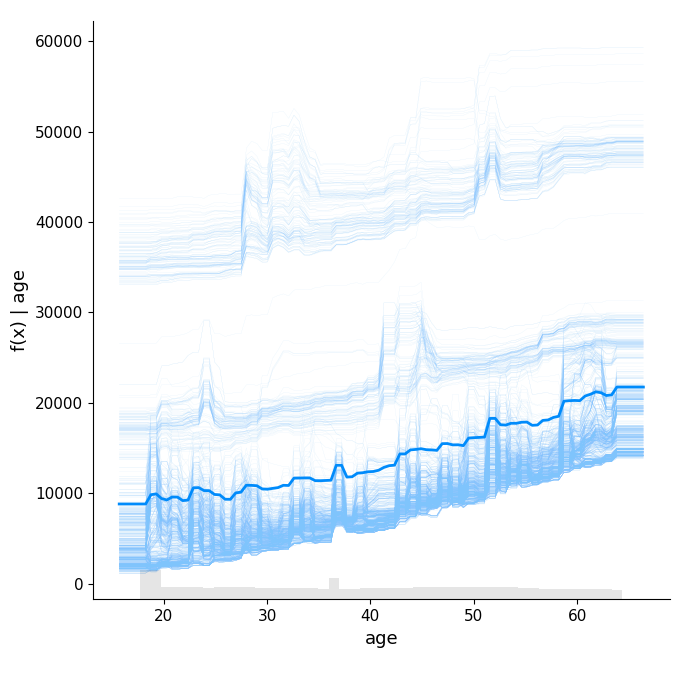
Partial dependence plot