Other traditional asset investing
Data-Driven Decision Making for Business

Ted Kwartler
Data Dude
Investing in a vacation condo

| Month | Occupied Nights | Avg Per Night |
|---|---|---|
| Jan-21 | 6 | $53 |
| Feb-21 | 12 | $95 |
| Mar-21 | 18 | $134 |
Money coming in
| Month | Occupied Nights | Avg Per Night |
|---|---|---|
| Jan-21 | 6 | $53 |
| Feb-21 | 12 | $95 |
| Mar-21 | 18 | $134 |
Total money coming in
| Month | Occupied Nights | Avg Per Night | Gross Income |
|---|---|---|---|
| Jan-21 | 6 | $53 | $318 |
| Feb-21 | 12 | $95 | $1140 |
| Mar-21 | 18 | $134 | $2412 |
$$
Gross Income
- 6 nights * $53 = 318
- 12 nights * $95 = 1140
- 18 nights * $134 = 2412
Money going out
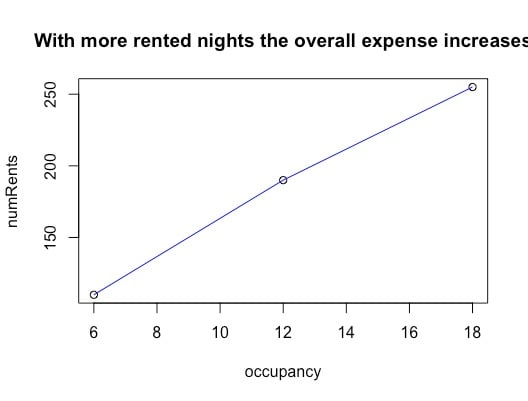
| Fixed Cost | Variable Costs | Occupied Nights | Total Costs |
|---|---|---|---|
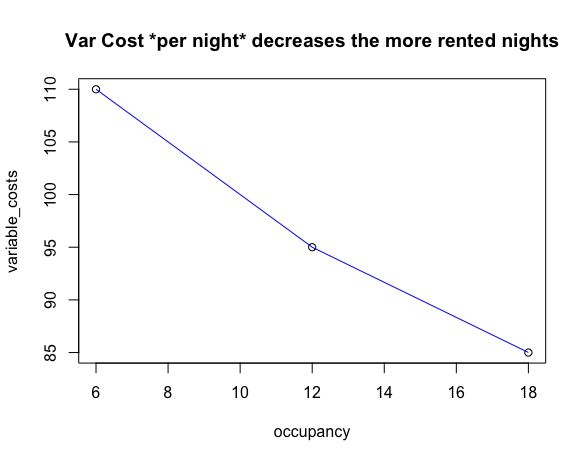
| $100 | $110 | 6 | $760 |
| $100 | $95 | 12 | $1240 |
| $100 | $85 | 18 | $1630 |
$$
Fixed Cost + Variable Costs = Total Costs
- 100 + ($110 * 6 nights occupied) = 760
- 100 + ($95 * 12 nights occupied) = 1240
- 100 + ($85 * 18 nights occupied) = 1630
How should variable costs behave?
$$

$$

Calculating the operating expense ratio (OER)
| Month | Occupied Nights | Avg Per Night | Gross Income | Total Costs | Income - Costs | OER |
|---|---|---|---|---|---|---|
| Jan-21 | 6 | $53 | 795 | 760 | 35 | 0.955 |
| Feb-21 | 12 | $95 | 1,140 | 1,240 | -100 | 1.087 |
| Mar-21 | 18 | $134 | 2,412 | 1,630 | 782 | 0.675 |
$$
Operating Expense Ratio: Total Costs / Gross Income
- 760 / 795 = 0.955
- 1240 / 1140 = 1.087
- 1630 / 2412 = 0.675
Summarizing OER
| Month | Occupied Nights | Avg Per Night | Gross Income | Total Costs | Income - Costs | OER |
|---|---|---|---|---|---|---|
| Jan-21 | 6 | $53 | 795 | 760 | 35 | 0.955 |
| Feb-21 | 12 | $95 | 1,140 | 1,240 | -100 | 1.087 |
| Mar-21 | 18 | $134 | 2,412 | 1,630 | 782 | 0.675 |
- OER =
(0.955,1.087,0.675) - Weights:
- (6 Jan nights / 36 total nights) =
0.167 - (12 Feb nights / 36 total nights) =
0.33 - (18 Mar nights / 36 total nights) =
0.5
- (6 Jan nights / 36 total nights) =
- Weighted avg =
(0.955 * 0.167) + (1.087 * 0.33) + (0.675 * 0.5) = 0.859
Another investing ratio: cap rate
| Month | gross_income | total_costs | net |
|---|---|---|---|
| Jan-21 | $795 | 760 | 35 |
| Feb-21 | $1140 | 1240 | -100 |
| Mar-21 | $1340 | 1300 | 40 |
| Apr-21 | $1850 | 1350 | 500 |
| May-21 | $5000 | 2000 | 3000 |
| Jun-21 | $7000 | 2200 | 4800 |
| ... | ... | ... | ... |
| Dec-21 | $850 | 950 | -100 |
Cap Rate: Net Income / Total Cost
- Assume the annual net income= $20,000
net_income = ($35-100+782+...-100) =20000
- Assume the purchase price = $100,000
purchase_price = 100000
- Sum annual net income / total cost of the property
cap_rate = 20000 / 100000 = .20
Comparing properties
| ID | Beds | Baths | Square Feet | OER | Cap Rate |
|---|---|---|---|---|---|
| Property_1 | 2 | 1 | 750 | 0.86 | 0.2 |
| Property_2 | 3 | 1.5 | 1250 | 1.05 | 0.27 |
| Property_3 | 3 | 2 | 1500 | 0.75 | 0.33 |
| Property_4 | 2 | 1.5 | 1100 | 1.23 | 0.11 |
| Property_5 | 4 | 2 | 2000 | 0.68 | 0.13 |
Comparing properties
| ID | Beds | Baths | Square Feet | OER | Cap Rate |
|---|---|---|---|---|---|
| Property_1 | 2 | 1 | 750 | 0.86 | 0.2 |
| Property_3 | 3 | 2 | 1500 | 0.75 | 0.33 |
| Property_5 | 4 | 2 | 2000 | 0.68 | 0.13 |
$$
- Keep only OER < 1
Comparing properties
| ID | Beds | Baths | Square Feet | OER | Cap Rate |
|---|---|---|---|---|---|
| Property_3 | 3 | 2 | 1500 | 0.75 | 0.33 |
$$
- Keep only OER < 1
- Maximize cap rate
Let's practice!
Data-Driven Decision Making for Business

