Visualización en Python
Introducción a Python para finanzas

Adina Howe
Professor
Matplotlib: paquete de visualización
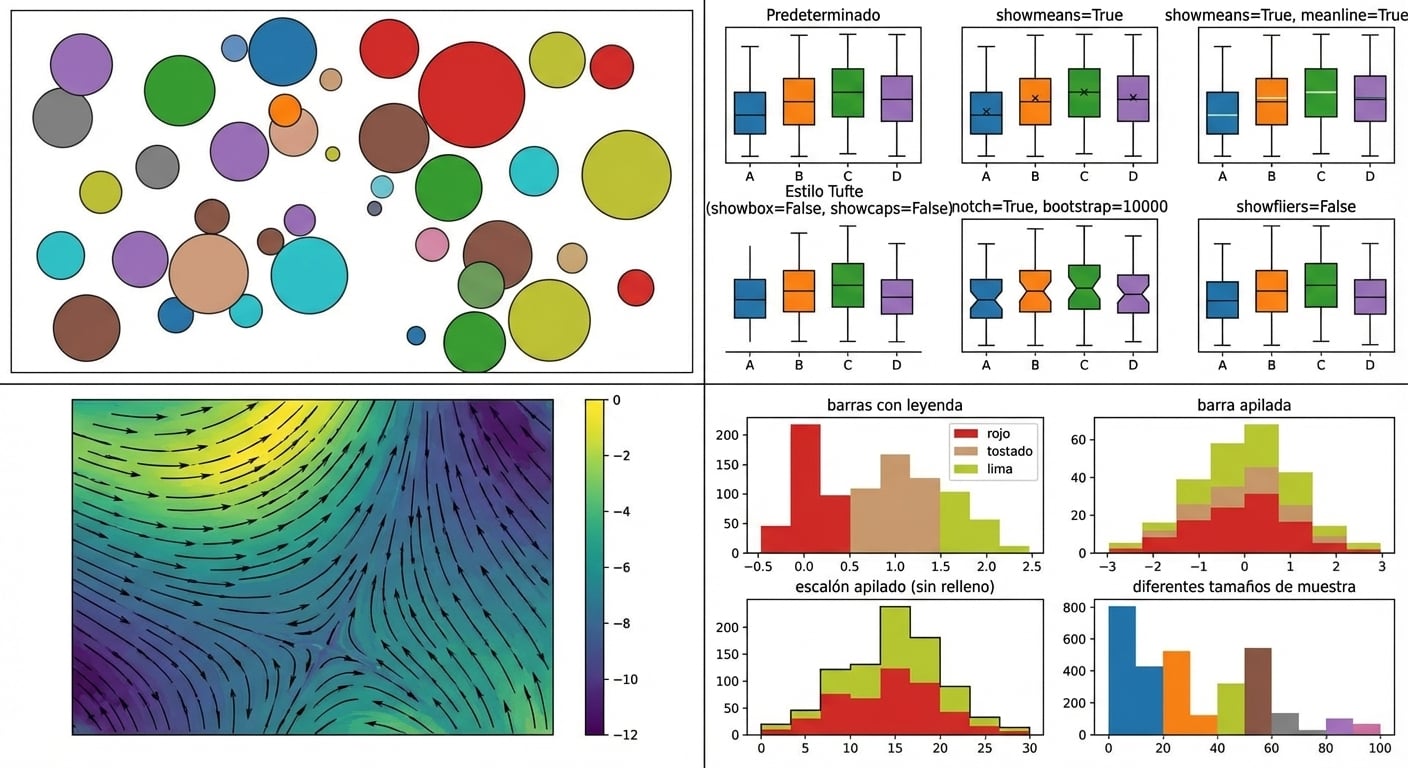
Explora más de la galería de Matplotlib en este enlace.
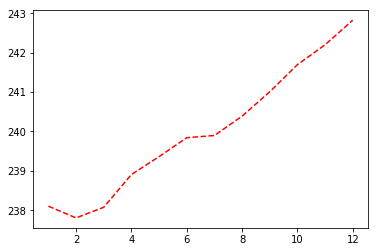
Resultado del gráfico
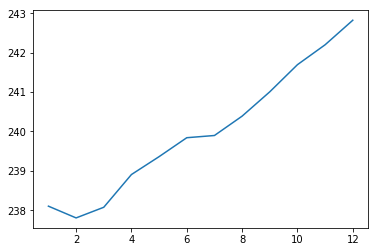
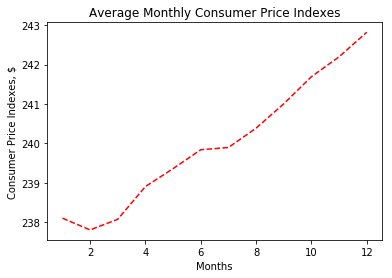
Resultado del gráfico
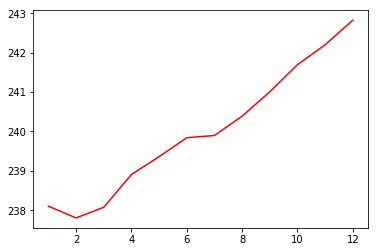
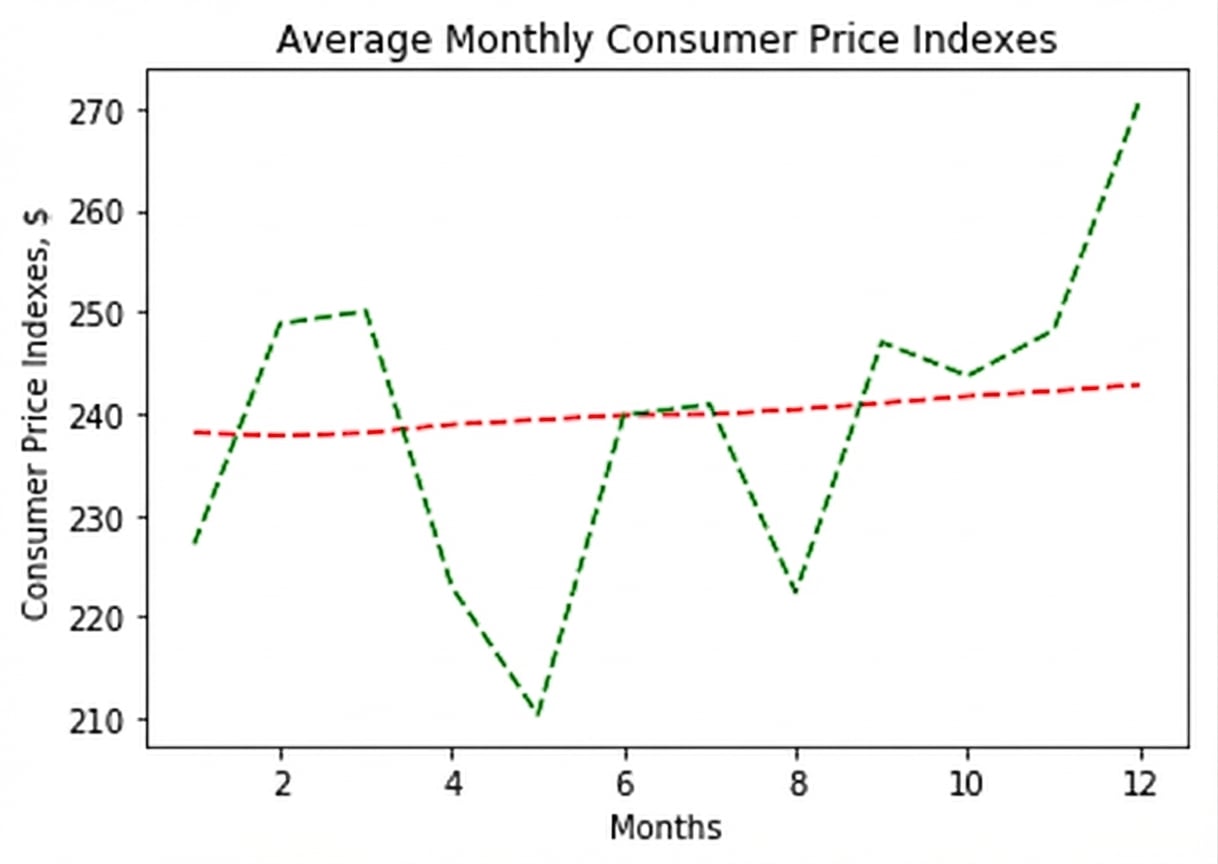
Resultado del gráfico
Resultado del gráfico
Resultado del gráfico
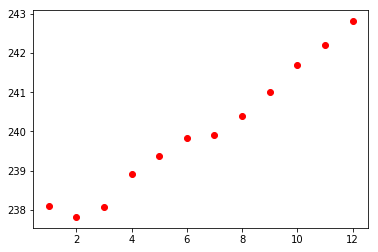
Resultado del diagrama de dispersión