Presentación del conjunto de datos
Introducción a Python para finanzas

Adina Howe
Professor
Caso práctico: S&P 100
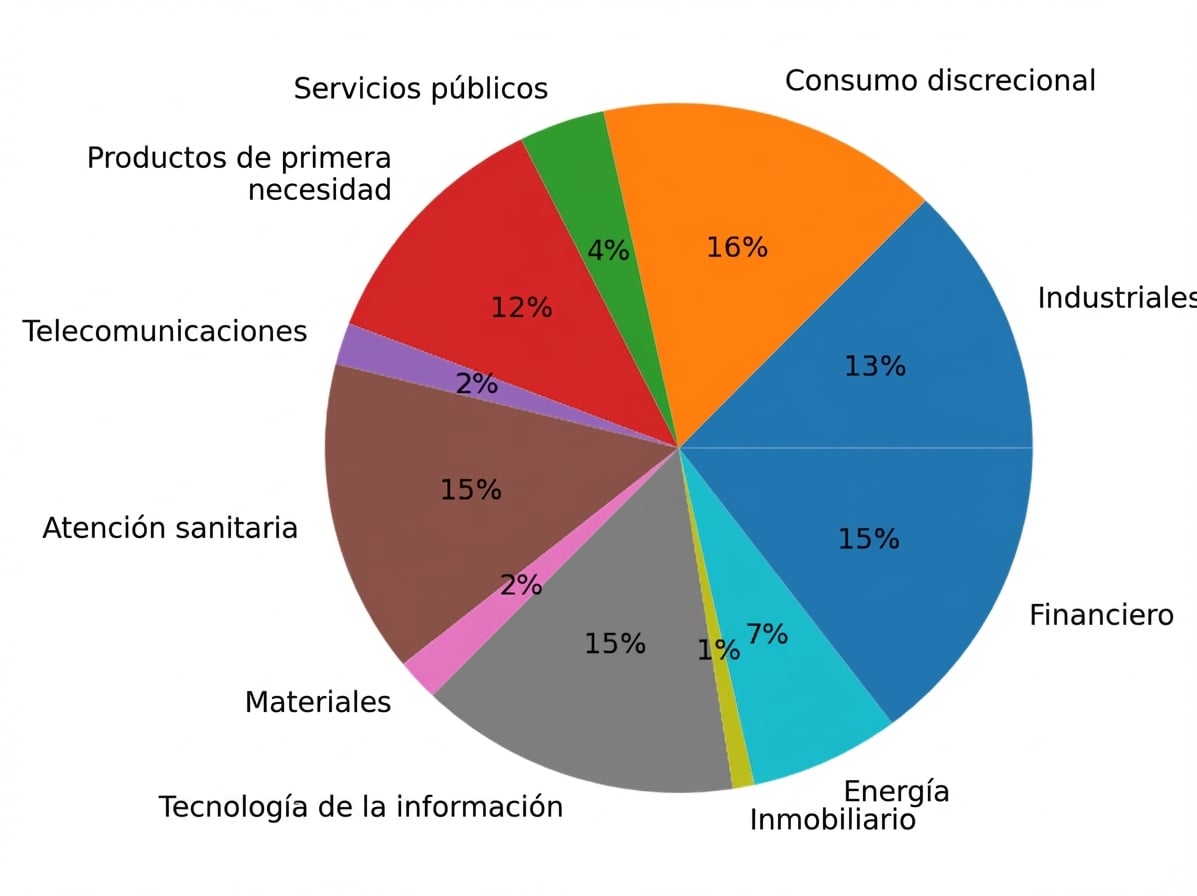
Sectores de las empresas del S&P 100 en 2017
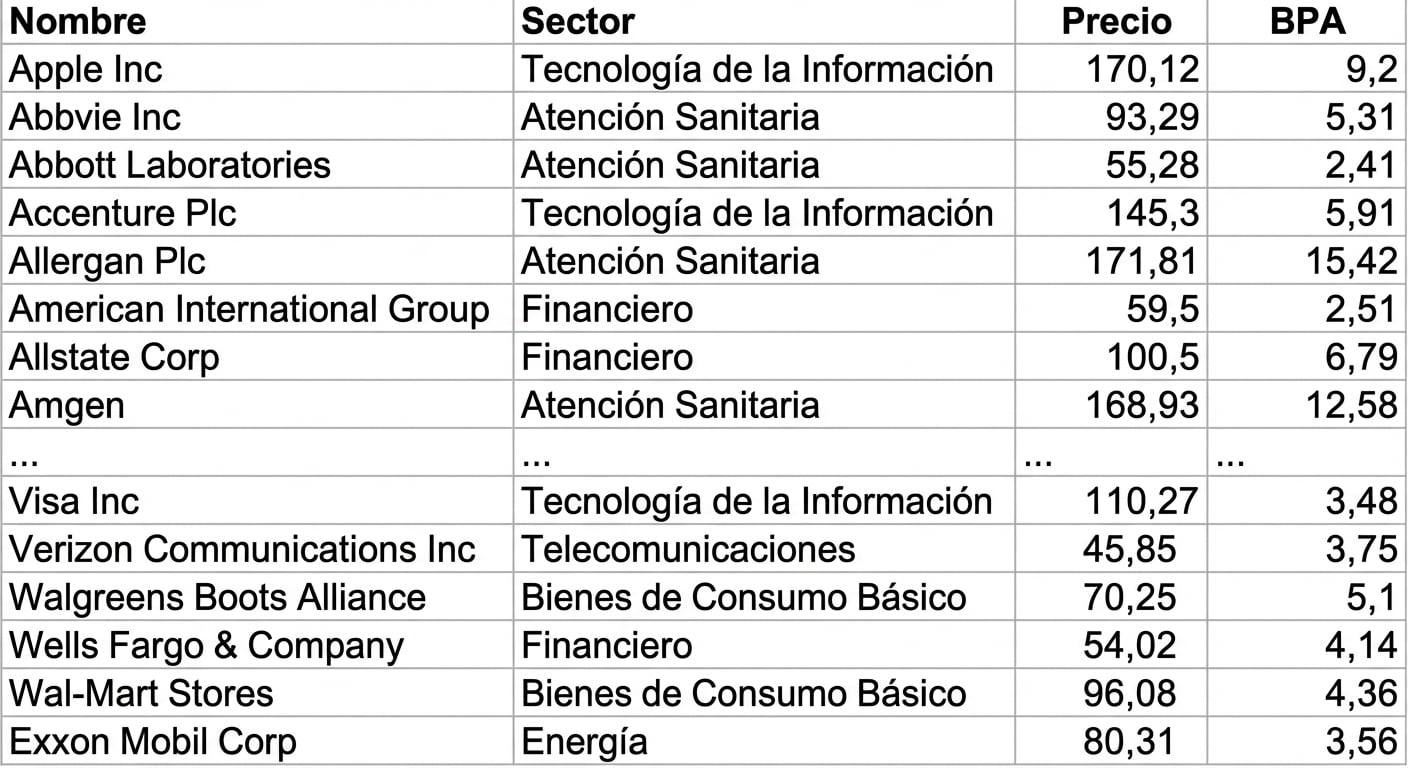
Los datos
Introducción a Python para finanzas
Adina Howe
Professor
Sectores de las empresas del S&P 100 en 2017

