Corrélation
Introduction aux statistiques en R

Maggie Matsui
Content Developer, DataCamp
Relations entre deux variables
- x = variable explicative/indépendante
- y = variable de réponse/dépendante
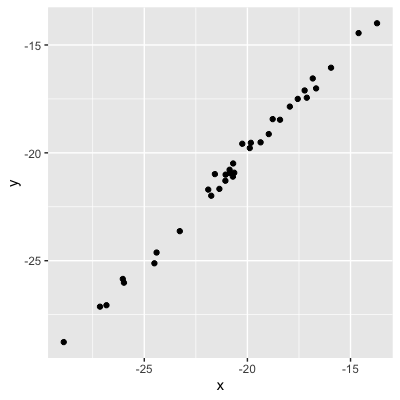
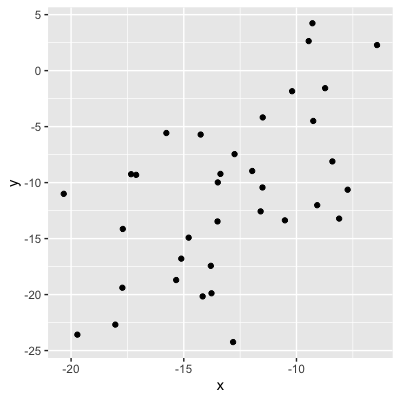
Valeur absolue = force de la relation
0,99 (relation très forte)
Valeur absolue = force de la relation
0,99 (relation très forte)
0,75 (relation forte)
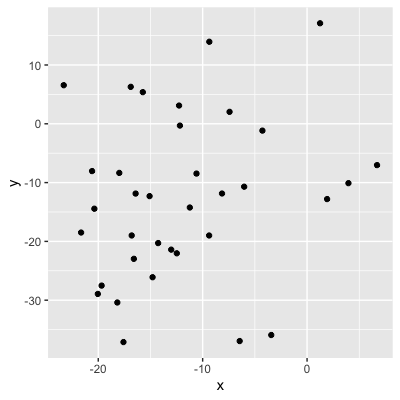
Valeur absolue = force de la relation
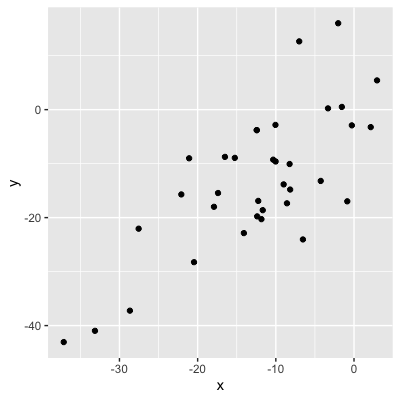
0,56 (relation modérée)
Valeur absolue = force de la relation
0,56 (relation modérée)
0,21 (relation faible)
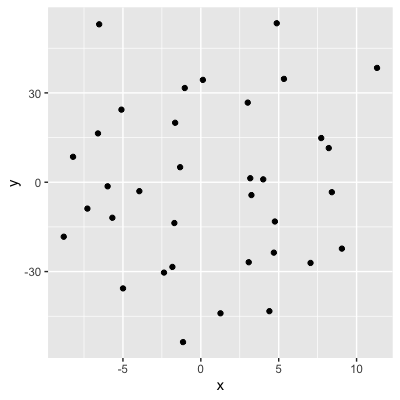
Valeur absolue = force de la relation
0,04 (pas de relation)
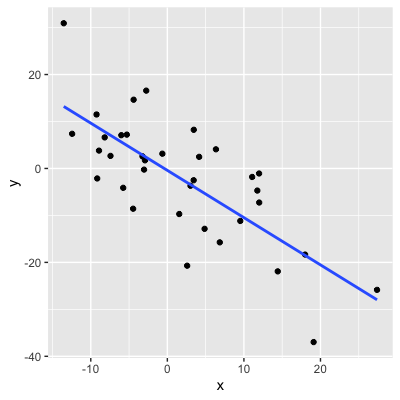
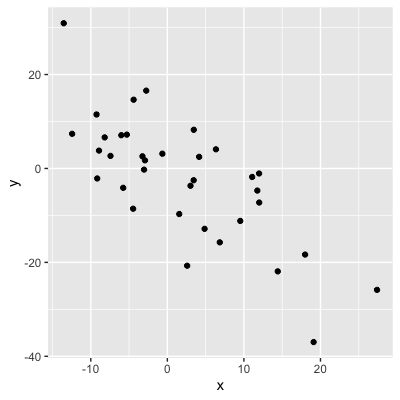
Signe = direction
0,75 : lorsque x augmente, y augmente
-0,75 : lorsque x augmente, y diminue
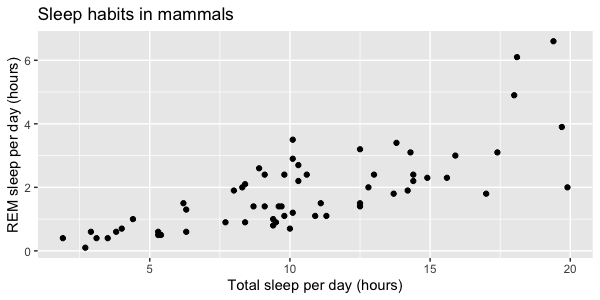
Visualiser les relations
Ajout d’une ligne de tendance