Les tendances au fil du temps
Analyse de données exploratoires en Python

Izzy Weber
Curriculum Manager, DataCamp
Les tendances au fil du temps
divorce = pd.read_csv("divorce.csv")
divorce.head()
  marriage_date  marriage_duration
0    2000-06-26                5.0
1    2000-02-02                2.0
2    1991-10-09                10.0
3    1993-01-02                10.0
4    1998-12-11                7.0
Importation de données de type DateTime
- Les données DateTime doivent être explicitement déclarées à Pandas.
divorce.dtypes
marriage_date         object
marriage_duration    float64
dtype: object
Importation de données de type DateTime
divorce = pd.read_csv("divorce.csv", parse_dates=["marriage_date"])
divorce.dtypes
marriage_date        datetime64[ns]
marriage_duration           float64
dtype: object
Conversion en données DateTime
pd.to_datetime()convertit les arguments en données DateTime
divorce["marriage_date"] = pd.to_datetime(divorce["marriage_date"])
divorce.dtypes
marriage_date        datetime64[ns]
marriage_duration           float64
dtype: object
Création de données DateTime
divorce.head(2)
   month  day  year  marriage_duration
0      6   26  2000                5.0
1      2    2  2000                2.0
divorce["marriage_date"] = pd.to_datetime(divorce[["month", "day", "year"]])
divorce.head(2)
    month  day  year  marriage_duration  marriage_date

 0      6   26  2000                5.0     2000-06-26
 1      2    2  2000                2.0     2000-02-02
Création de données DateTime
- Extraire des parties d'une date complète à l'aide des attributs «
dt.month», «dt.day» et «dt.year».
divorce["marriage_month"] = divorce["marriage_date"].dt.month
divorce.head()
    marriage_date  marriage_duration  marriage_month
 0     2000-06-26                5.0               6
 1     2000-02-02                2.0               2
 2     1991-10-09               10.0              10
 3     1993-01-02               10.0               1
 4     1998-12-11                7.0              12
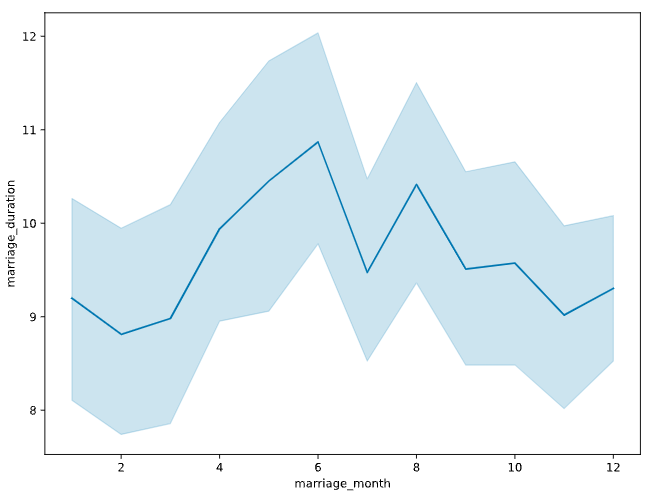
Visualisation des tendances au fil du temps
sns.lineplot(data=divorce, x="marriage_month", y="marriage_duration")
plt.show()
![Graphique linéaire illustrant la relation entre le mois du mariage et la durée du mariage] (https://assets.datacamp.com/production/repositories/6180/datasets/65ea5213afa3bf6e1227c8d6f58c4f56b9fbf57d/marriage_lineplot.png = 45)
Passons à la pratique !
Analyse de données exploratoires en Python

