Explore the data
Monte Carlo Simulations in Python

Izzy Weber
Curriculum Manager, DataCamp
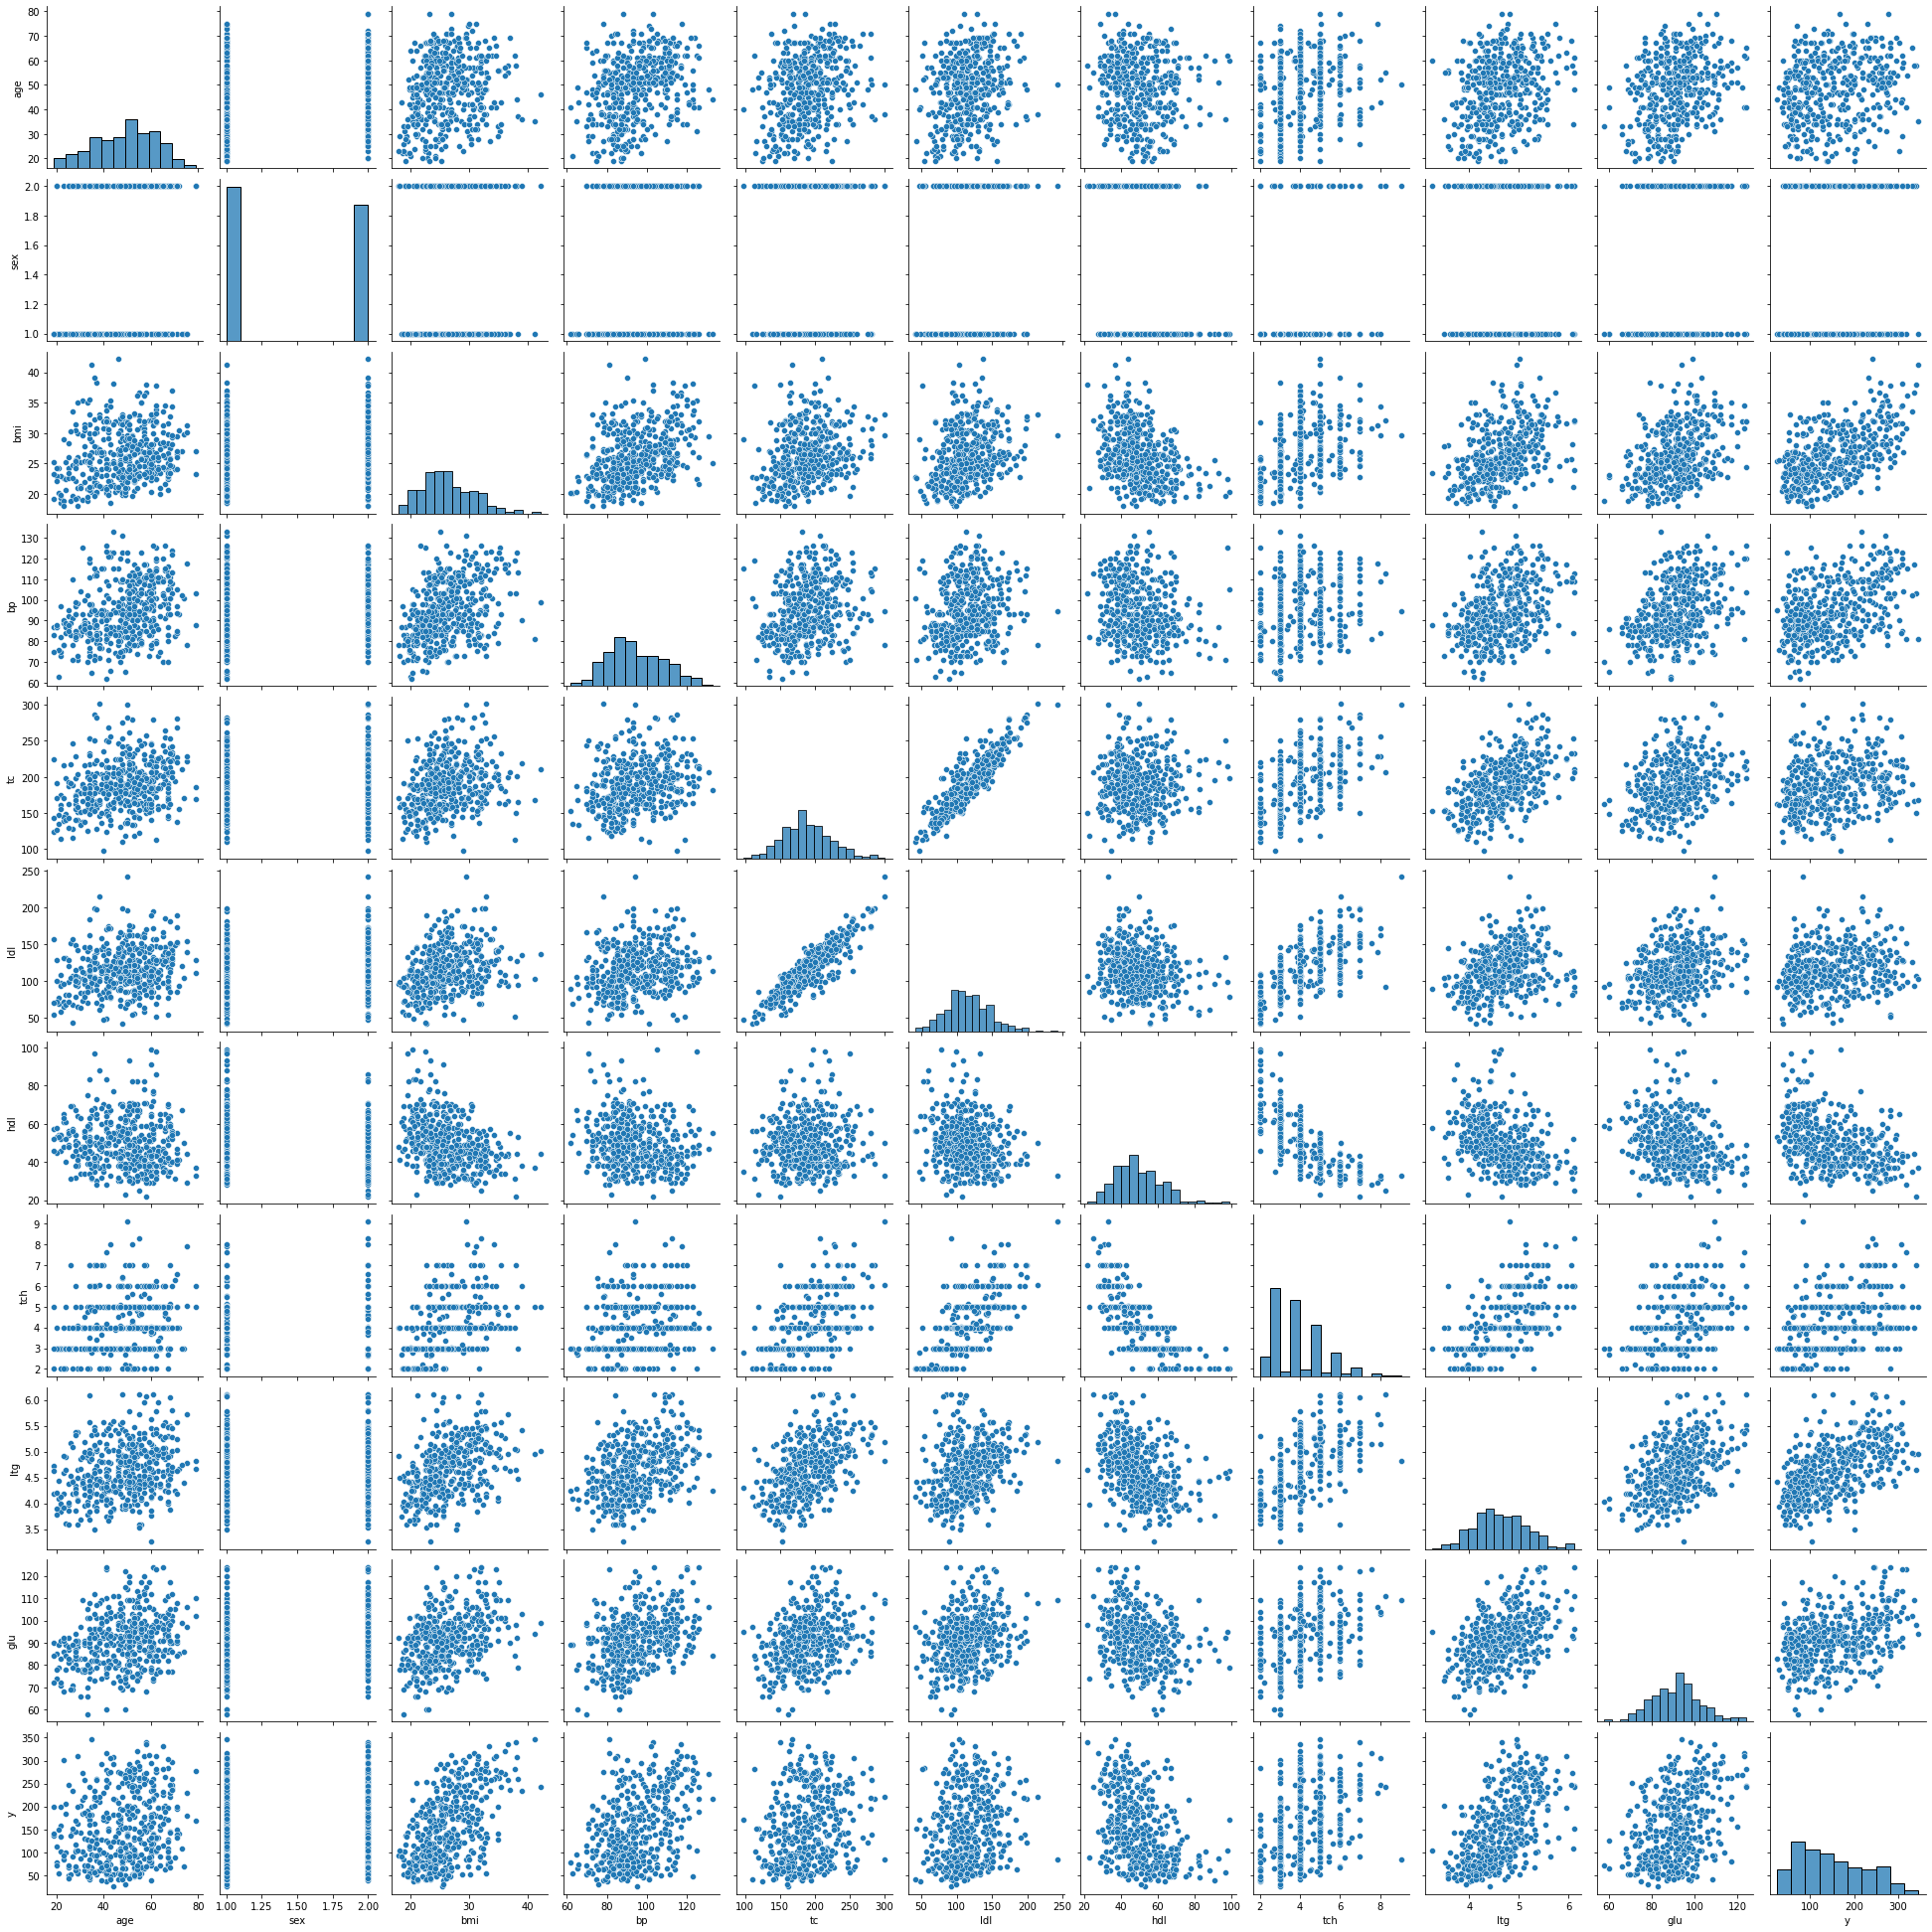
Pairplot of the dataset
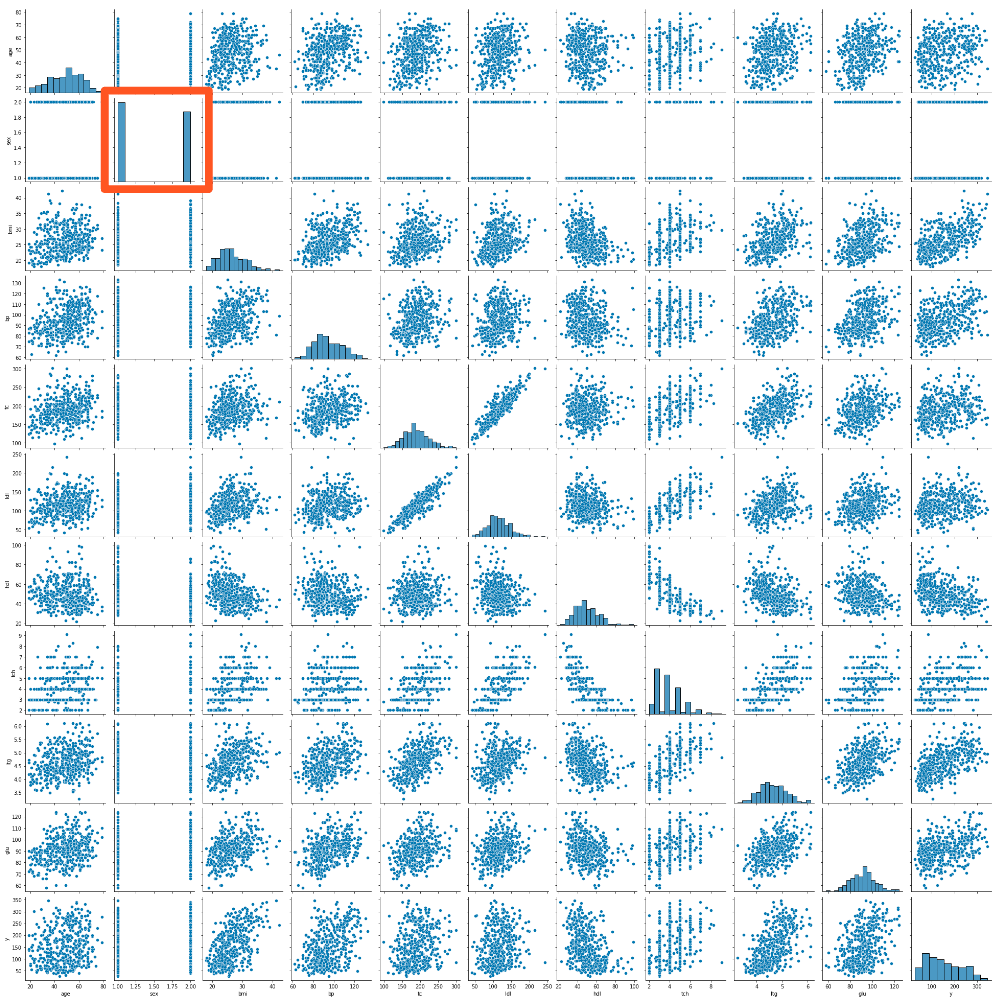
Pairplot of the dataset
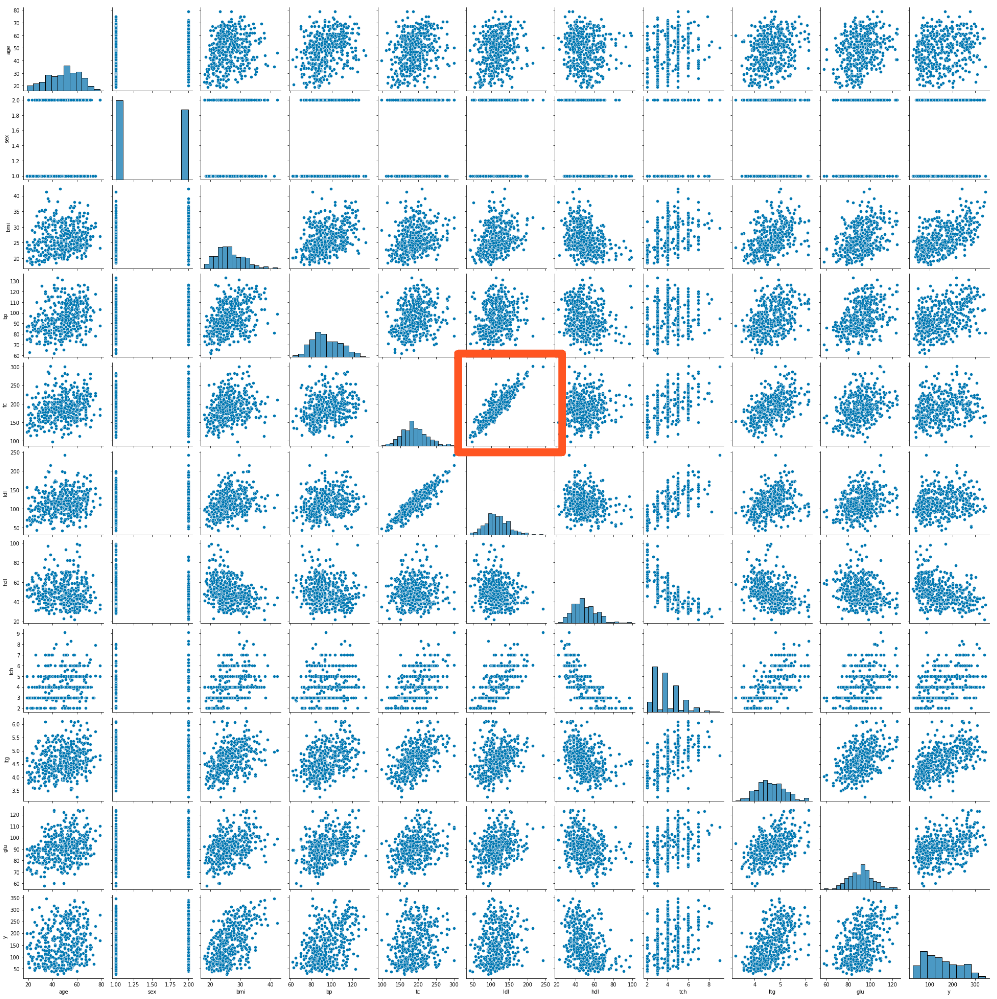
Pairplot of the dataset
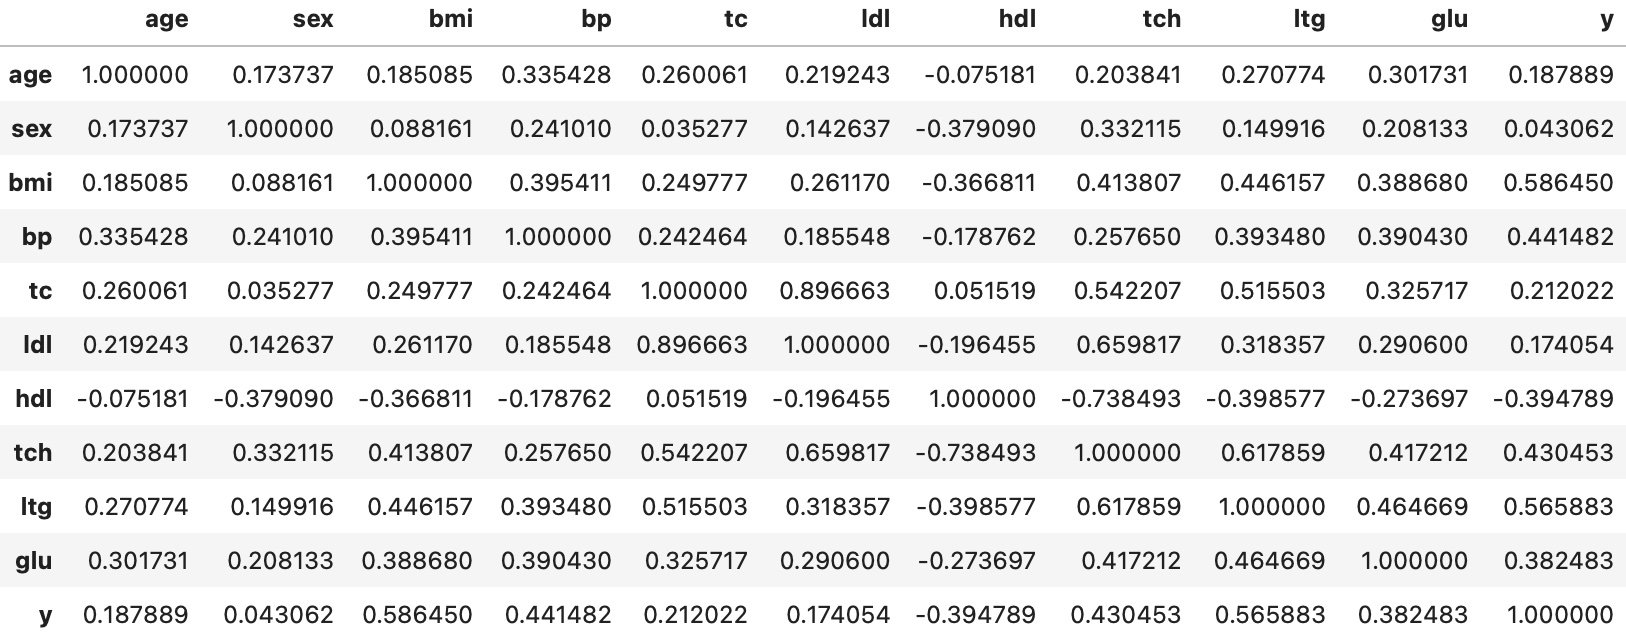
Correlations between different variables
dia.corr()
Monte Carlo Simulations in Python
Izzy Weber
Curriculum Manager, DataCamp
dia.corr()

