Récapitulatif du sauvetage
Introduction à la Data Science en Python

Hillary Green-Lerman
Lead Data Scientist, Looker
Vous l'avez fait !

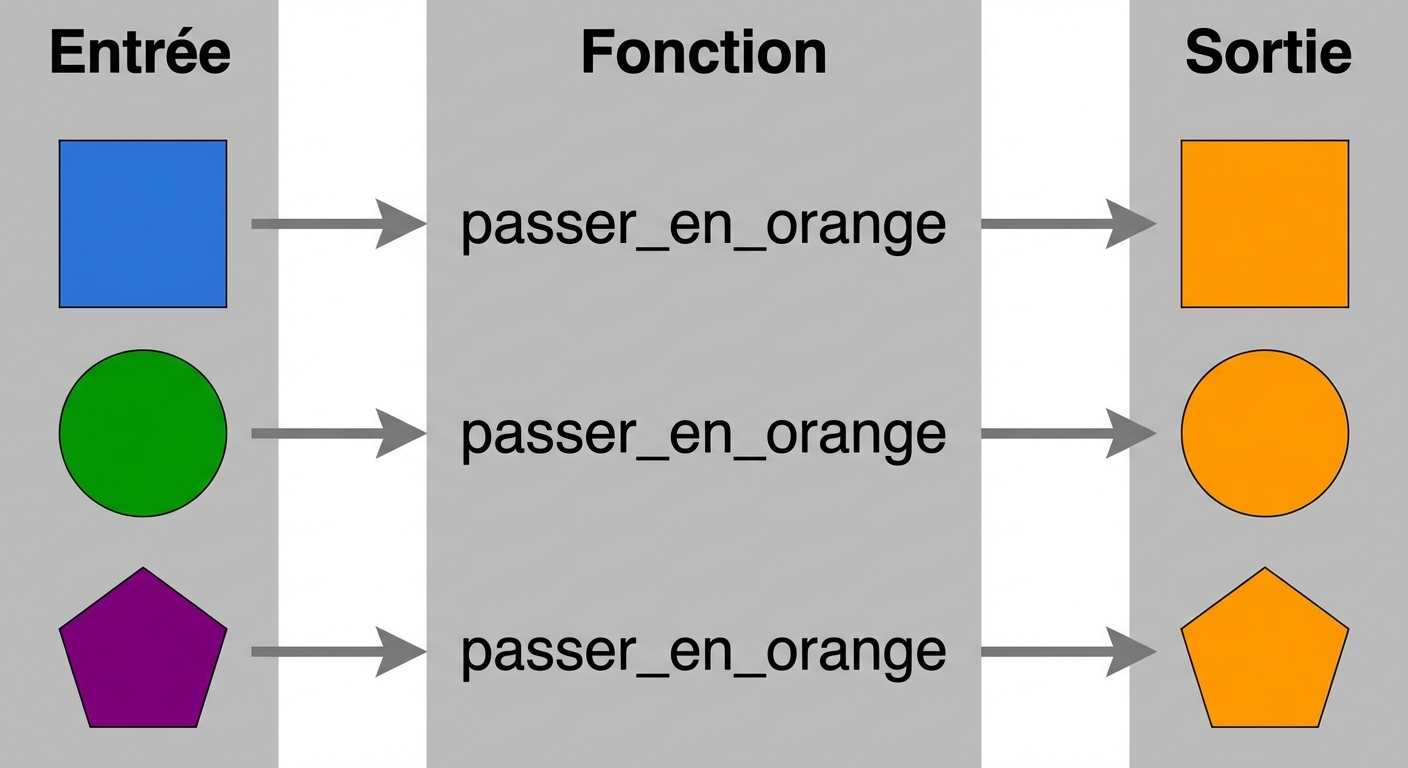
Utiliser des fonctions
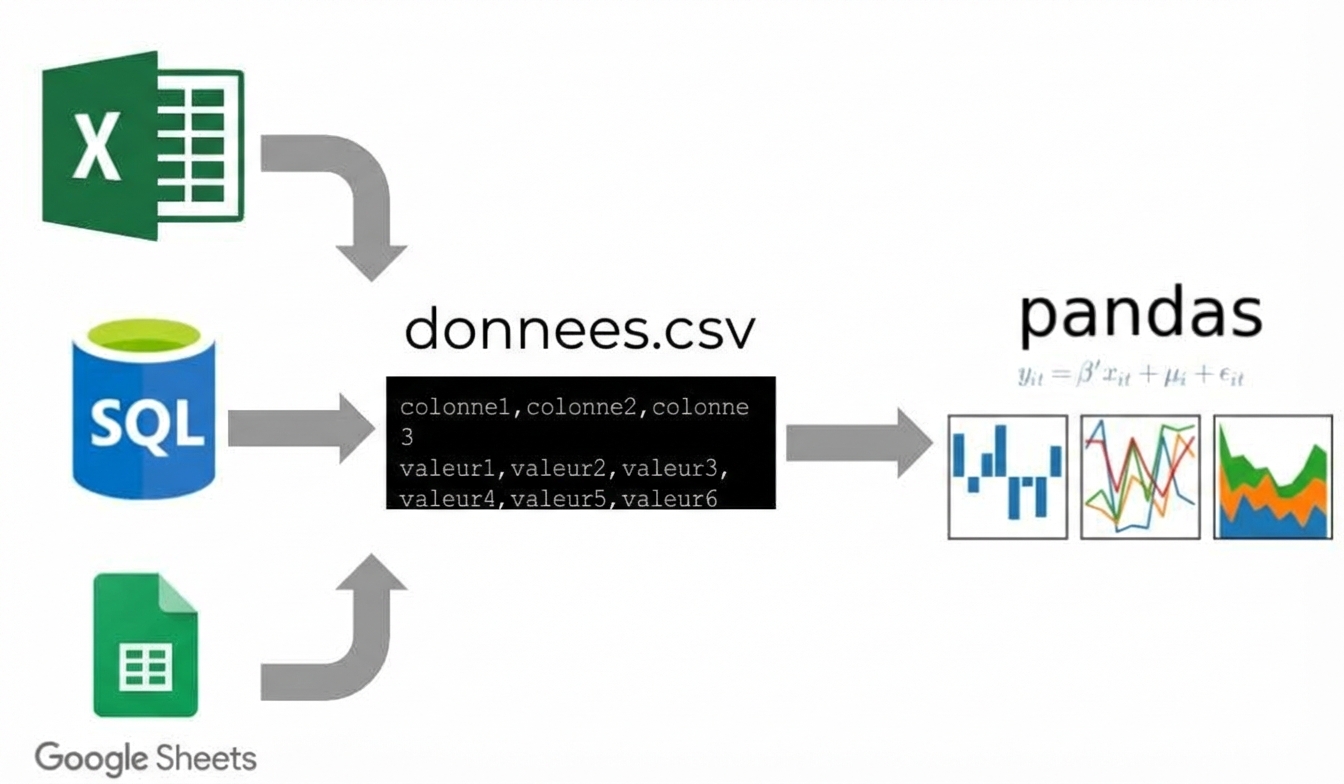
Travailler avec des données tabulaires
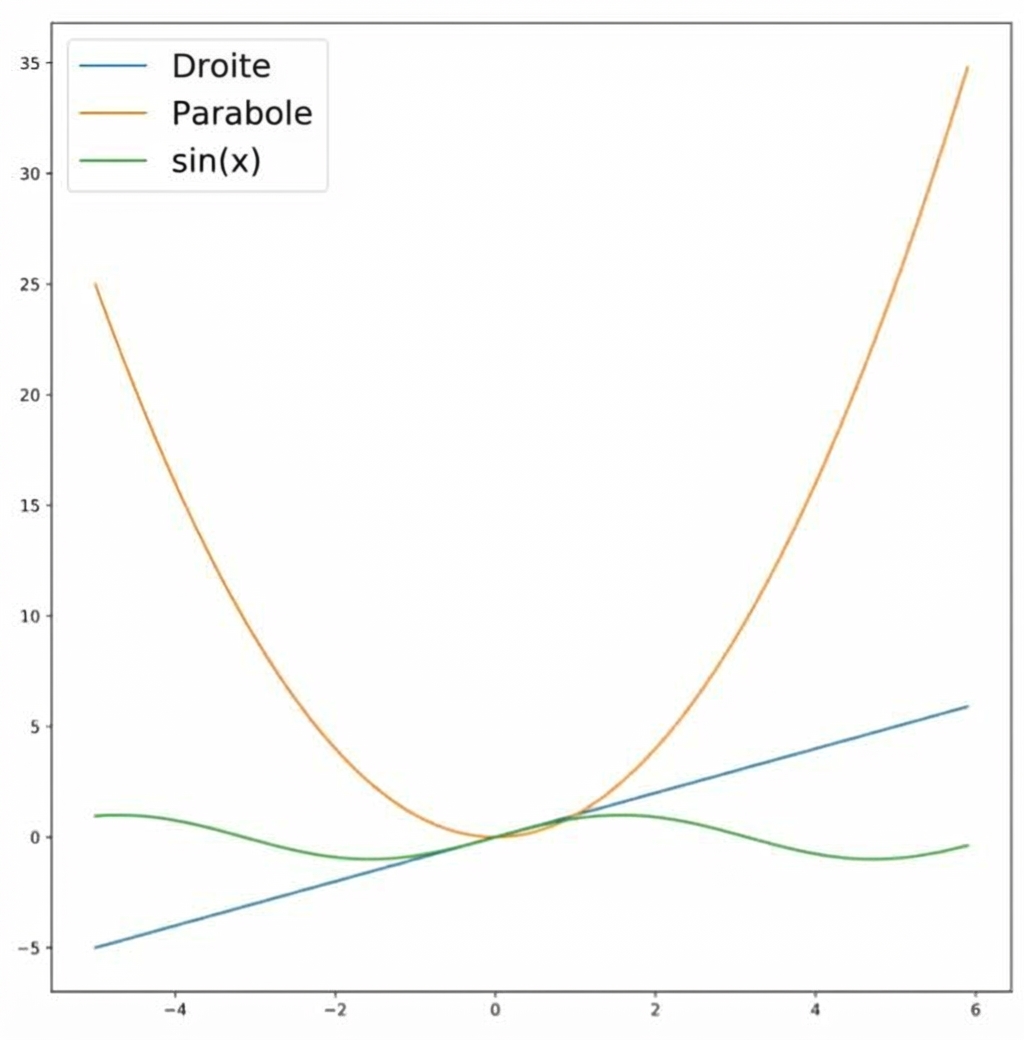
Créer des graphiques linéaires
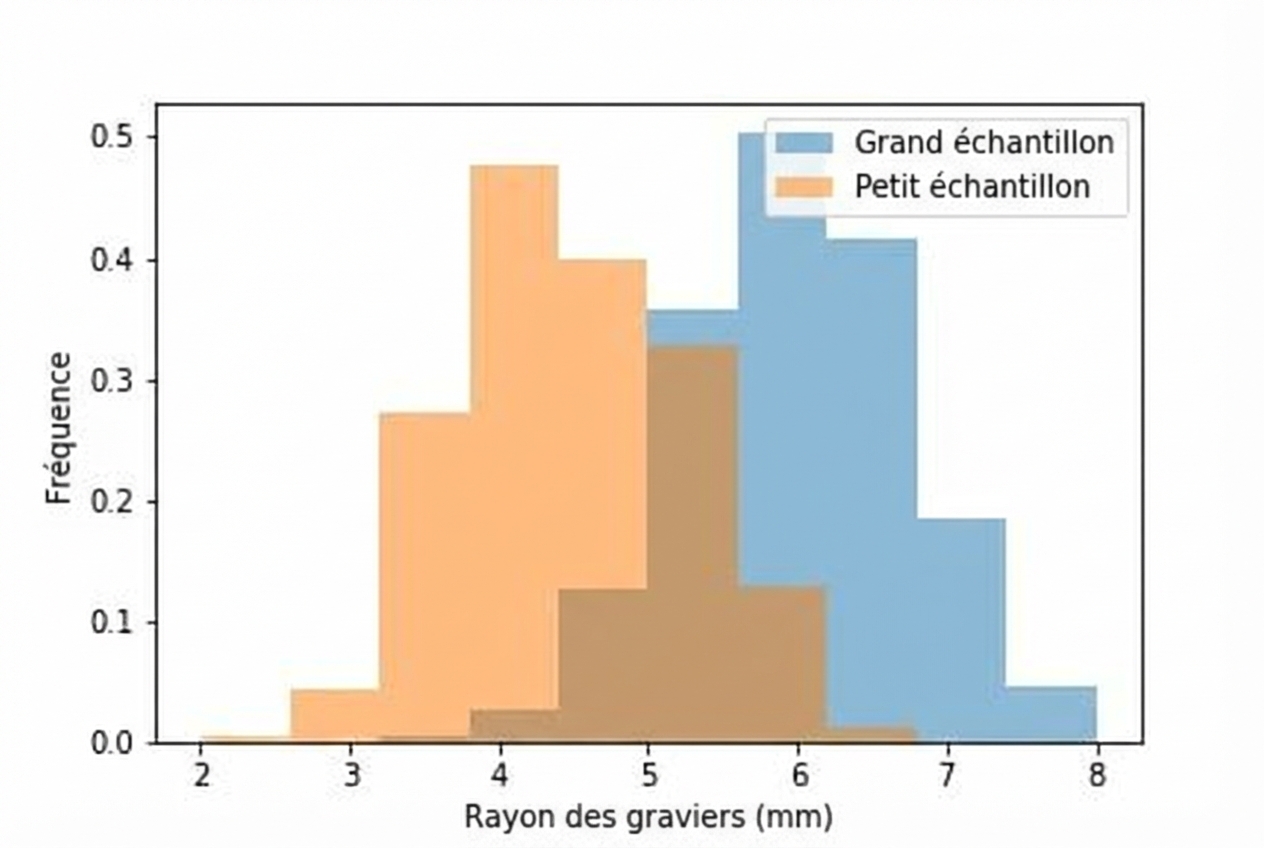
Autres types de graphiques