Création d'un histogramme
Introduction à la Data Science en Python

Hillary Green-Lerman
Lead Data Scientist, Looker
Recherche du ravisseur

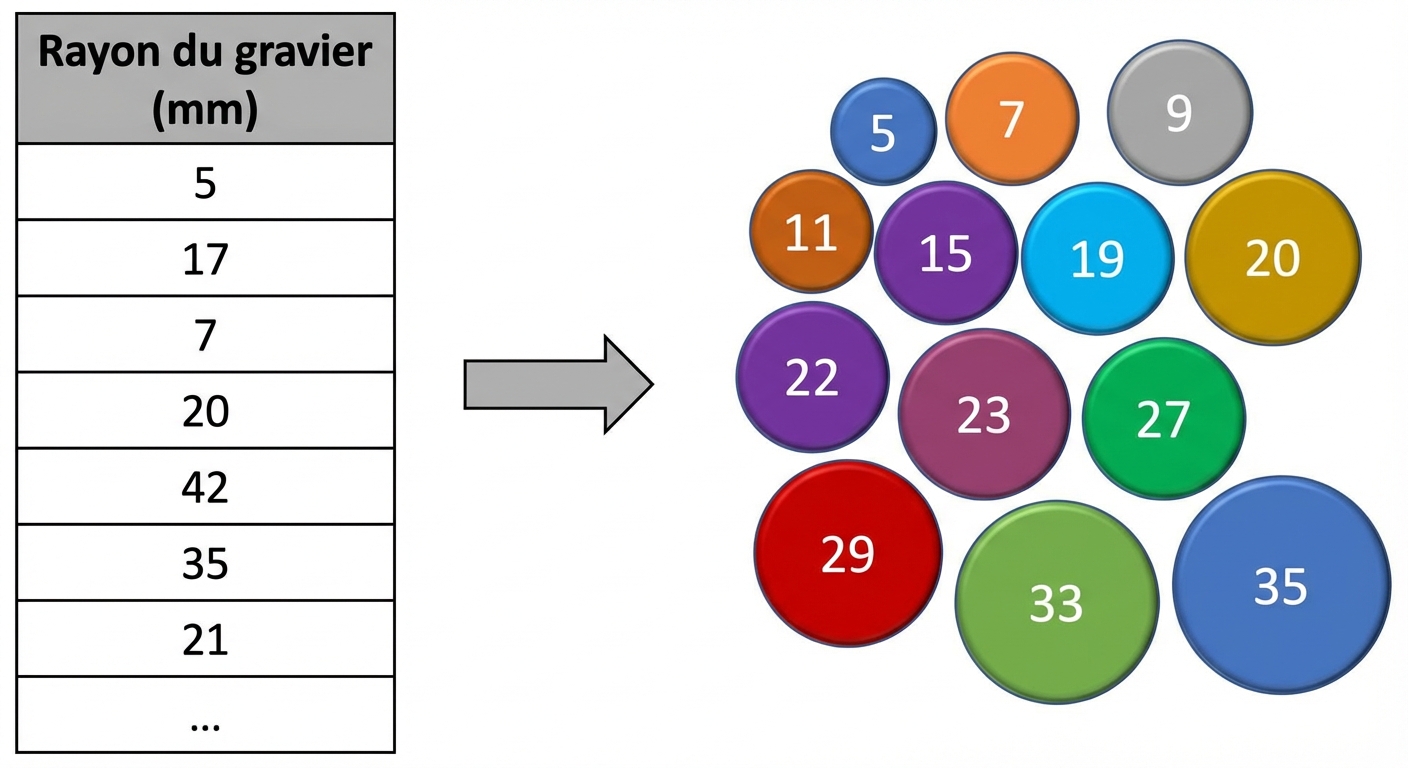
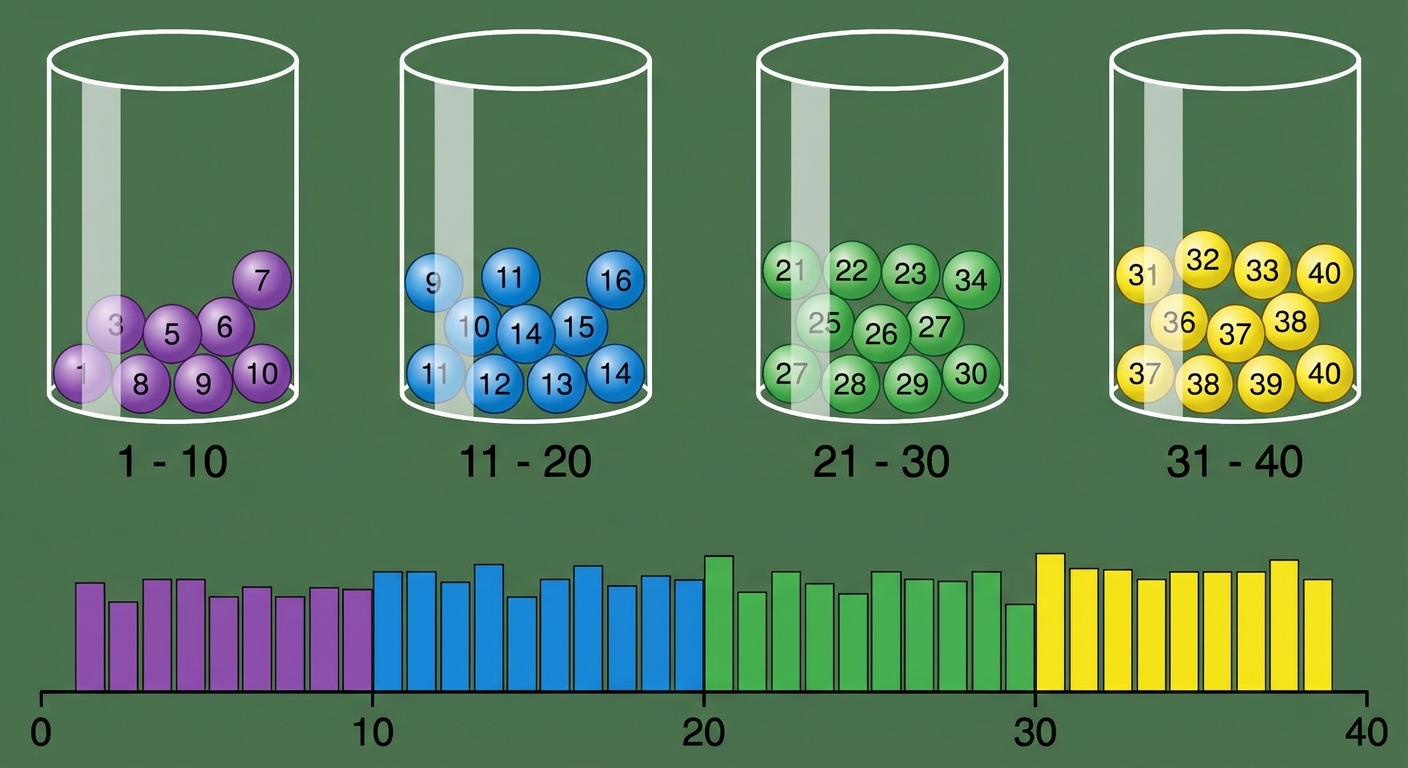
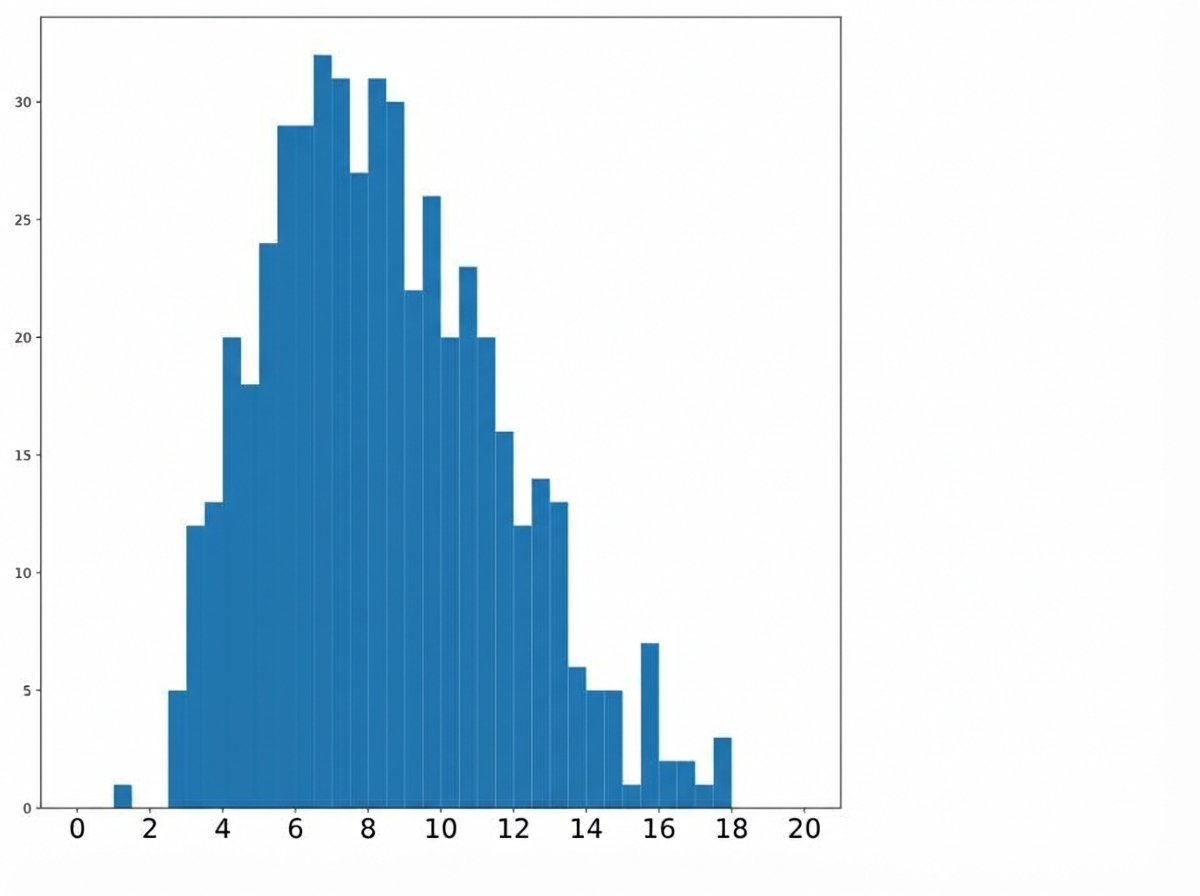
Qu'est-ce qu'un histogramme ?
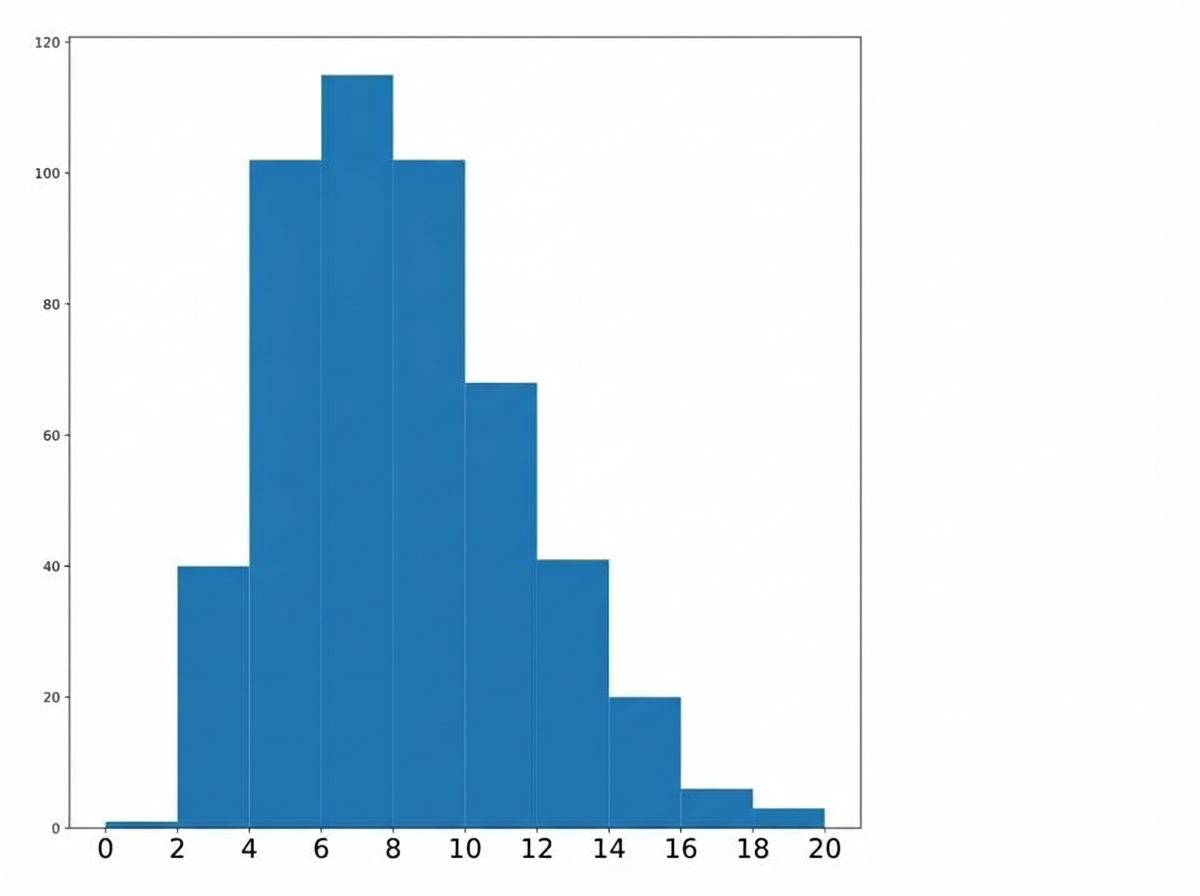
Histogrammes avec matplotlib
Changement des catégories
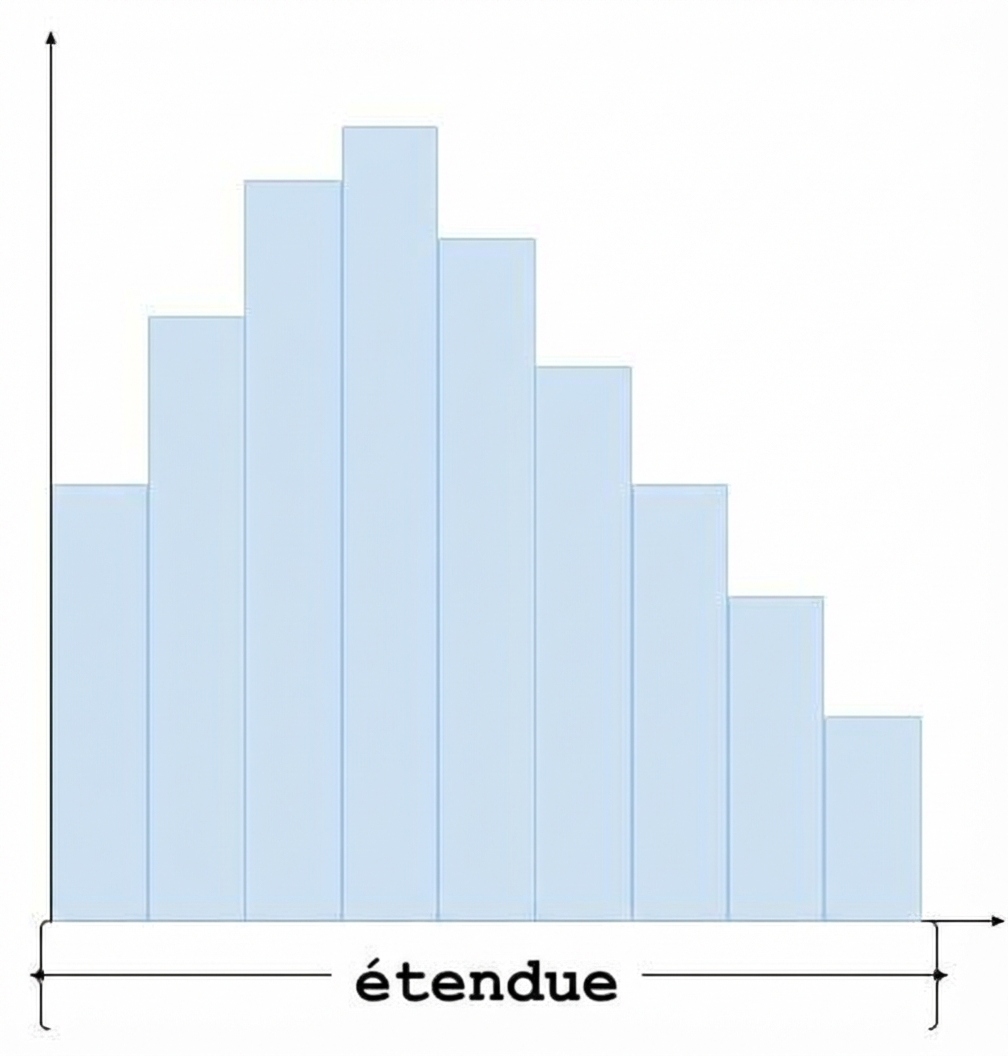
Changement de plage
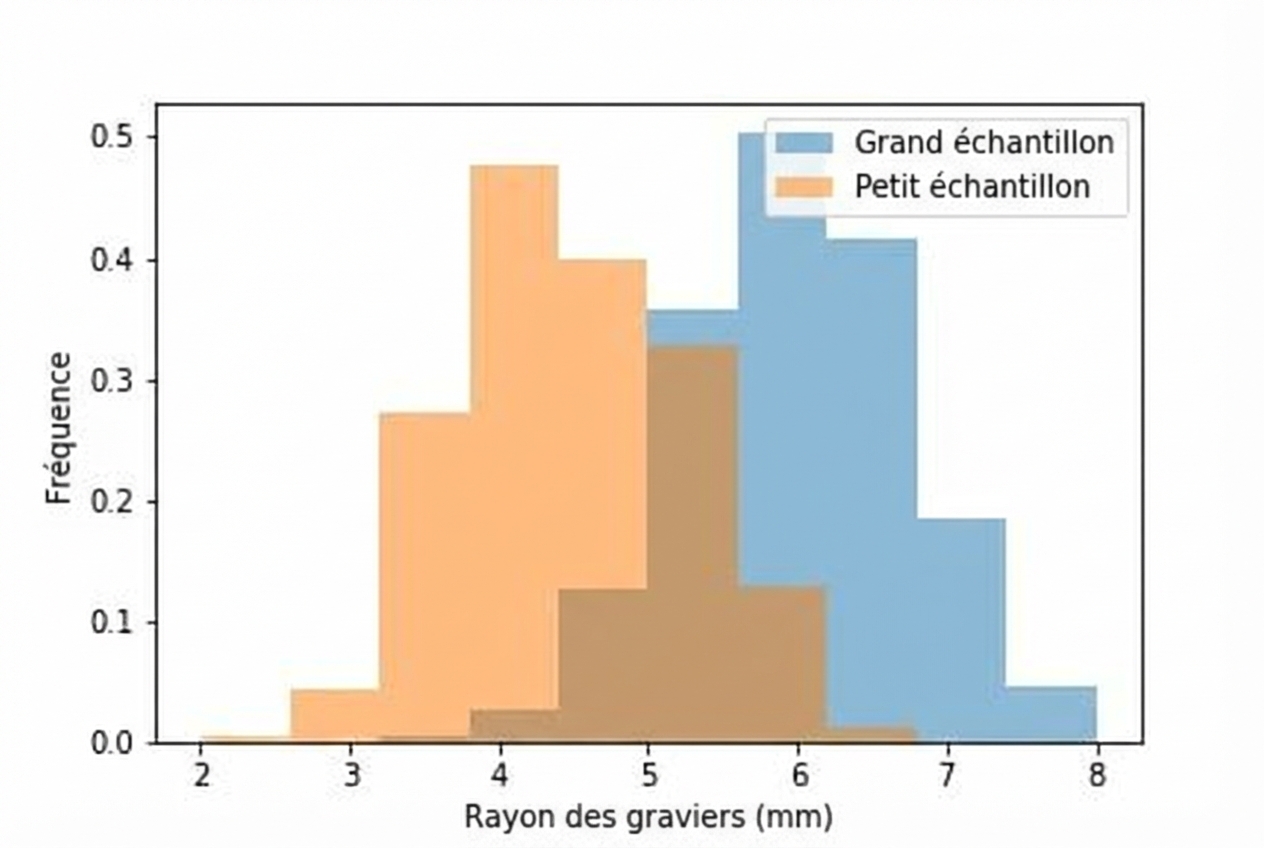
Normalisation
Graphique à barres non normalisé
plt.hist(male_weight)
plt.hist(female_weight)
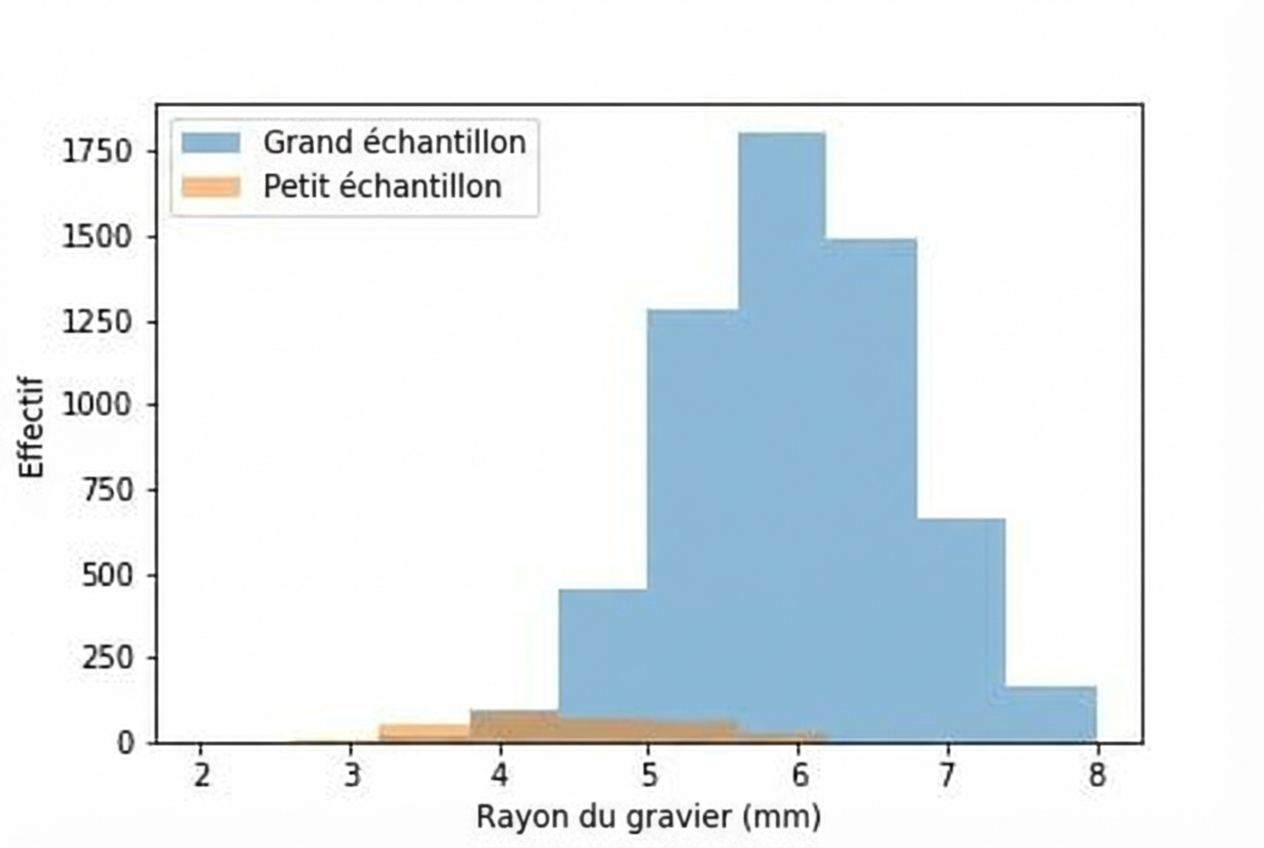
Somme de l'aire des barres = 1
plt.hist(male_weight, density=True)
plt.hist(female_weight, density=True)