Échantillonnage de convenance
L’échantillonnage en Python

James Chapman
Curriculum Manager, DataCamp
La prédiction électorale du Literary Digest
- Prévision : Landon 57 % ; Roosevelt 43 %
- Résultats réels : Landon 38 % ; Roosevelt 62 %
- Échantillon non représentatif de la population, entraînant un biais d’échantillonnage
- Collecter des données par la méthode la plus simple s’appelle l’échantillonnage de convenance
Trouver l’âge moyen des Français

1 Image par Sean MacEntee
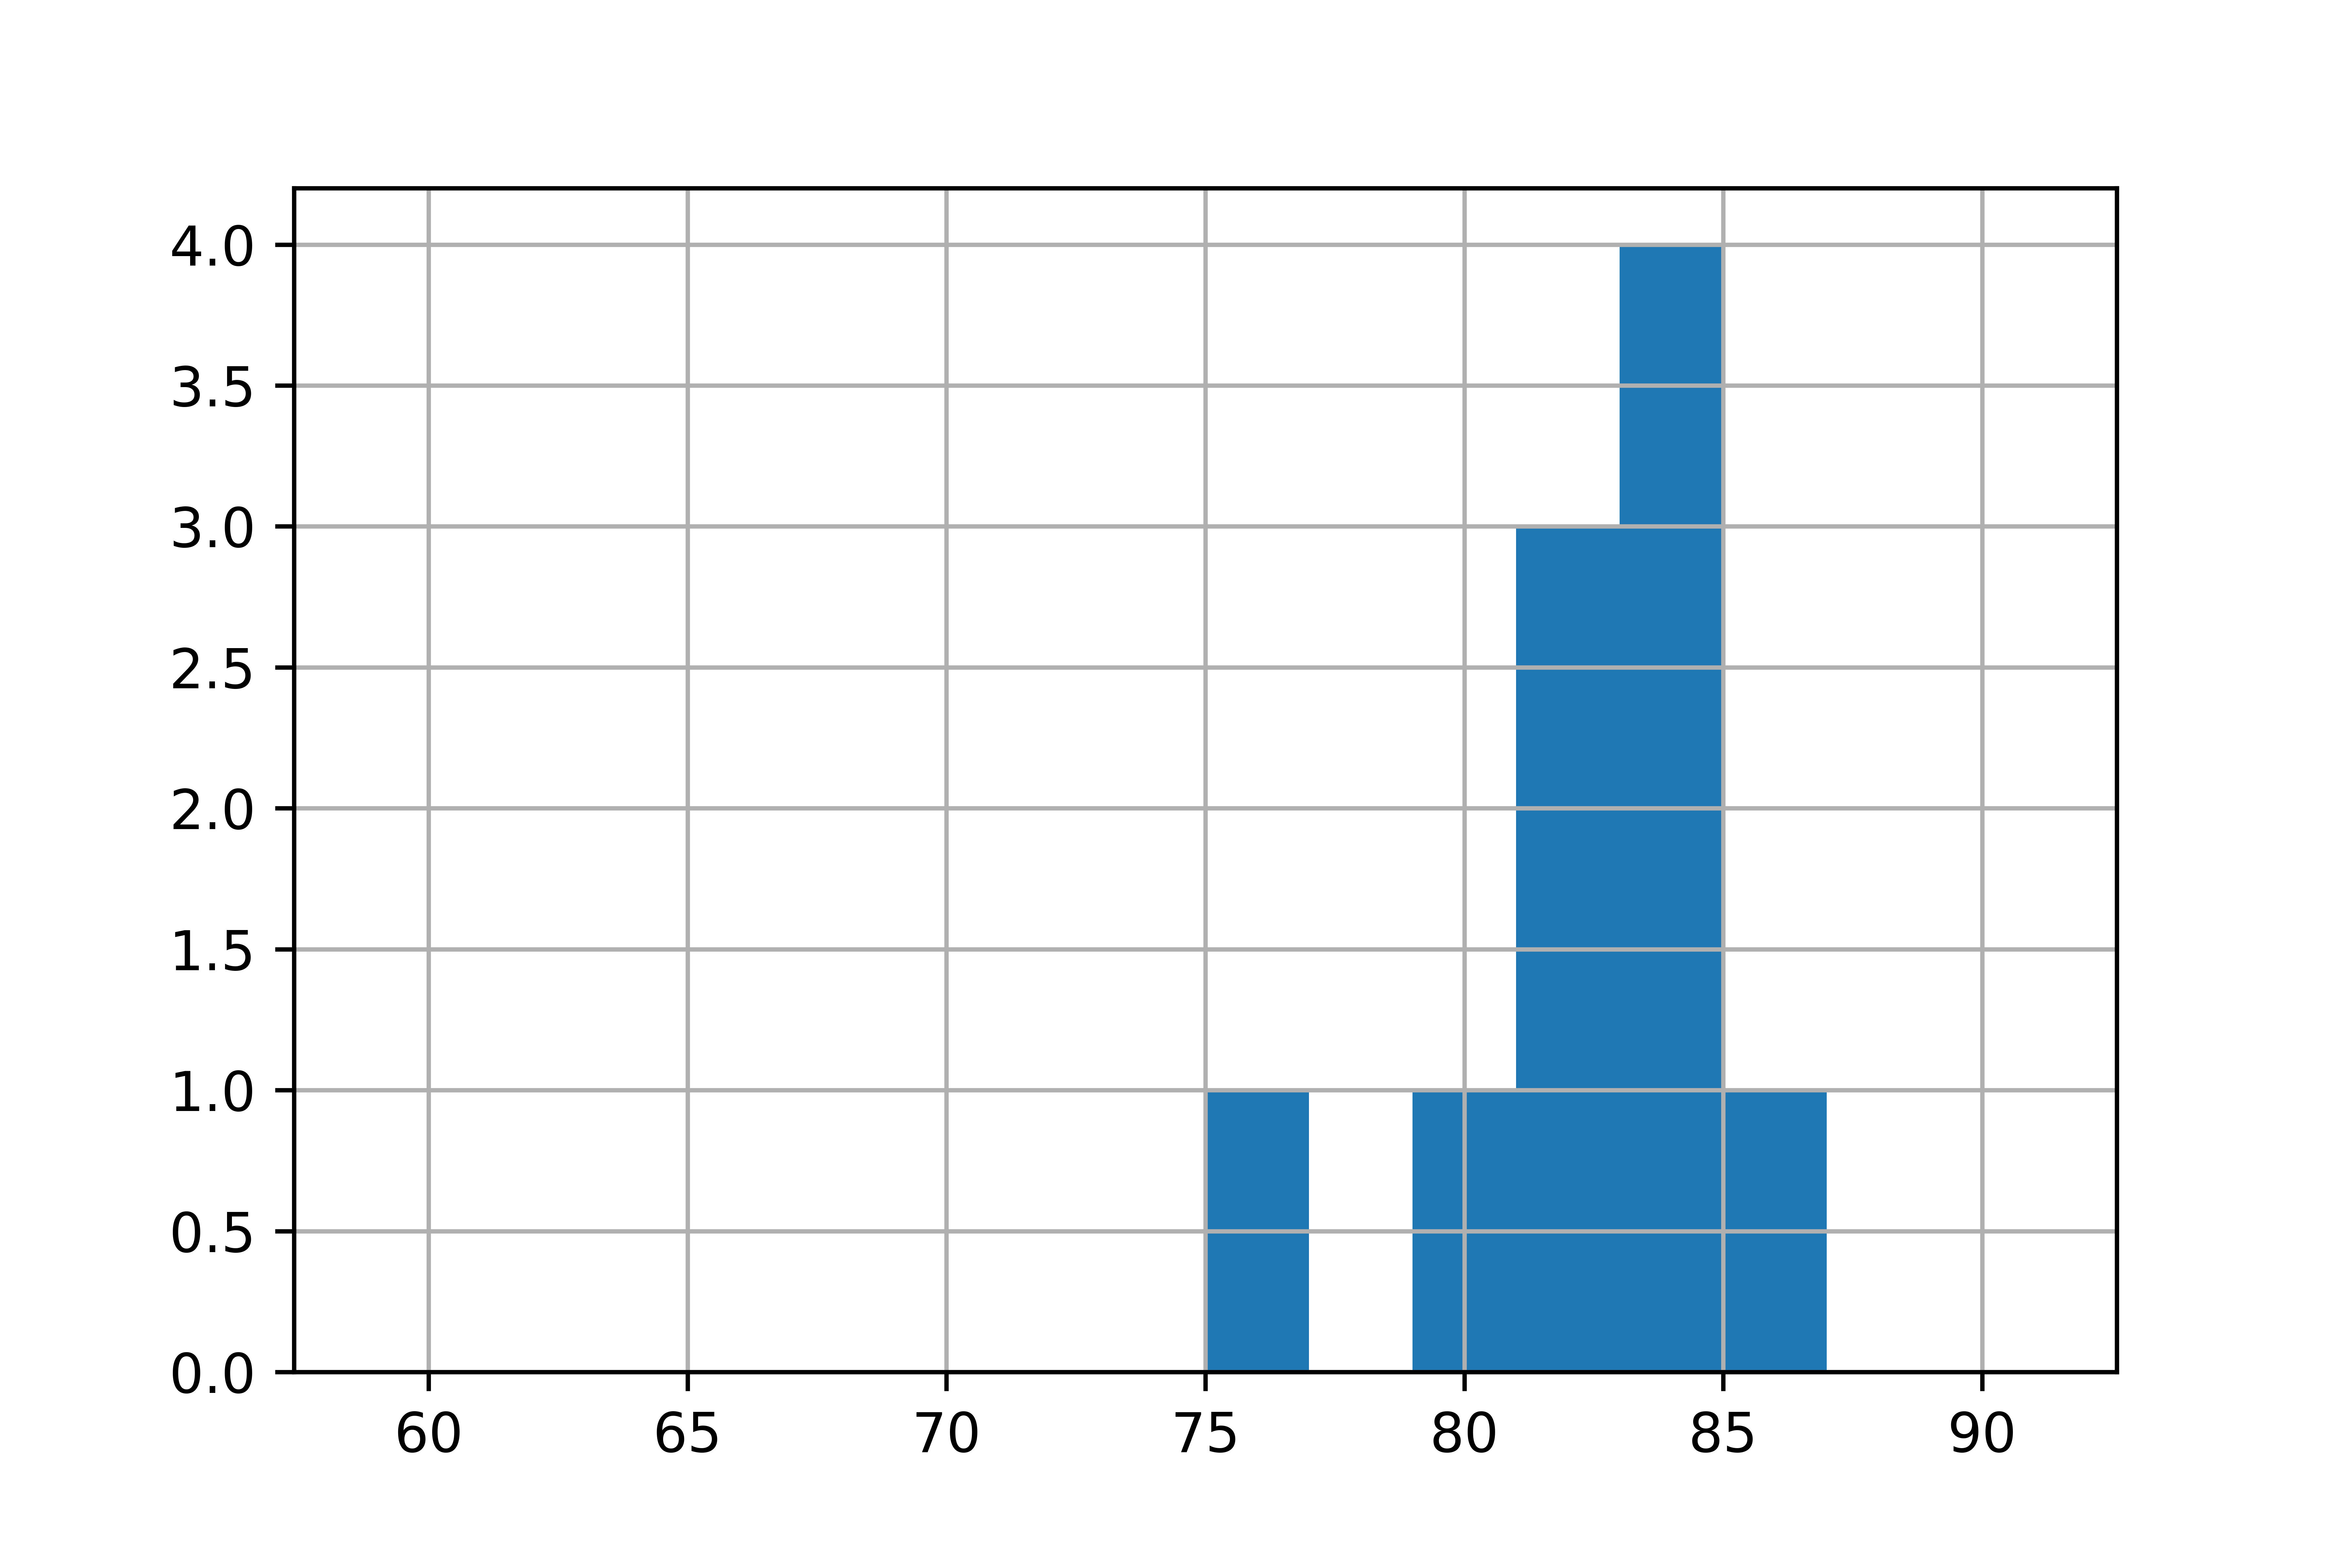
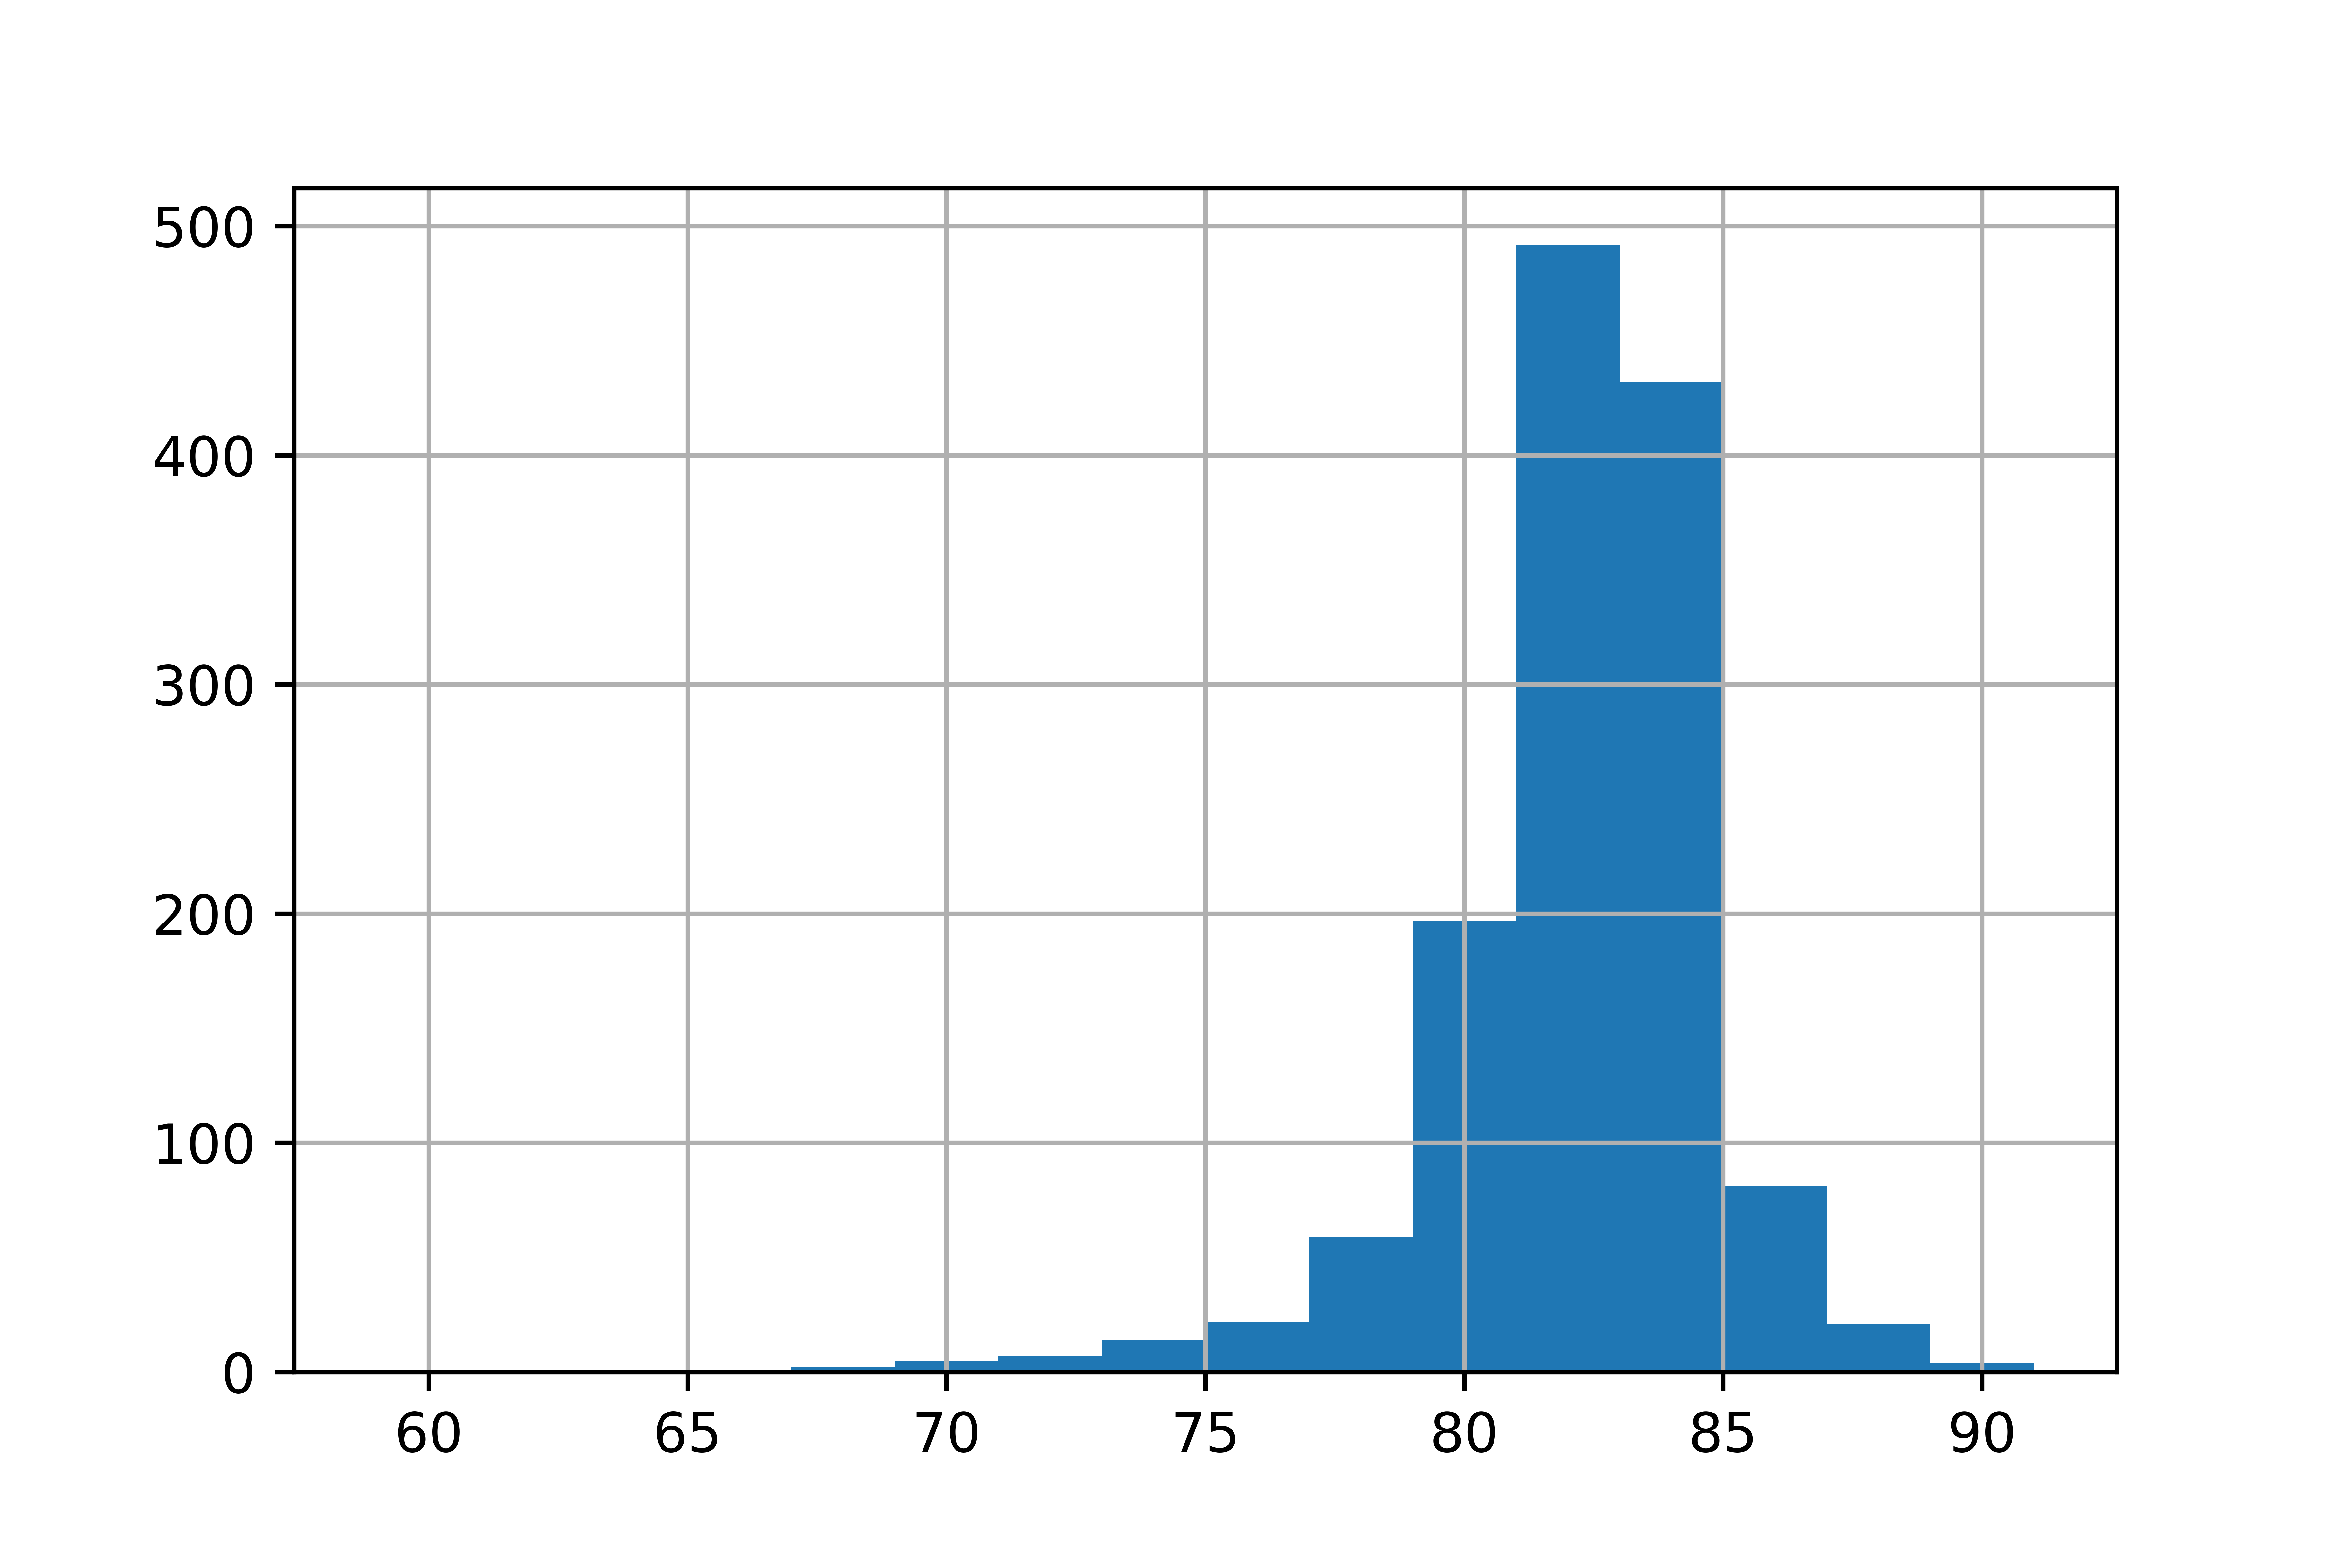
Distribution d’une population et d’un échantillon de convenance
Population :
Échantillon de convenance :
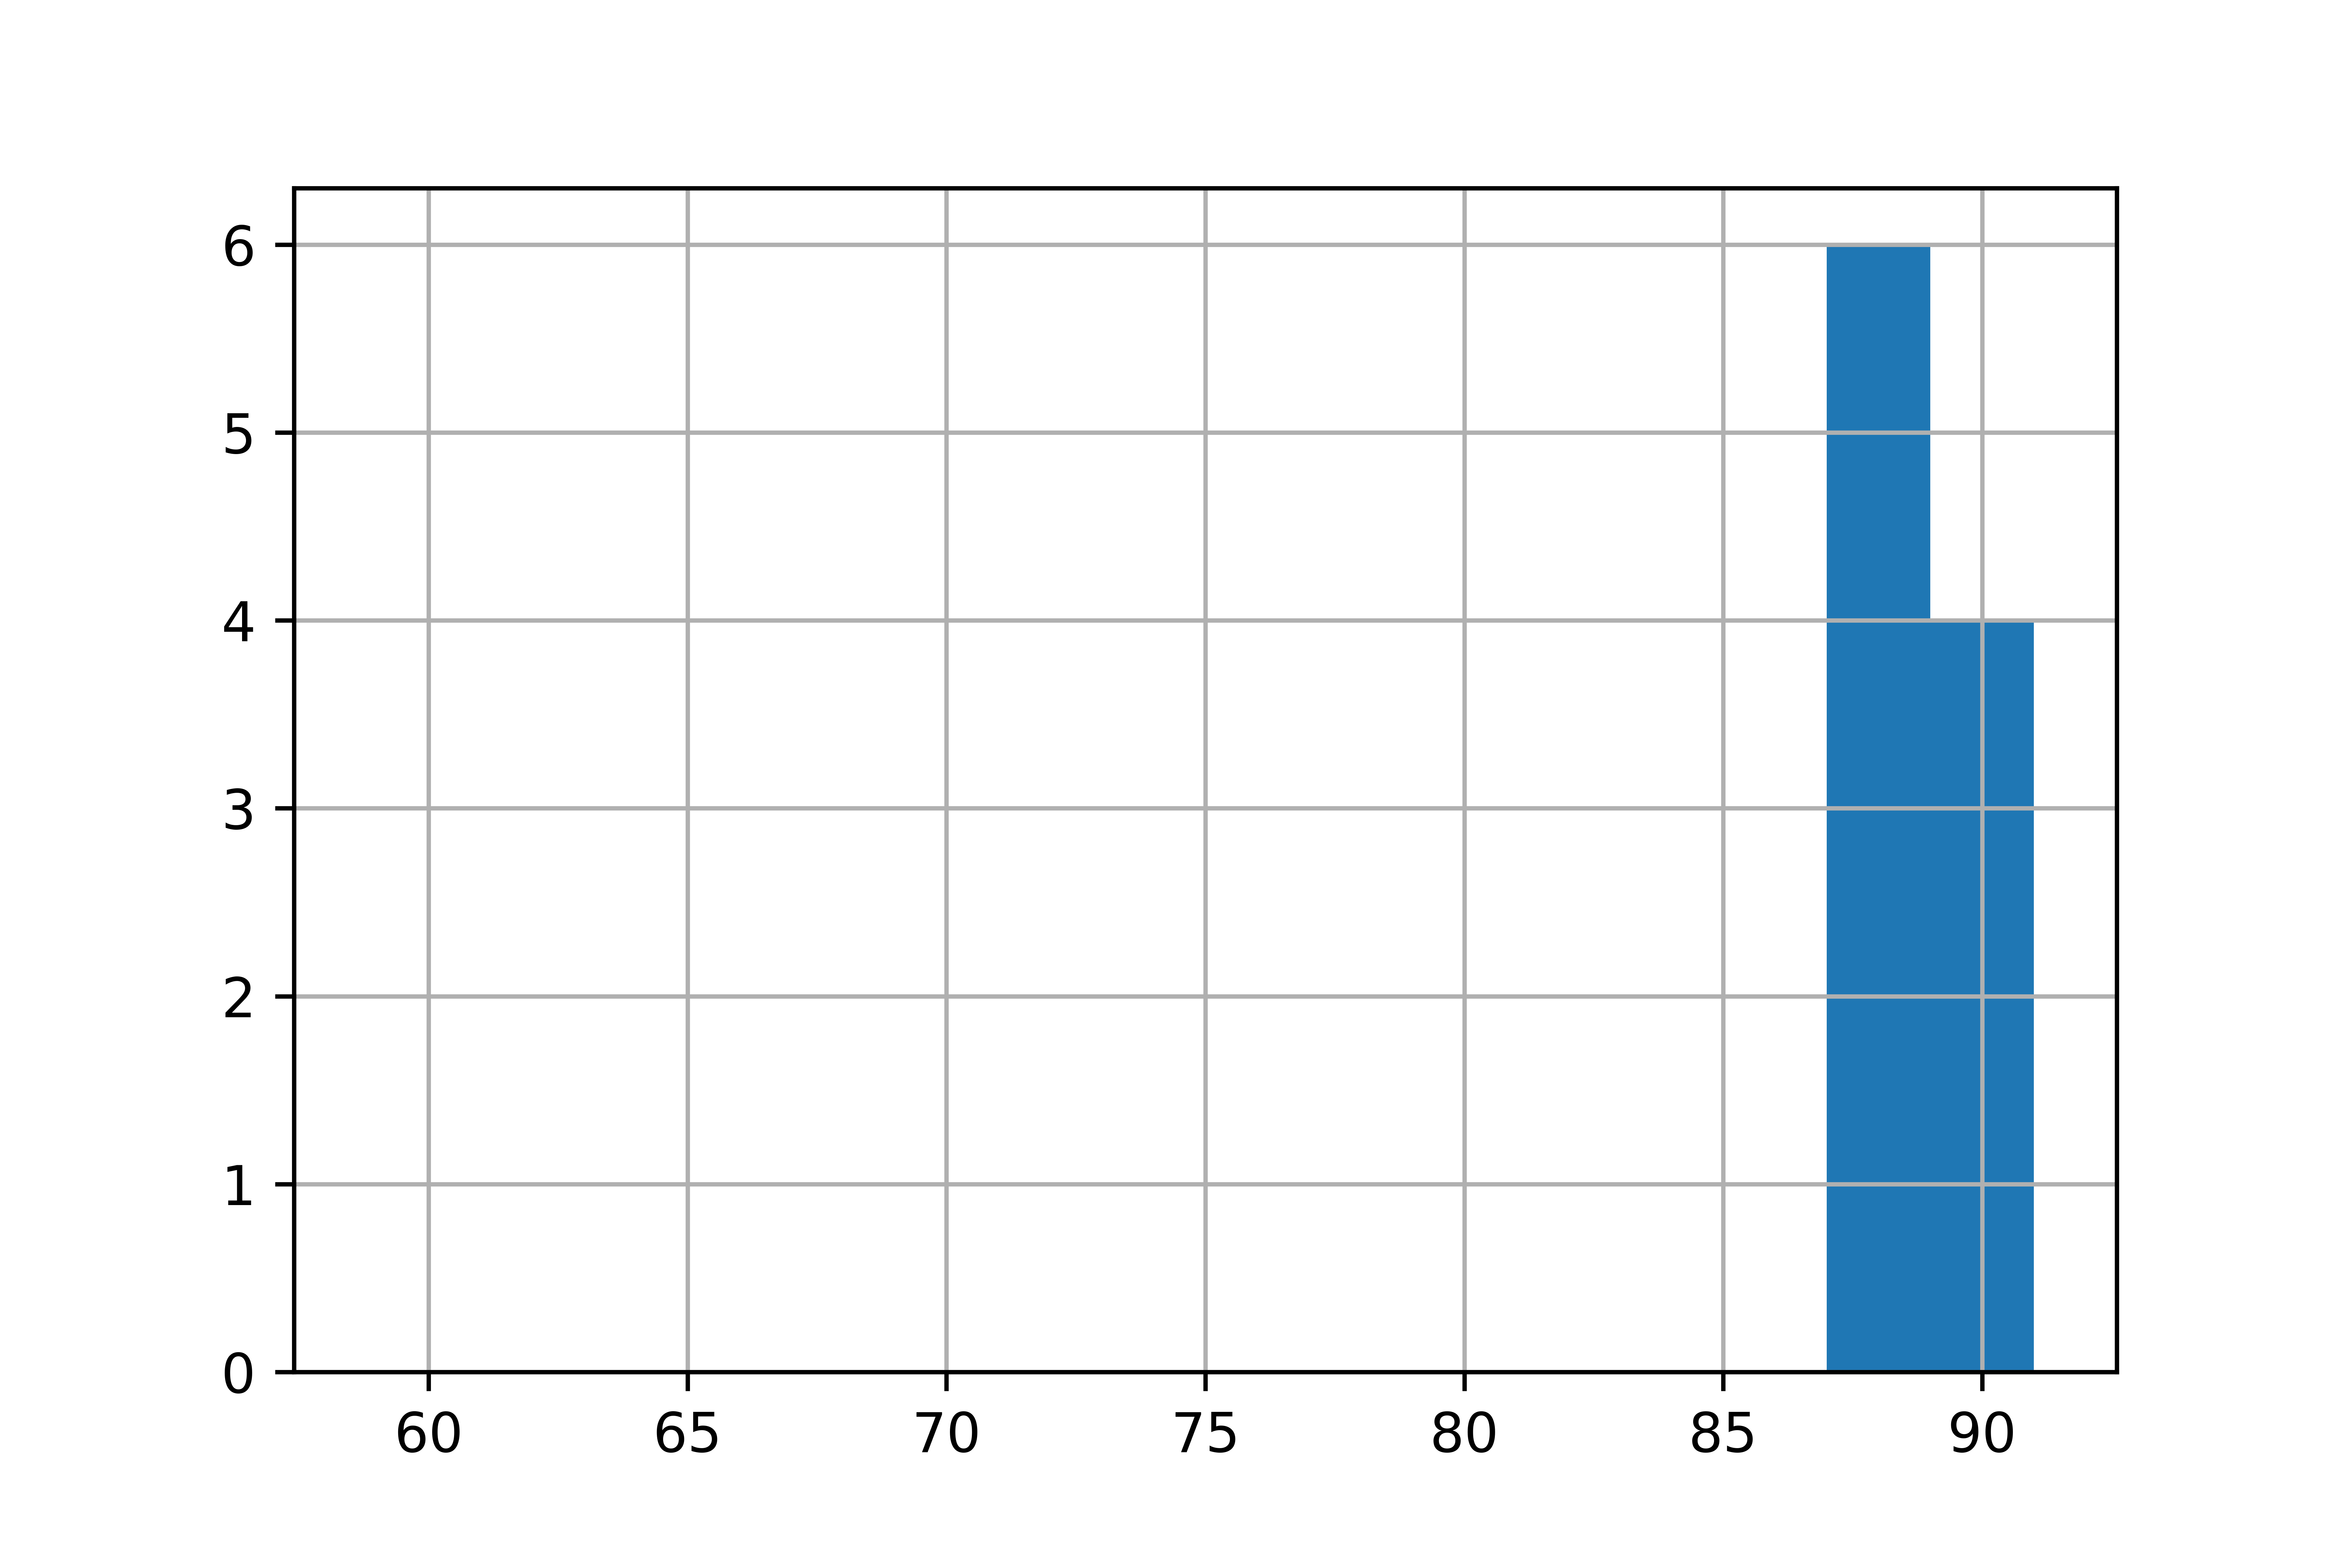
Distribution d’une population et d’un échantillon aléatoire simple
Population :
Échantillon aléatoire :