Créer une distribution d’échantillonnage

L’échantillonnage en Python

James Chapman

Curriculum Manager, DataCamp

Même code, réponse différente

coffee_ratings.sample(n=30)['total_cup_points'].mean()
82.53066666666668
coffee_ratings.sample(n=30)['total_cup_points'].mean()
81.97566666666667
coffee_ratings.sample(n=30)['total_cup_points'].mean()
82.68
coffee_ratings.sample(n=30)['total_cup_points'].mean()
81.675
L’échantillonnage en Python

Même code, 1000 fois

mean_cup_points_1000 = []

for i in range(1000): mean_cup_points_1000.append( coffee_ratings.sample(n=30)['total_cup_points'].mean() )
print(mean_cup_points_1000)
[82.11933333333333, 82.55300000000001, 82.07266666666668, 81.76966666666667, 
...
 82.74166666666666, 82.45033333333335, 81.77199999999999, 82.8163333333333]
L’échantillonnage en Python

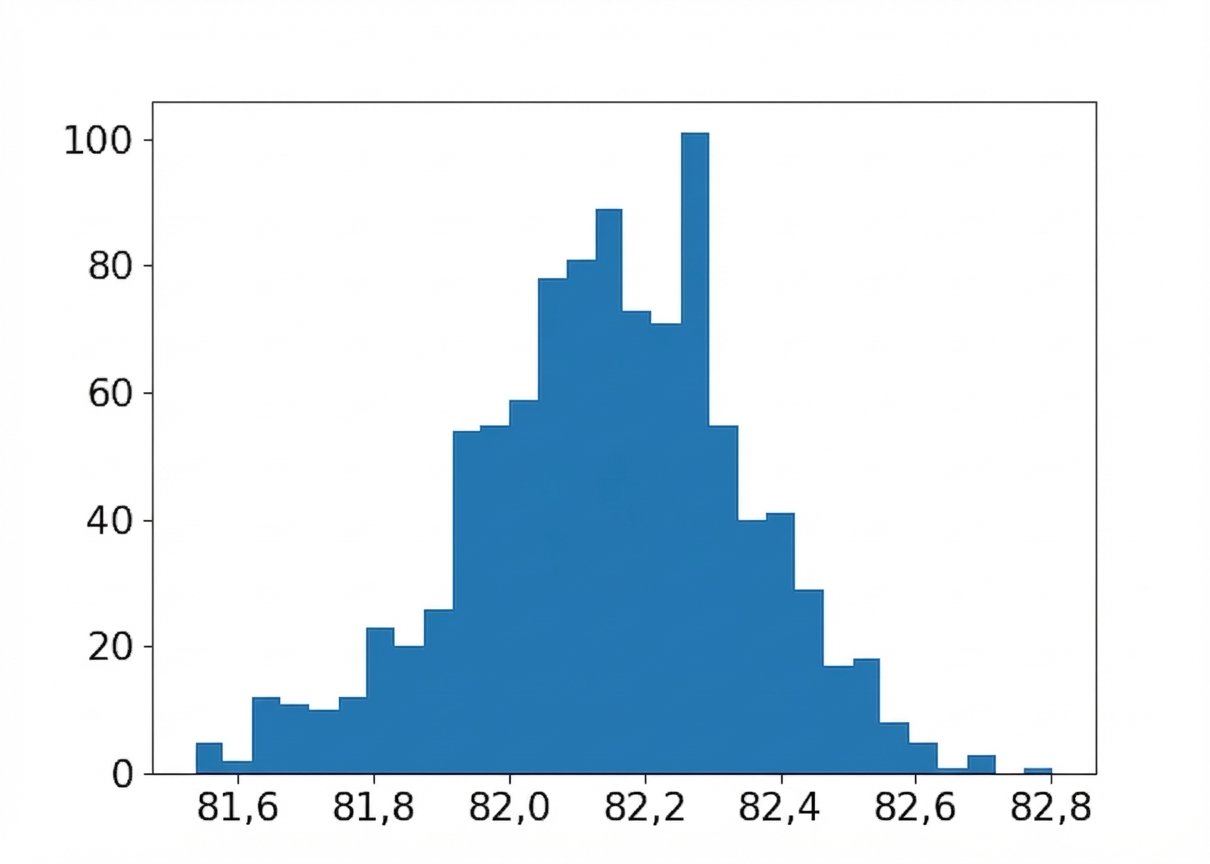
Distribution des moyennes d’échantillon (taille 30)

import matplotlib.pyplot as plt
plt.hist(mean_cup_points_1000, bins=30)
plt.show()

Une distribution d’échantillonnage est une distribution de réplicats d’estimateurs ponctuels.

Un histogramme des moyennes d’échantillon.

L’échantillonnage en Python

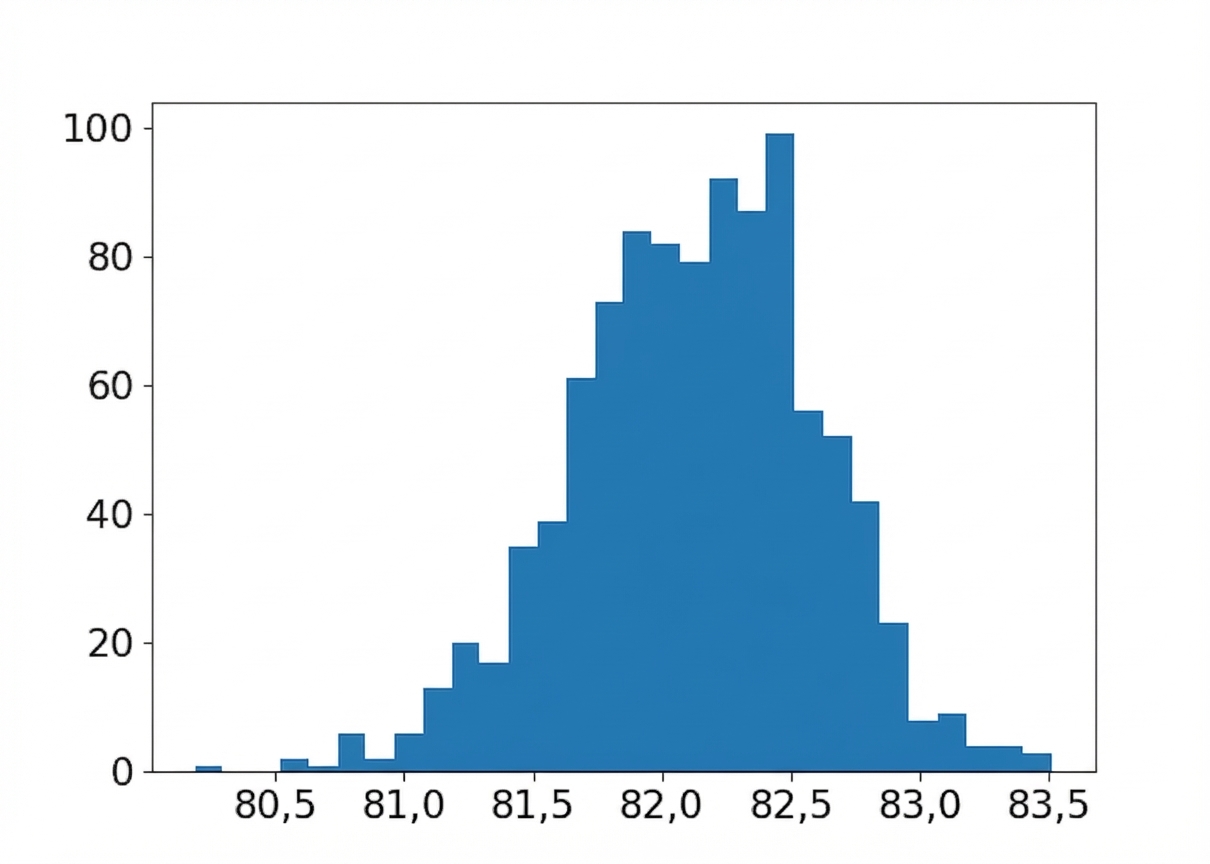
Tailles d’échantillon différentes

Taille d’échantillon : 6

Un histogramme des moyennes d’échantillon avec une taille de 6.

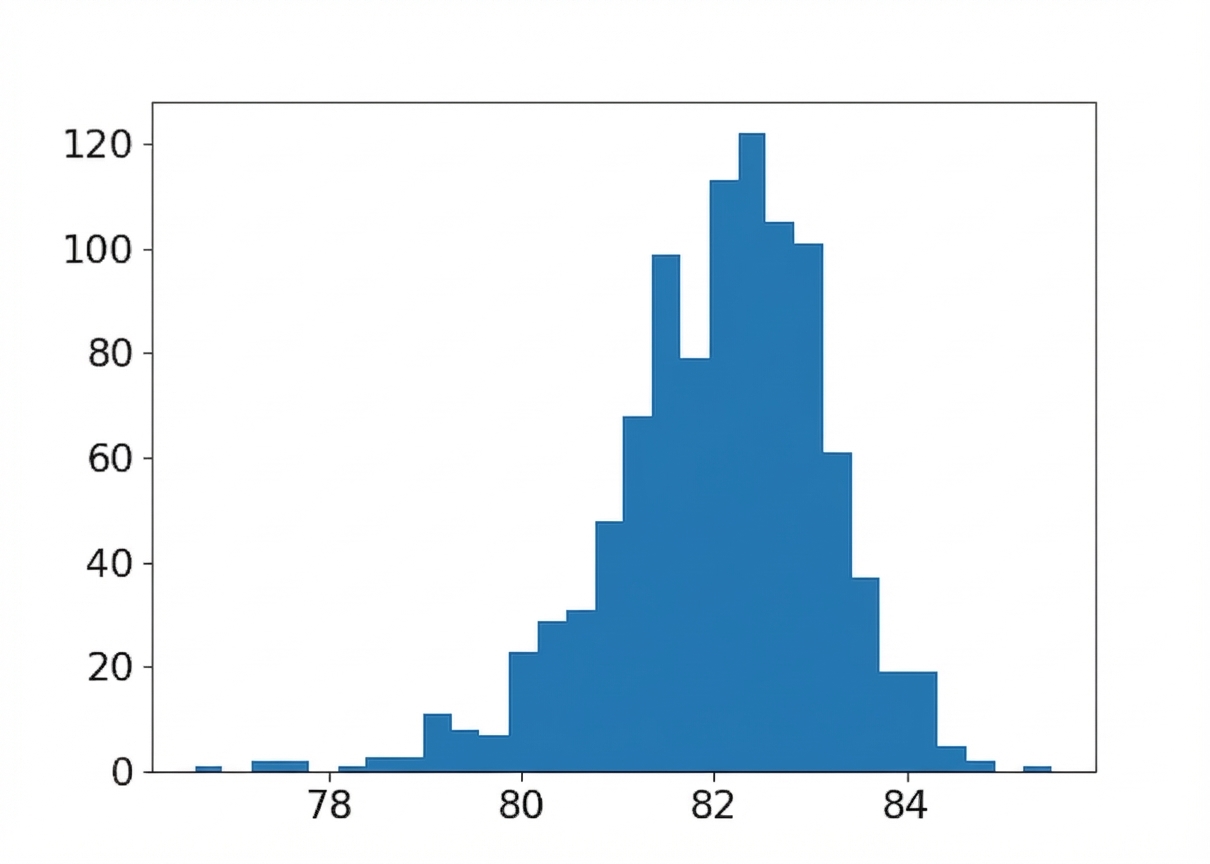
Taille d’échantillon : 150

Un histogramme des moyennes d’échantillon avec une taille de 150.

L’échantillonnage en Python

Passons à la pratique !

L’échantillonnage en Python

Preparing Video For Download...