Utilisation des attributs
Introduction à la visualisation de données avec ggplot2

Rick Scavetta
Founder, Scavetta Academy
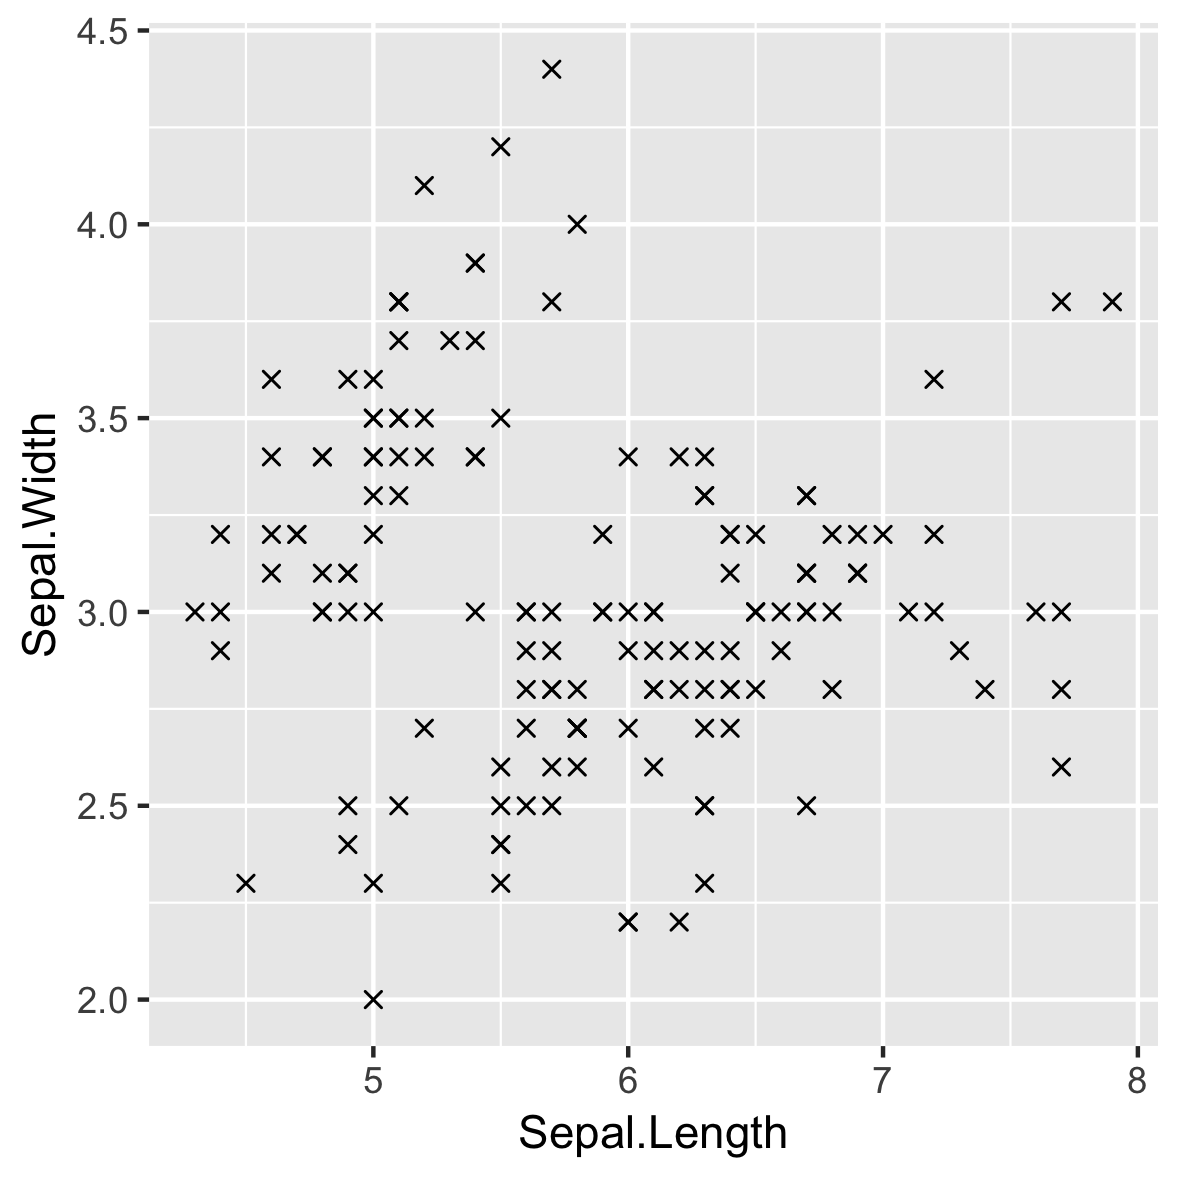
Attributs esthétiques ? Attributs !
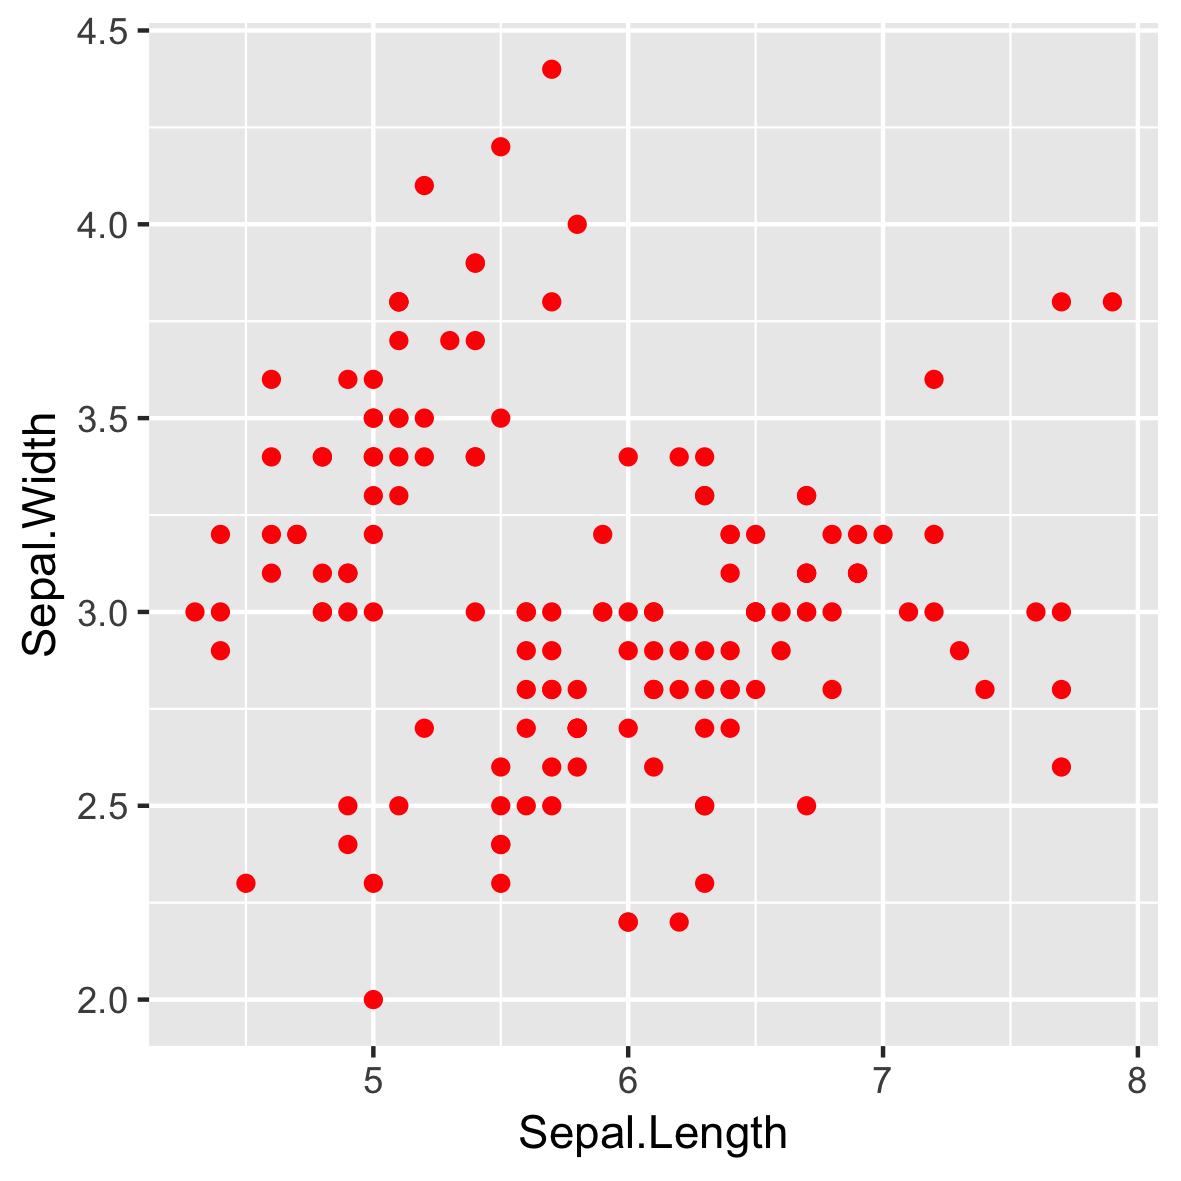
Attributs esthétiques ? Attributs !
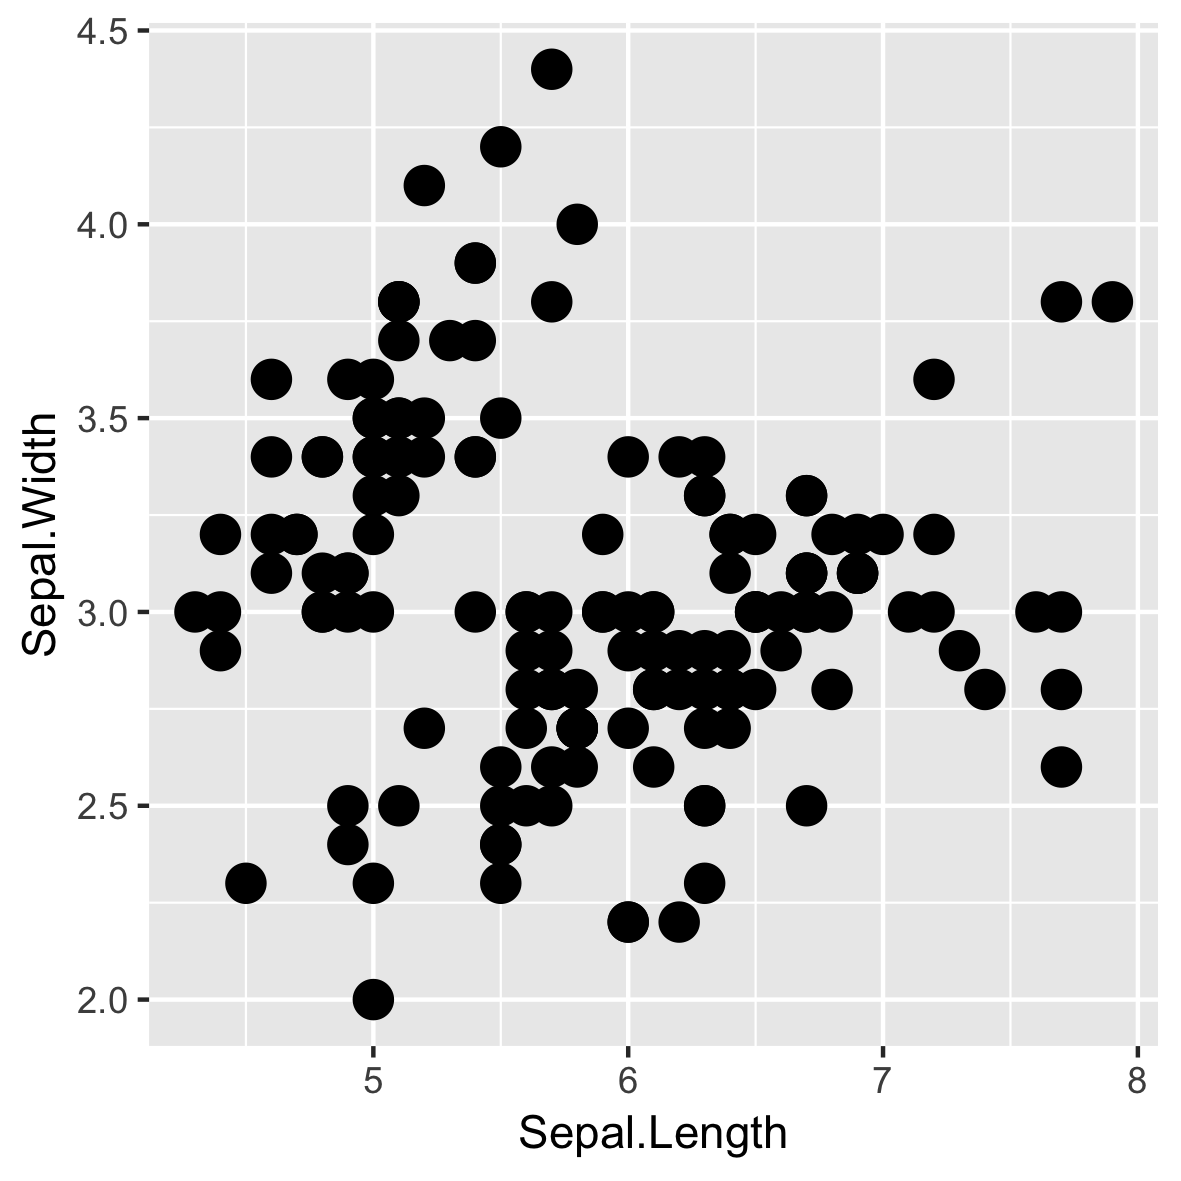
Attributs esthétiques ? Attributs !
Introduction à la visualisation de données avec ggplot2
Rick Scavetta
Founder, Scavetta Academy

