Les thèmes à partir de zéro
Introduction à la visualisation de données avec ggplot2

Rick Scavetta
Founder, Scavetta Academy
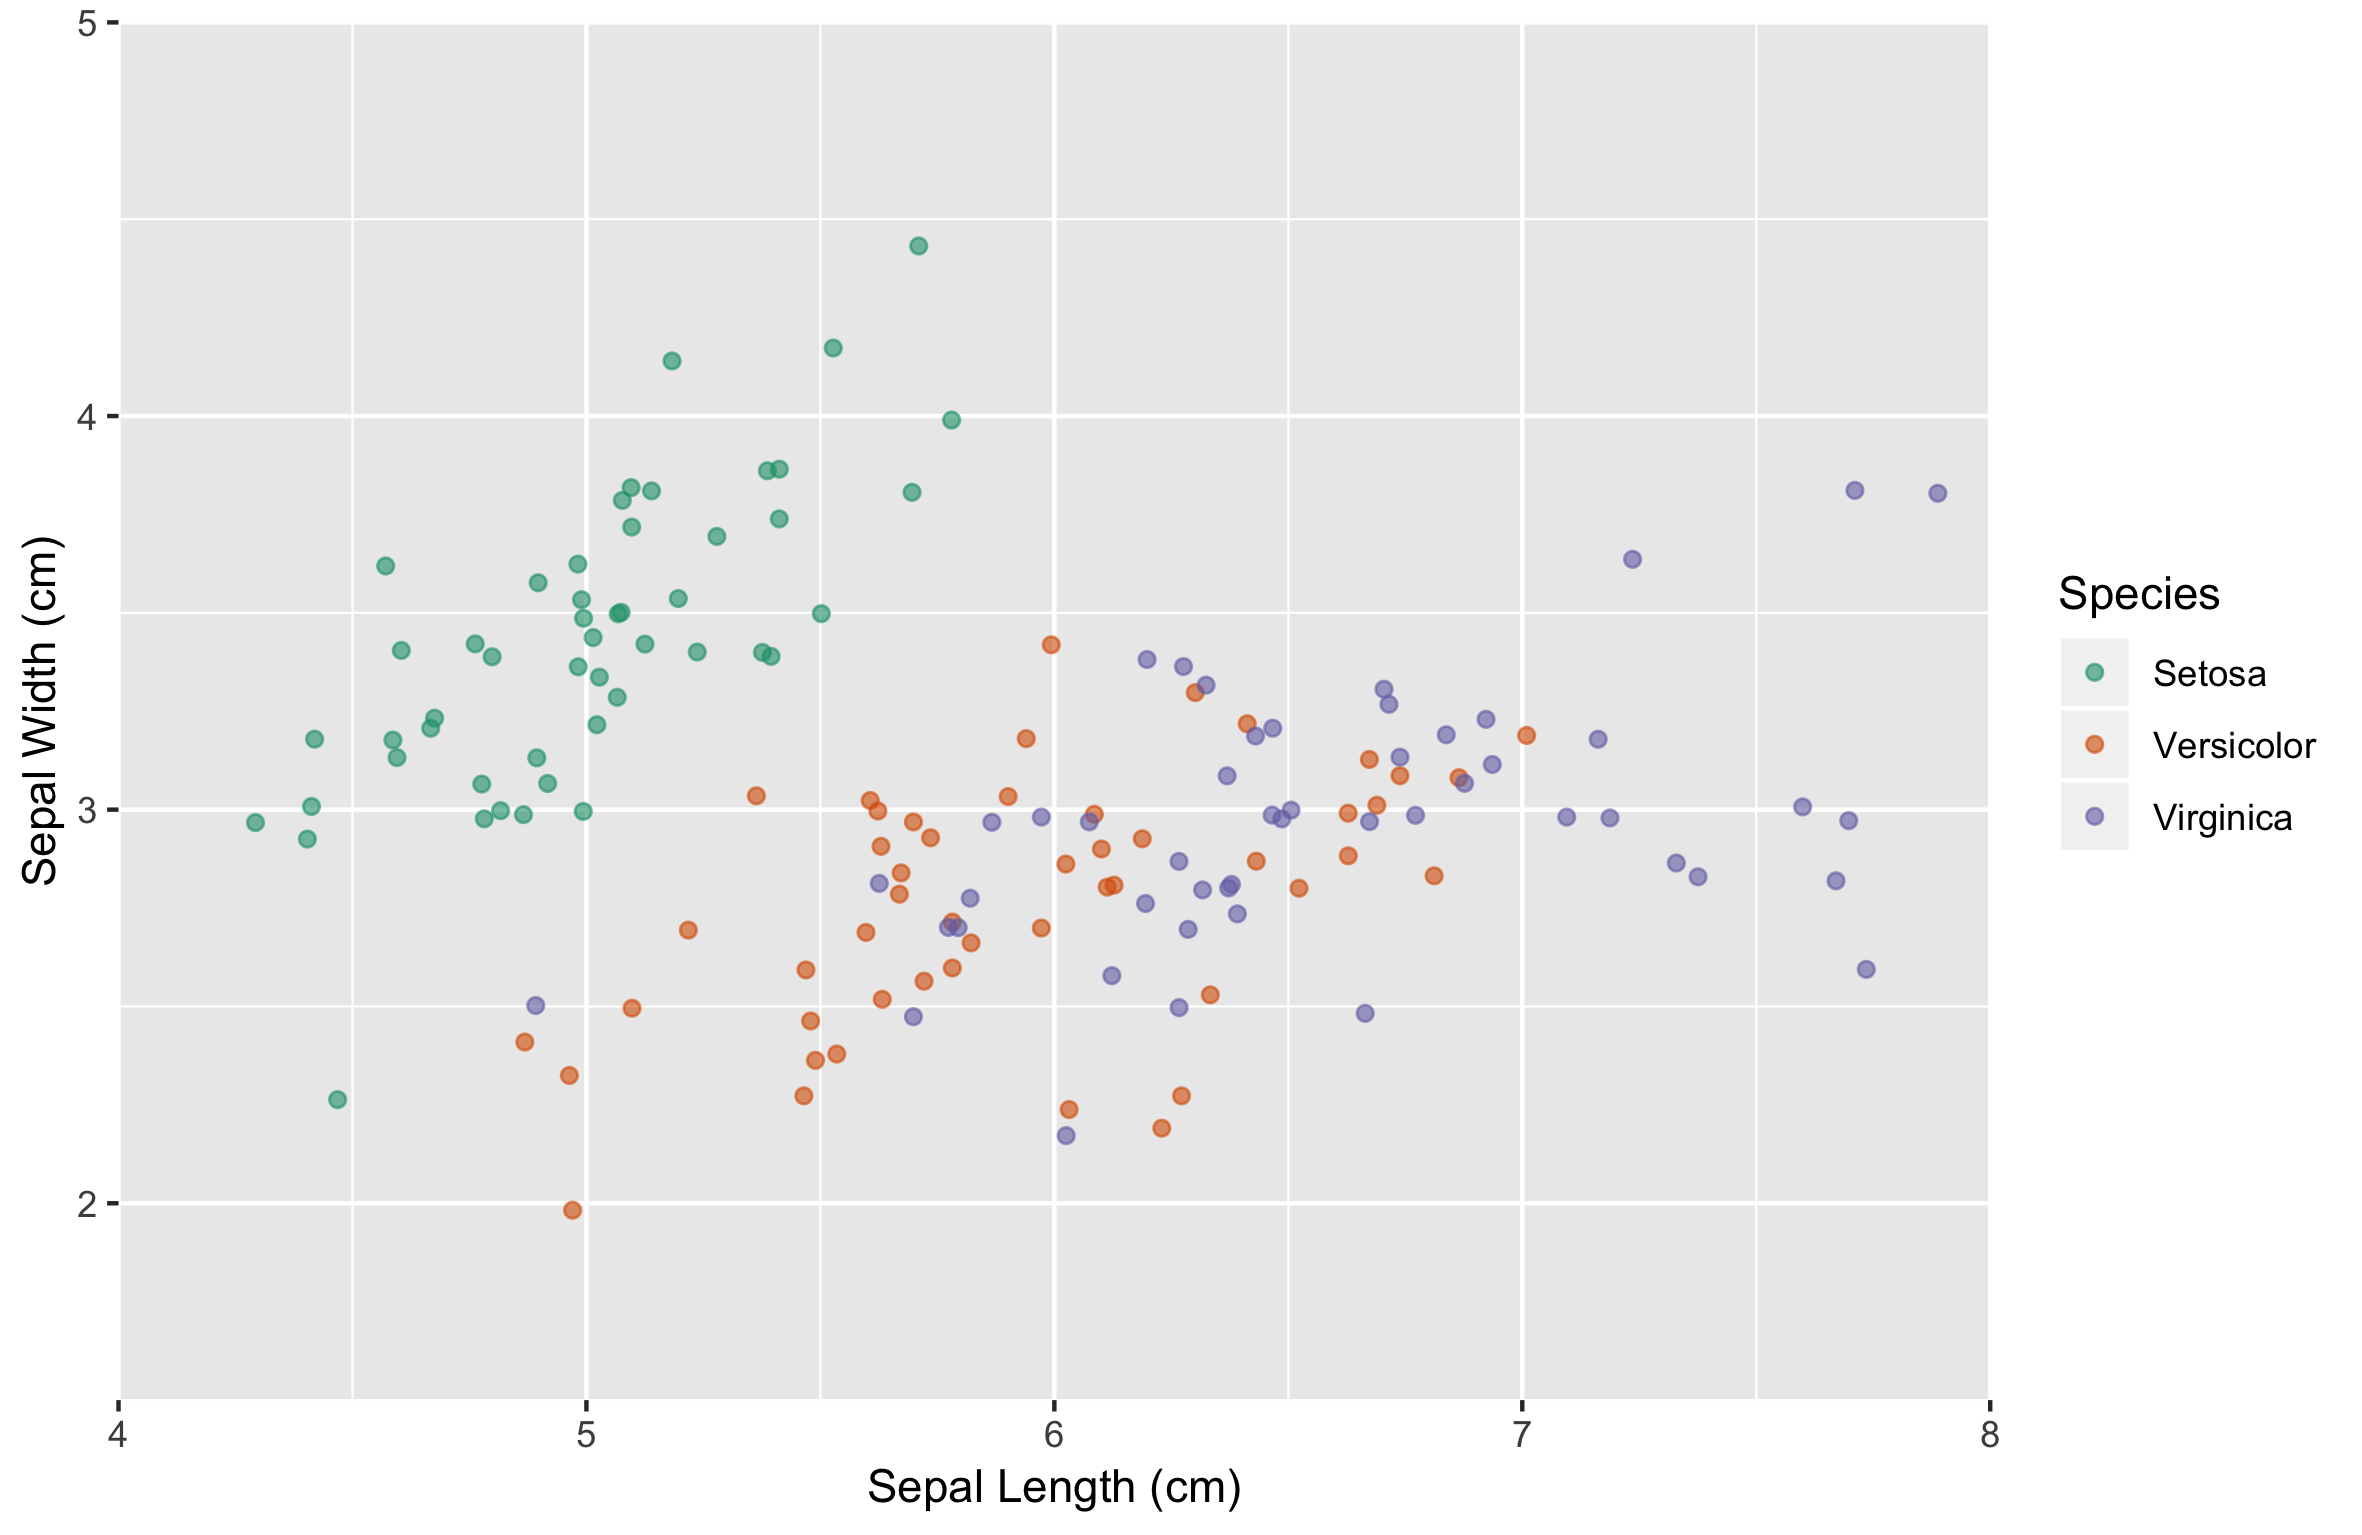
Un graphique de départ...
ggplot(iris, aes(x = Sepal.Length, y = Sepal.Width, color = Species)) +
  geom_jitter(alpha = 0.6)
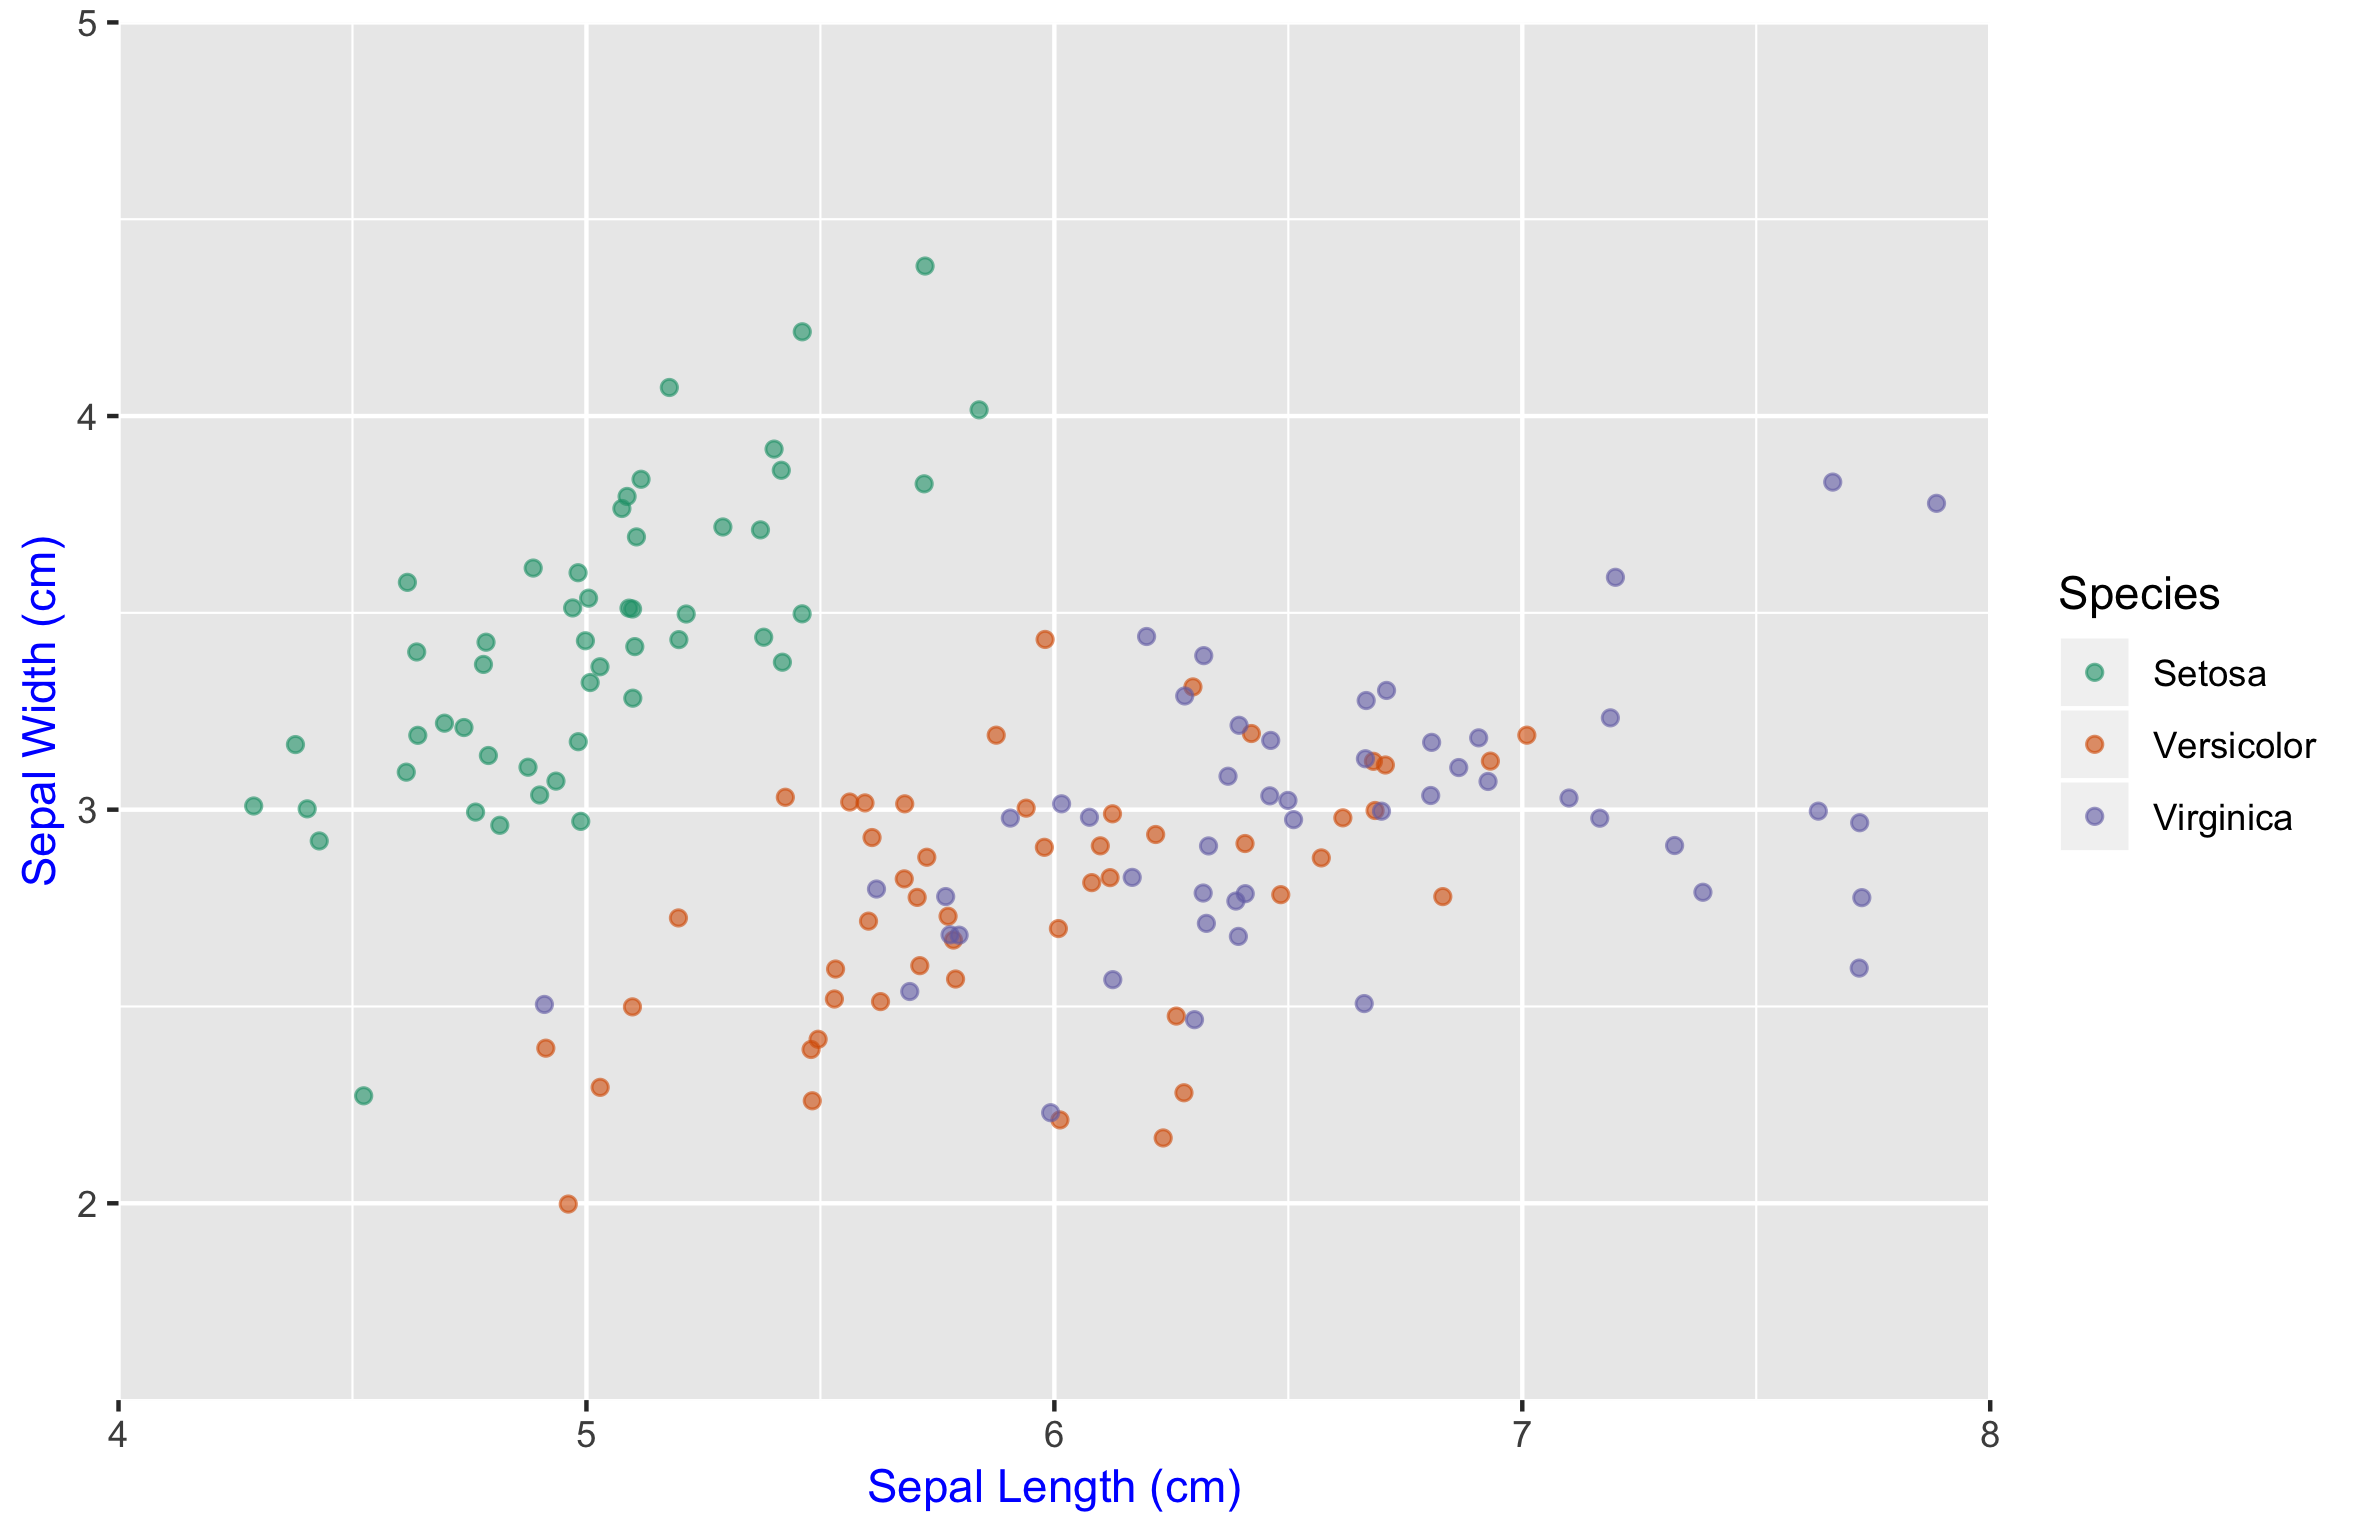
Les éléments de texte
Les éléments de texte
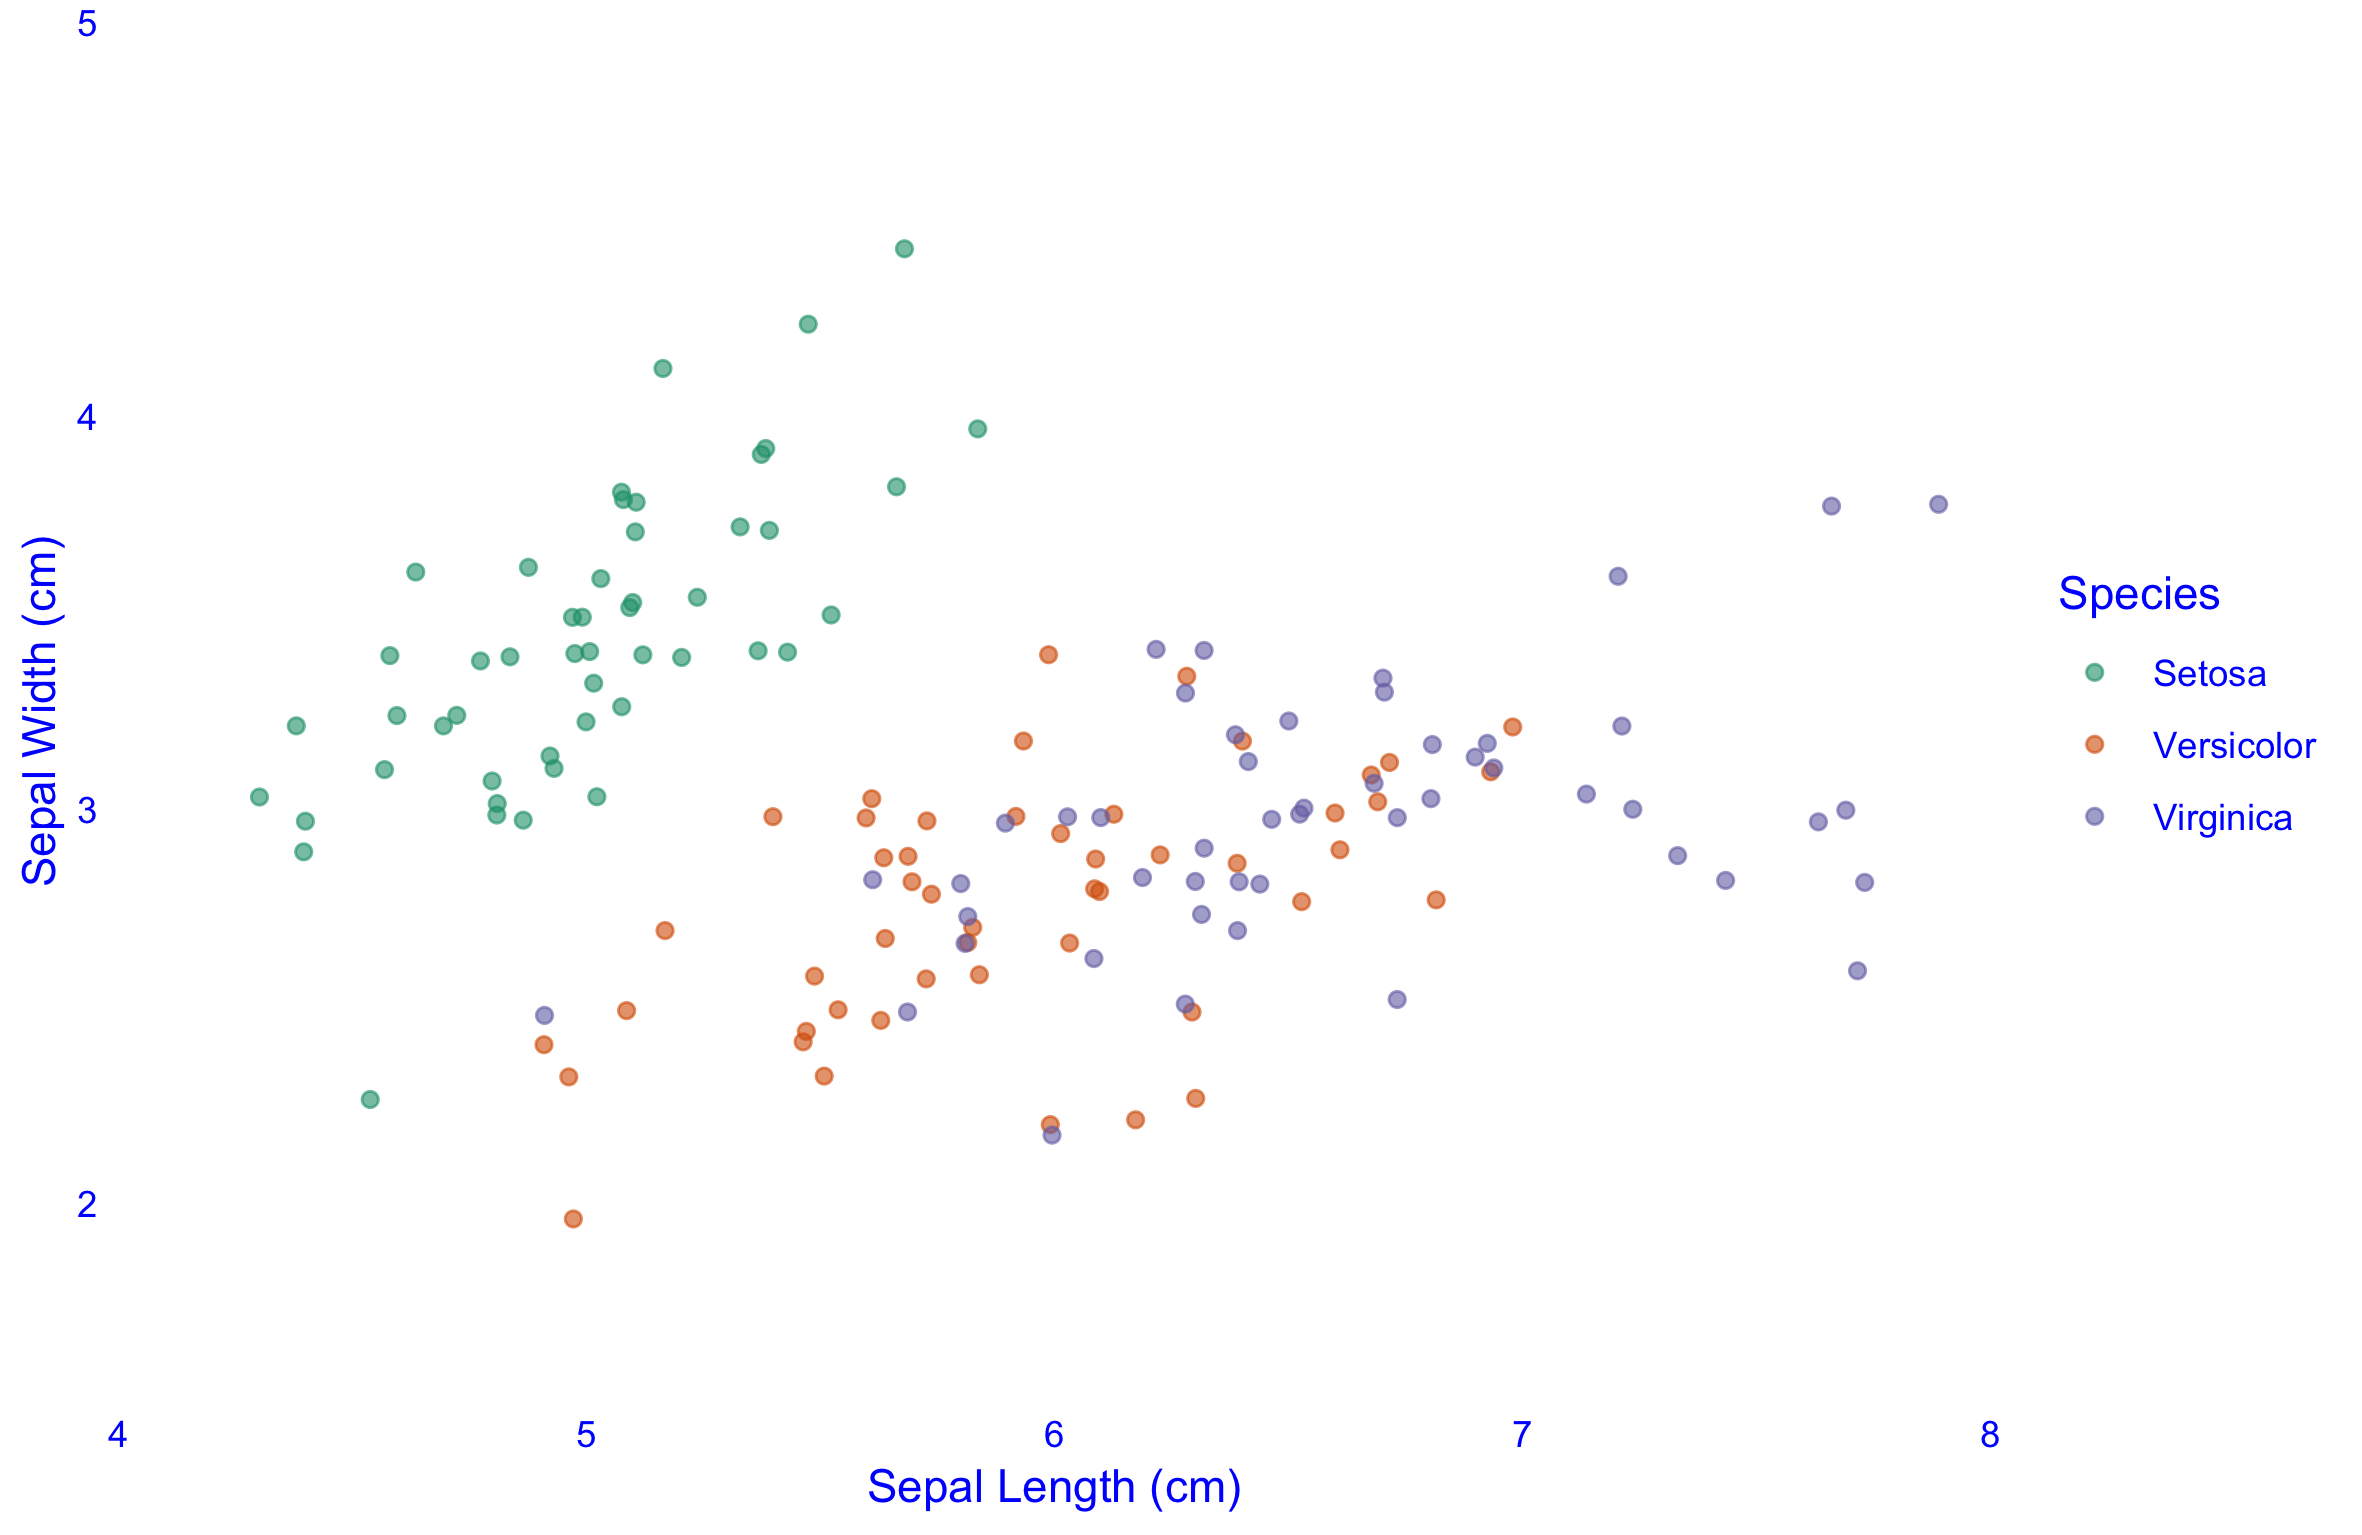
Ajustement des éléments du thème
ggplot(iris, aes(x = Sepal.Length, y = Sepal.Width, color = Species)) +
  geom_jitter(alpha = 0.6) +
  theme(axis.title = element_text(color = "blue"))
Un graphique de départ...
ggplot(iris, aes(x = Sepal.Length, y = Sepal.Width, color = Species)) +
  geom_jitter(alpha = 0.6)
Éléments linéaires
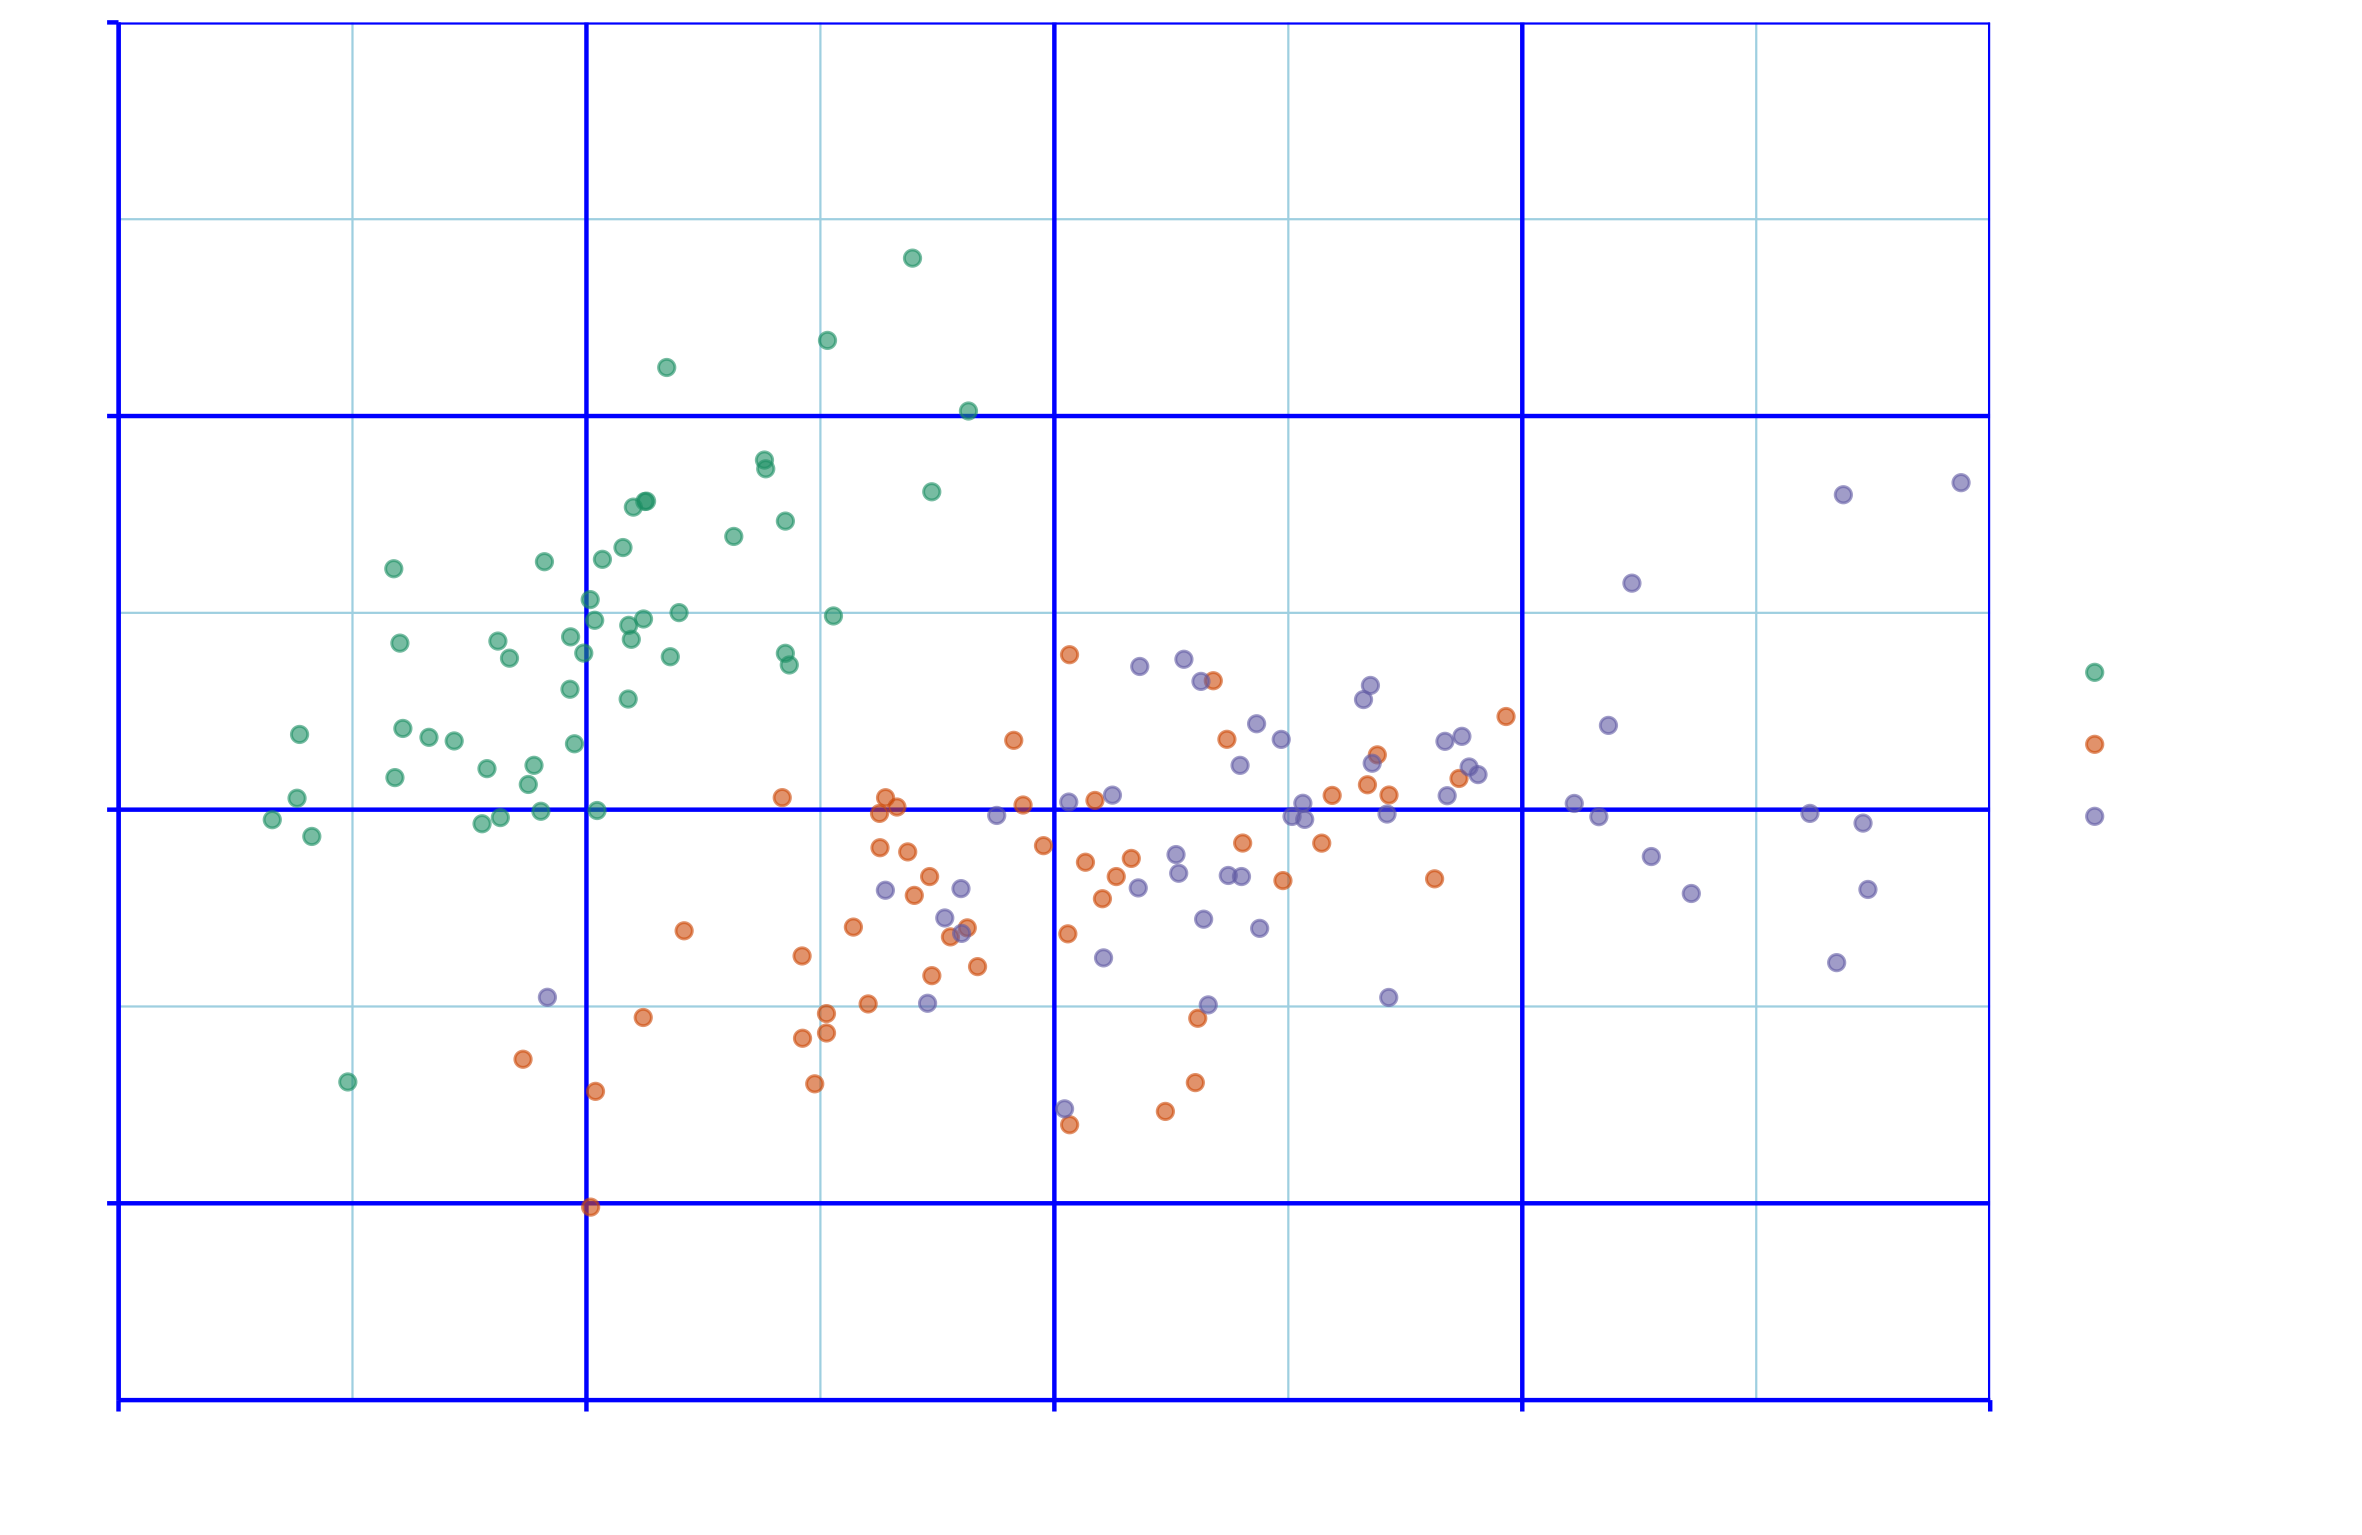
Un graphique de départ...
ggplot(iris, aes(x = Sepal.Length, y = Sepal.Width, color = Species)) +
  geom_jitter(alpha = 0.6)
Éléments rectangulaires
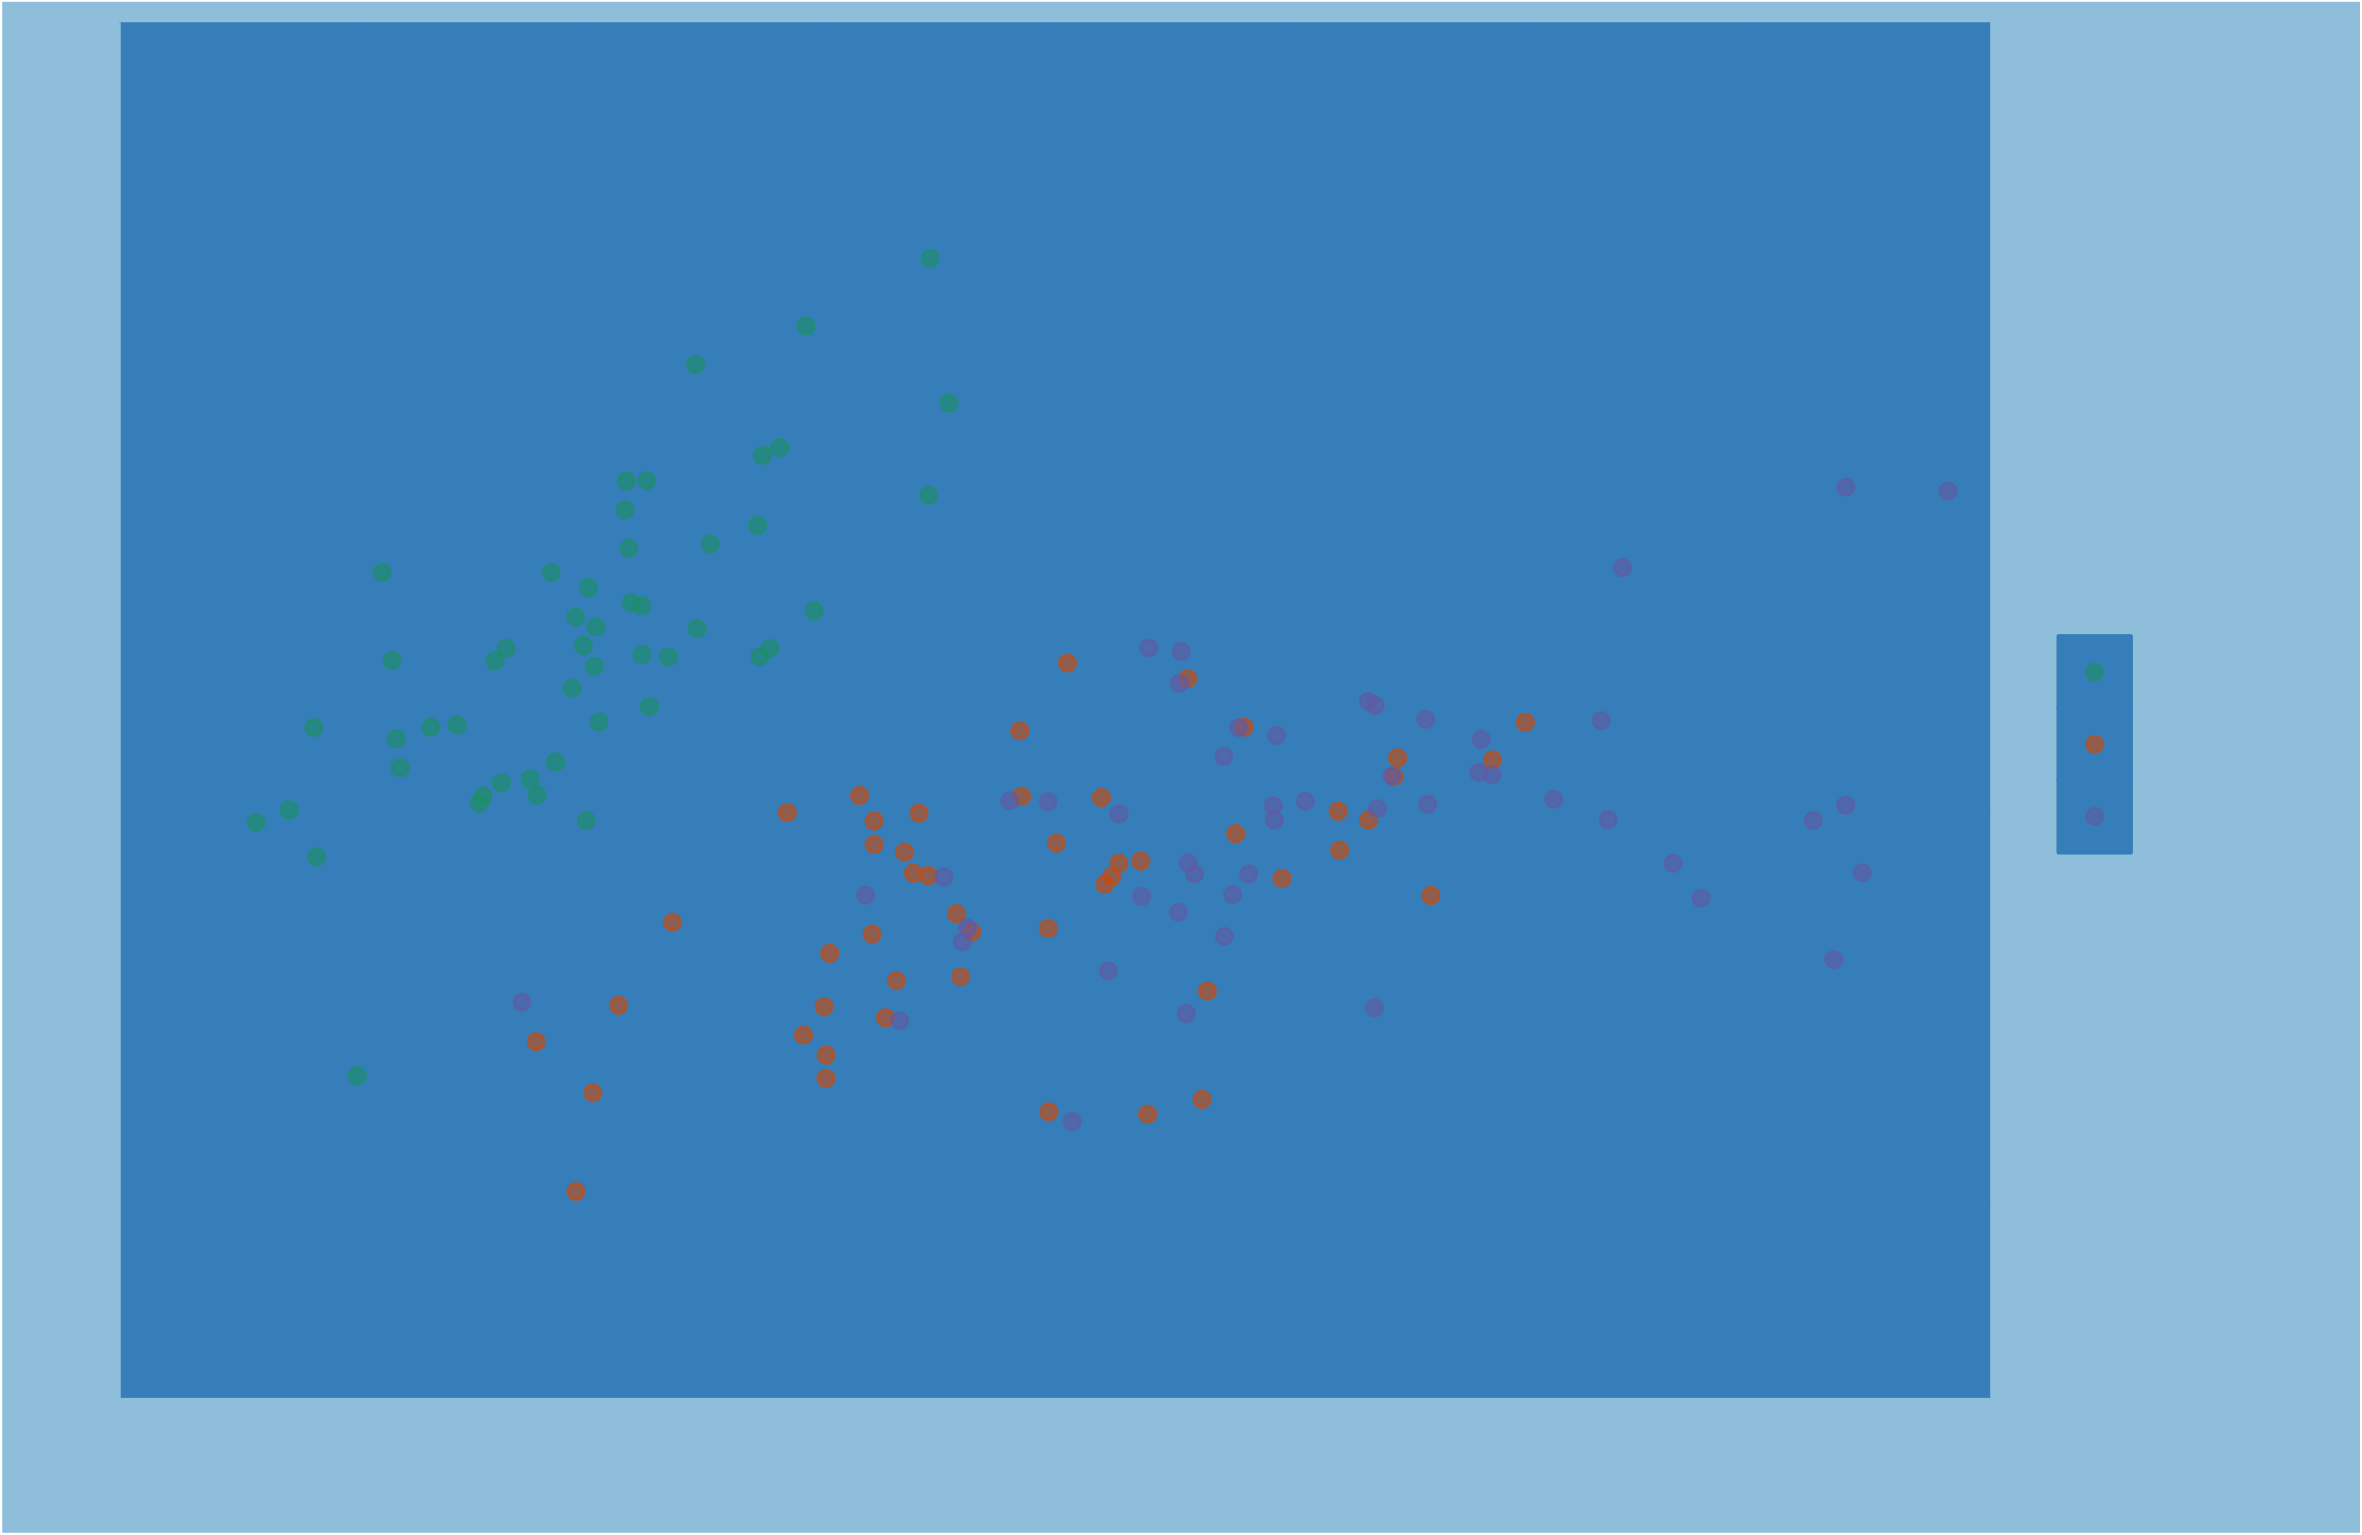
element_blank()
ggplot(iris, aes(x = Sepal.Length, y = Sepal.Width, color = Species)) +
geom_jitter(alpha = 0.6) +
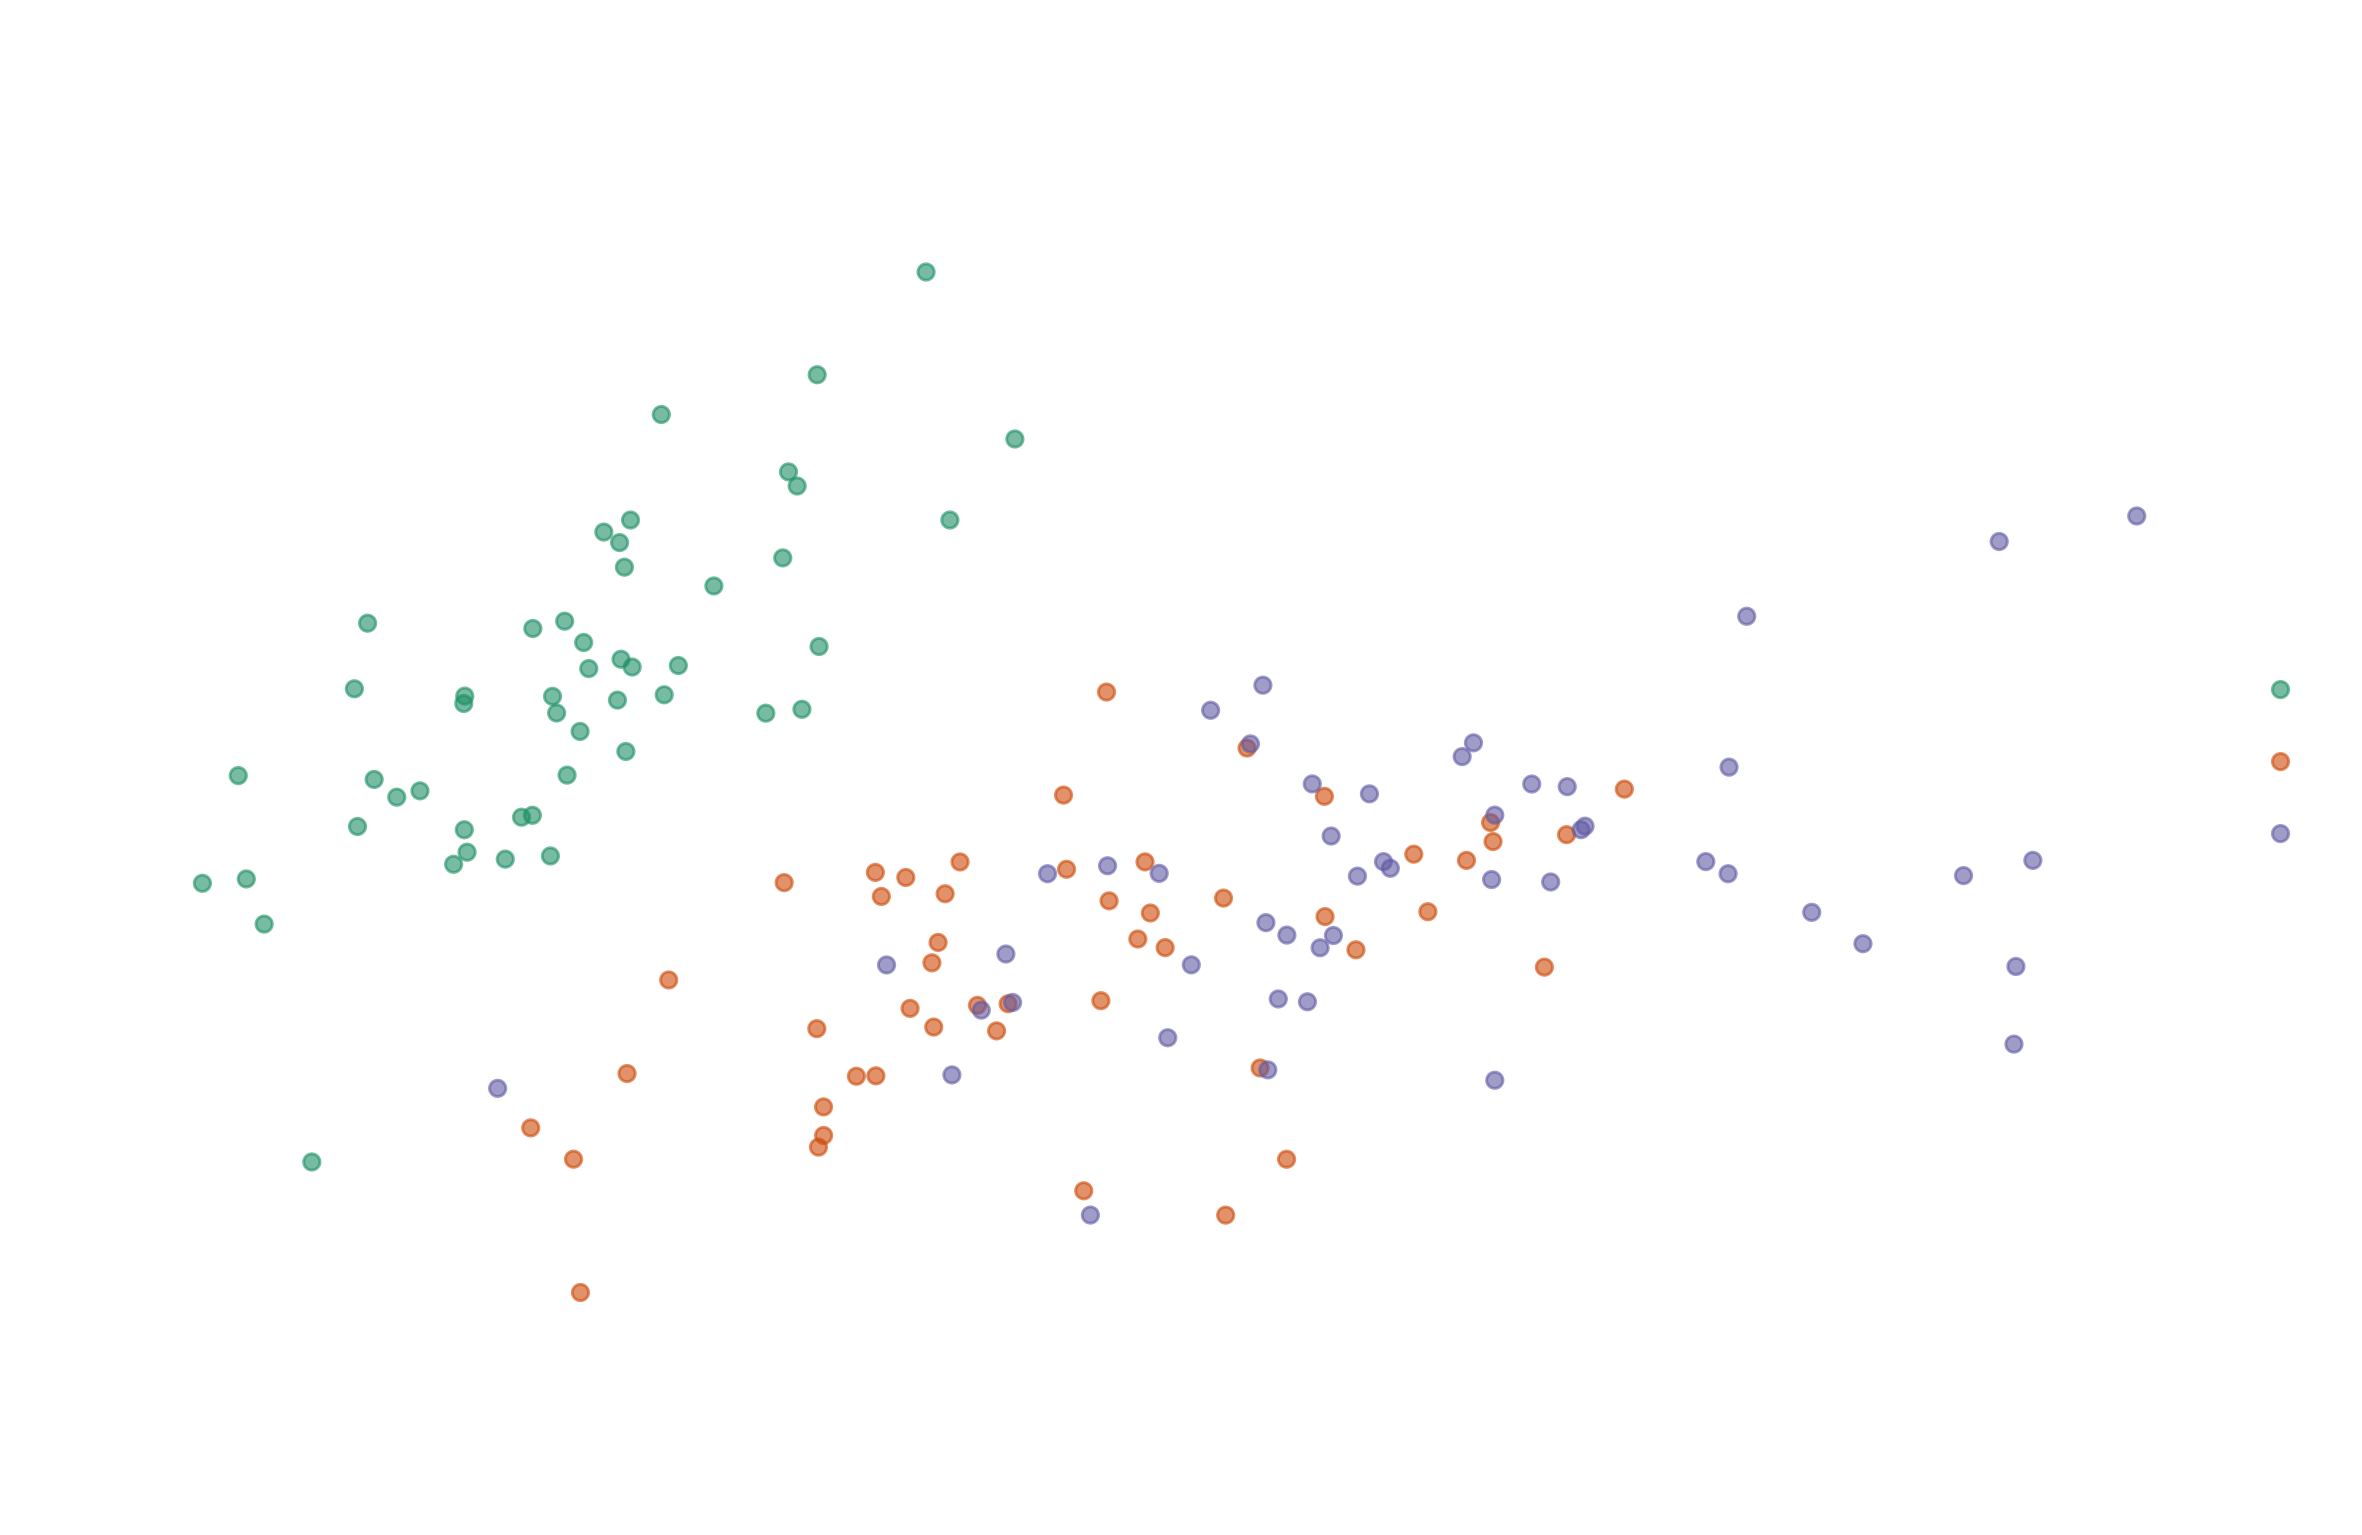
theme(line = element_blank(),
rect = element_blank(),
text = element_blank())