Prédictions et cotes
Introduction à la régression avec statsmodels en Python

Maarten Van den Broeck
Content Developer at DataCamp
Prédictions de regplot()
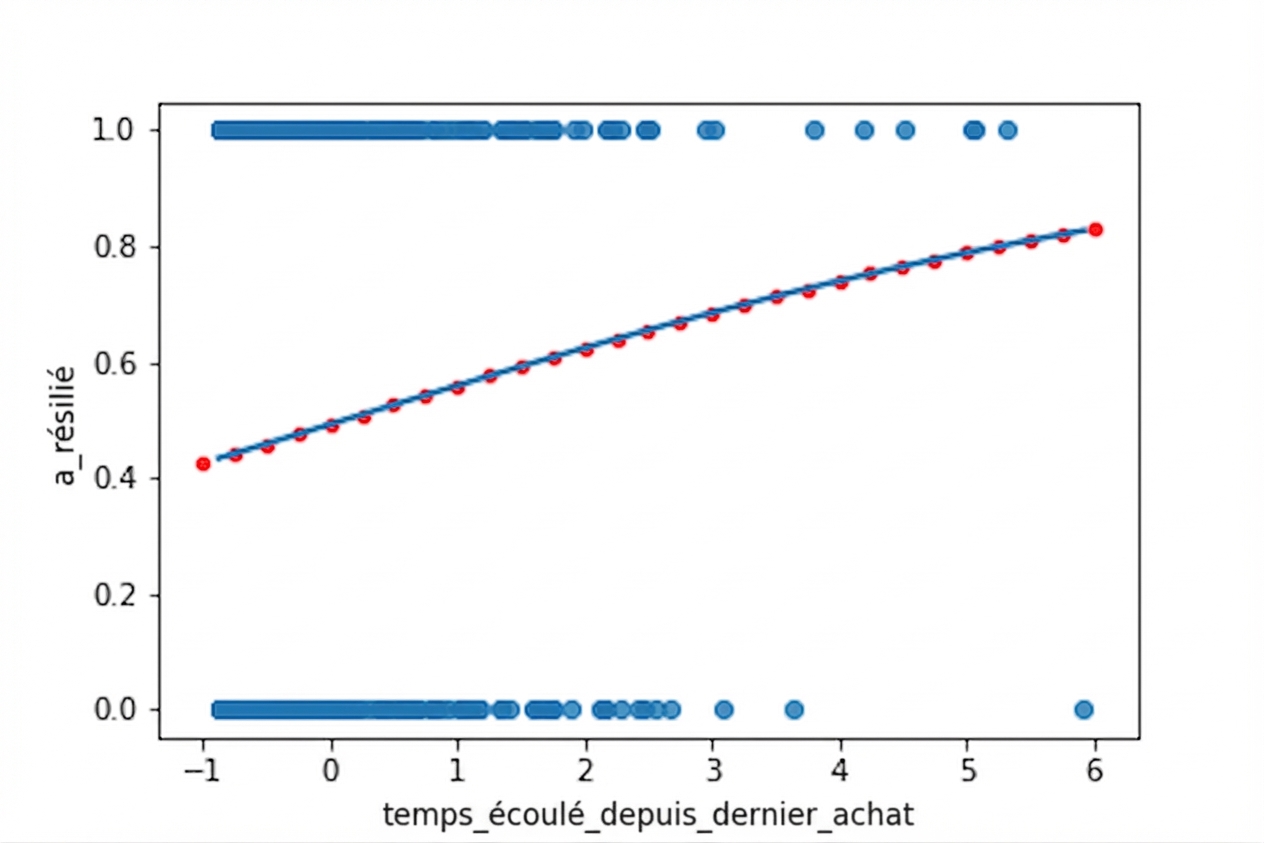
Ajouter des prédictions ponctuelles
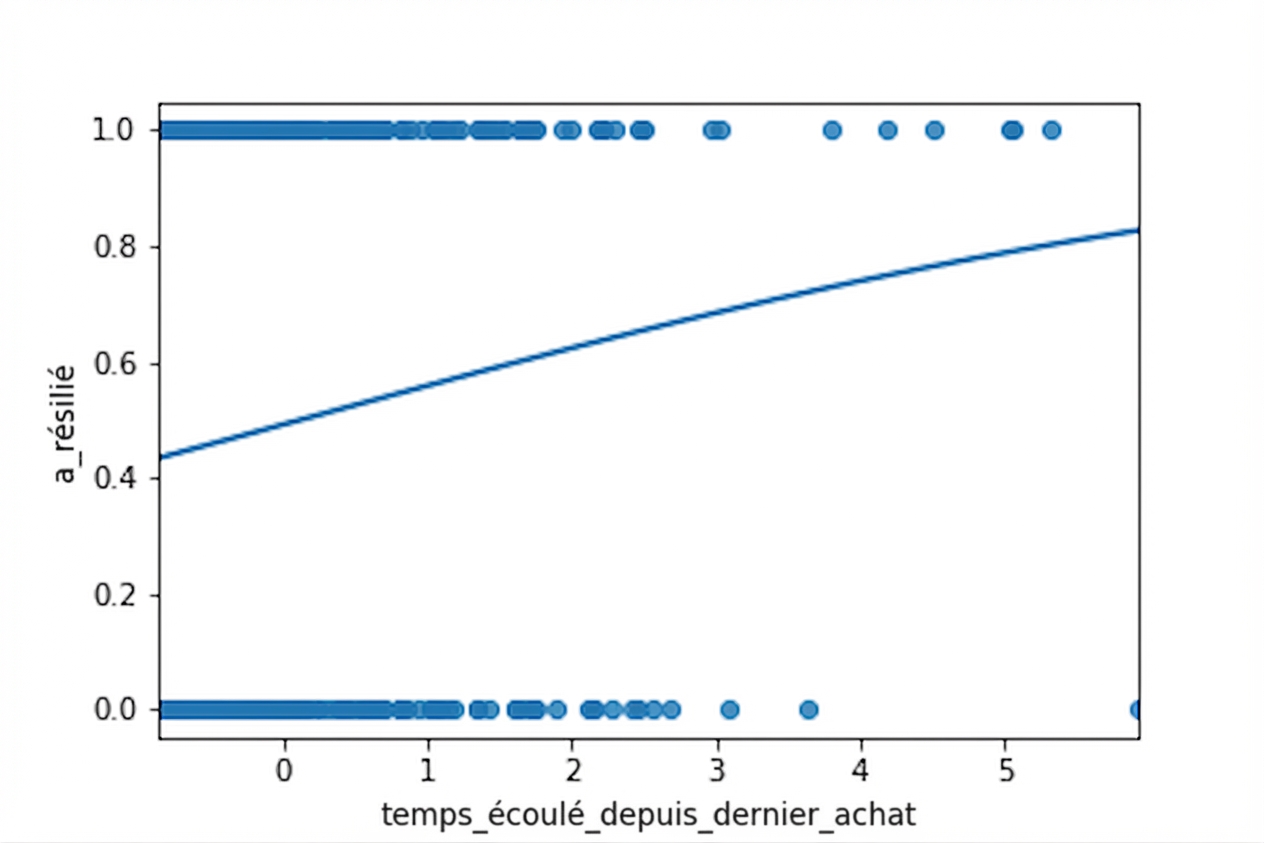
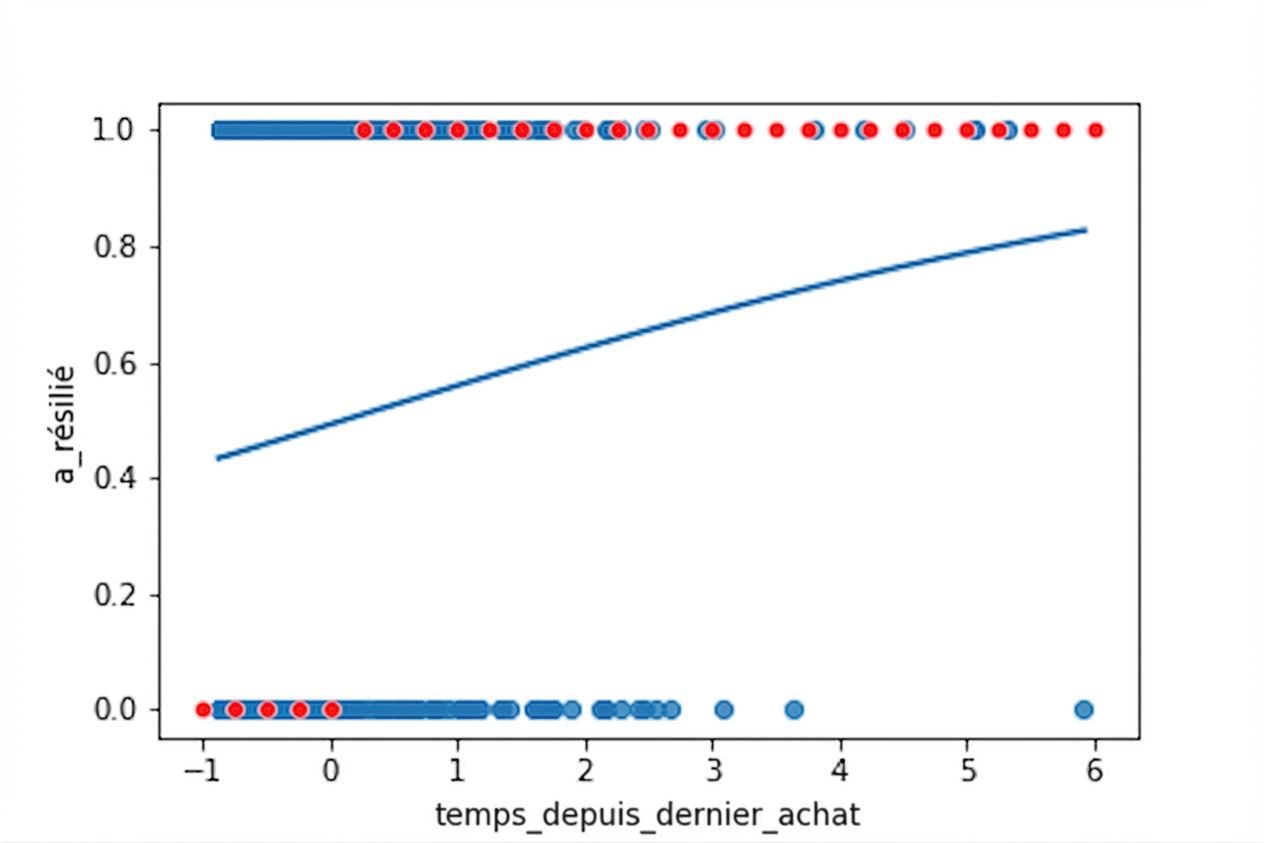
Visualiser l’issue la plus probable
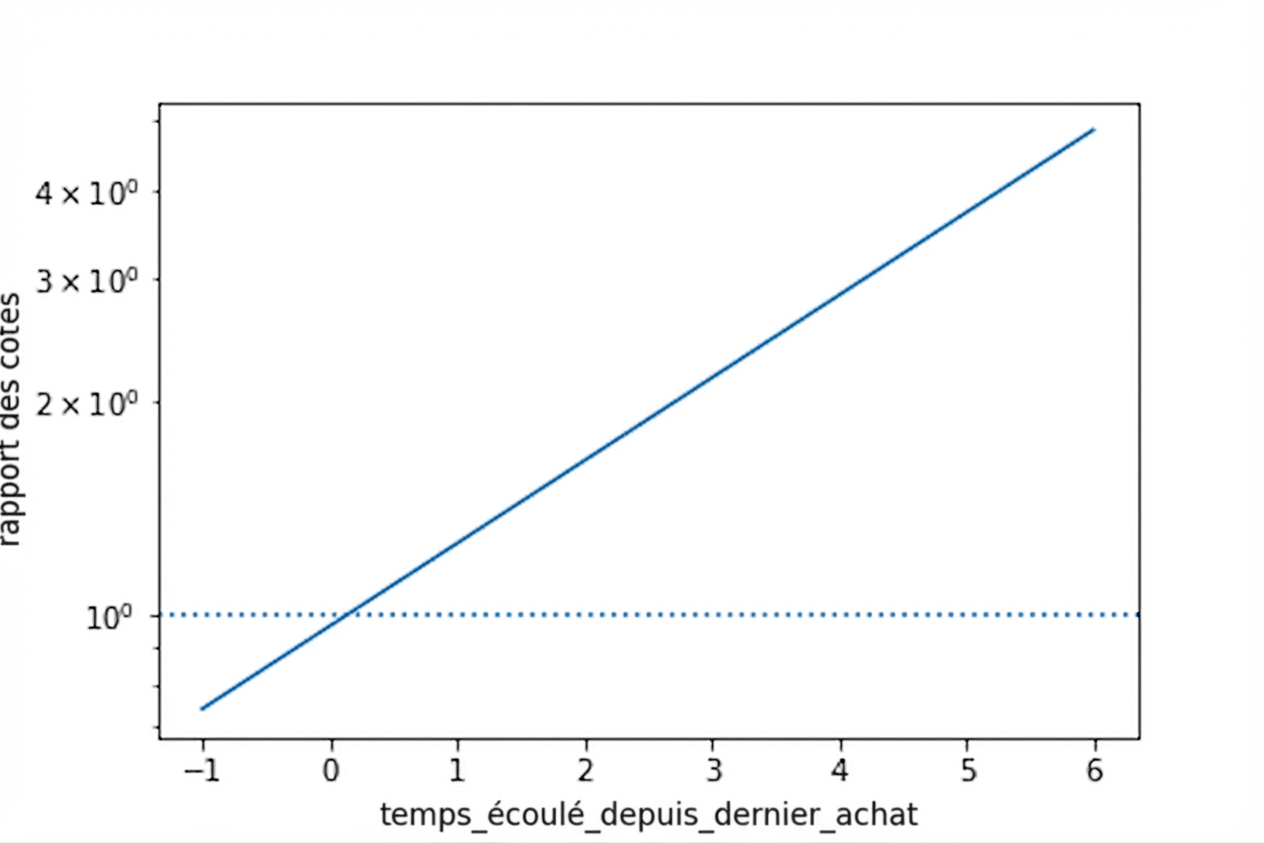
Cotes
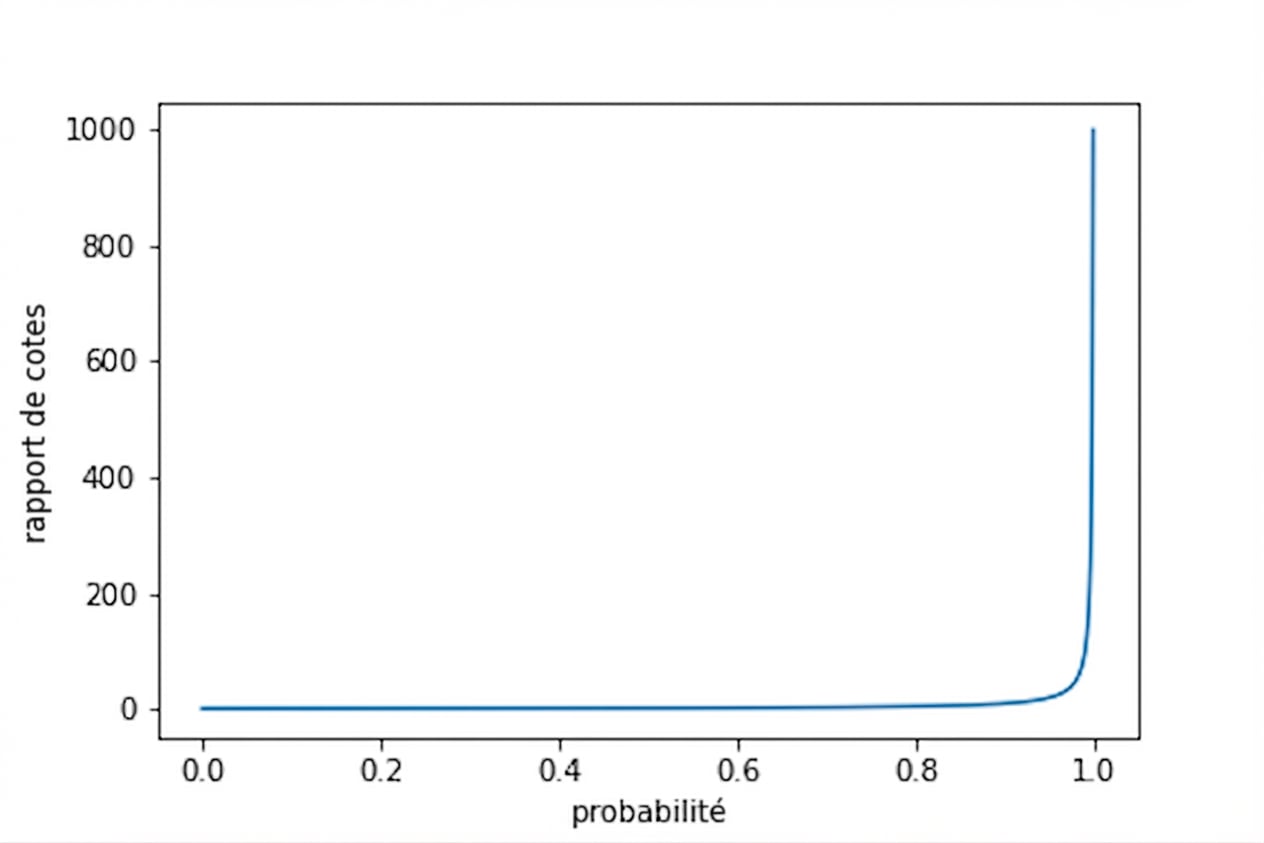
Visualiser les cotes
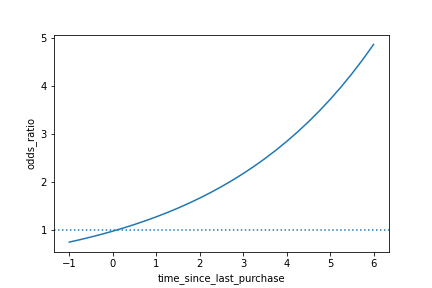
Visualiser les log‑cotes