DAX pour créer des tables et des colonnes
Fonctions DAX dans Power BI

Carl Rosseel
Curriculum Manager at DataCamp
DAX = Data Analysis Expressions
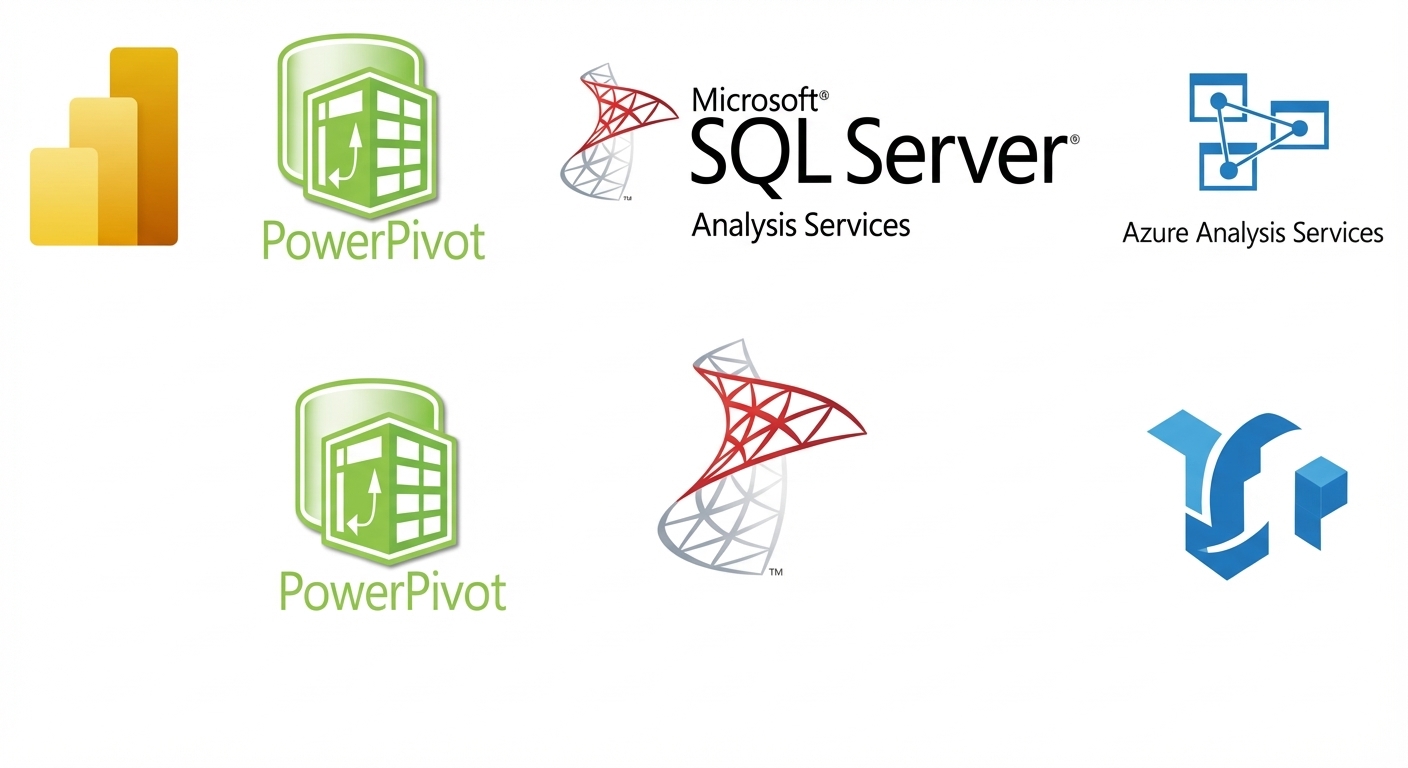
- DAX est un langage d’expressions utilisé dans plusieurs outils d’analyse Microsoft
- Les formules DAX combinent fonctions, opérateurs et valeurs pour des calculs avancés
- Les formules DAX sont utilisées dans :
- Mesures
- Colonnes calculées
- Tables calculées
- Sécurité au niveau des lignes
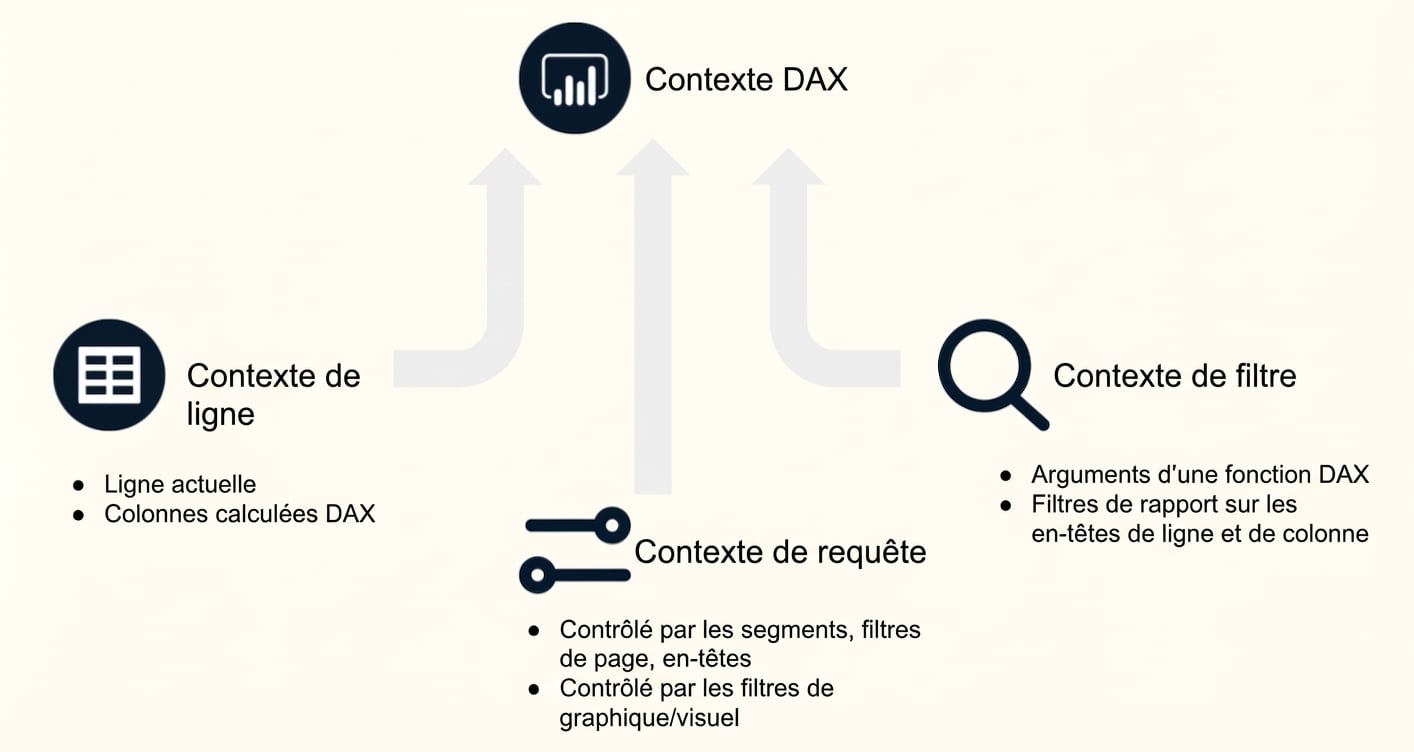
Le contexte en bref
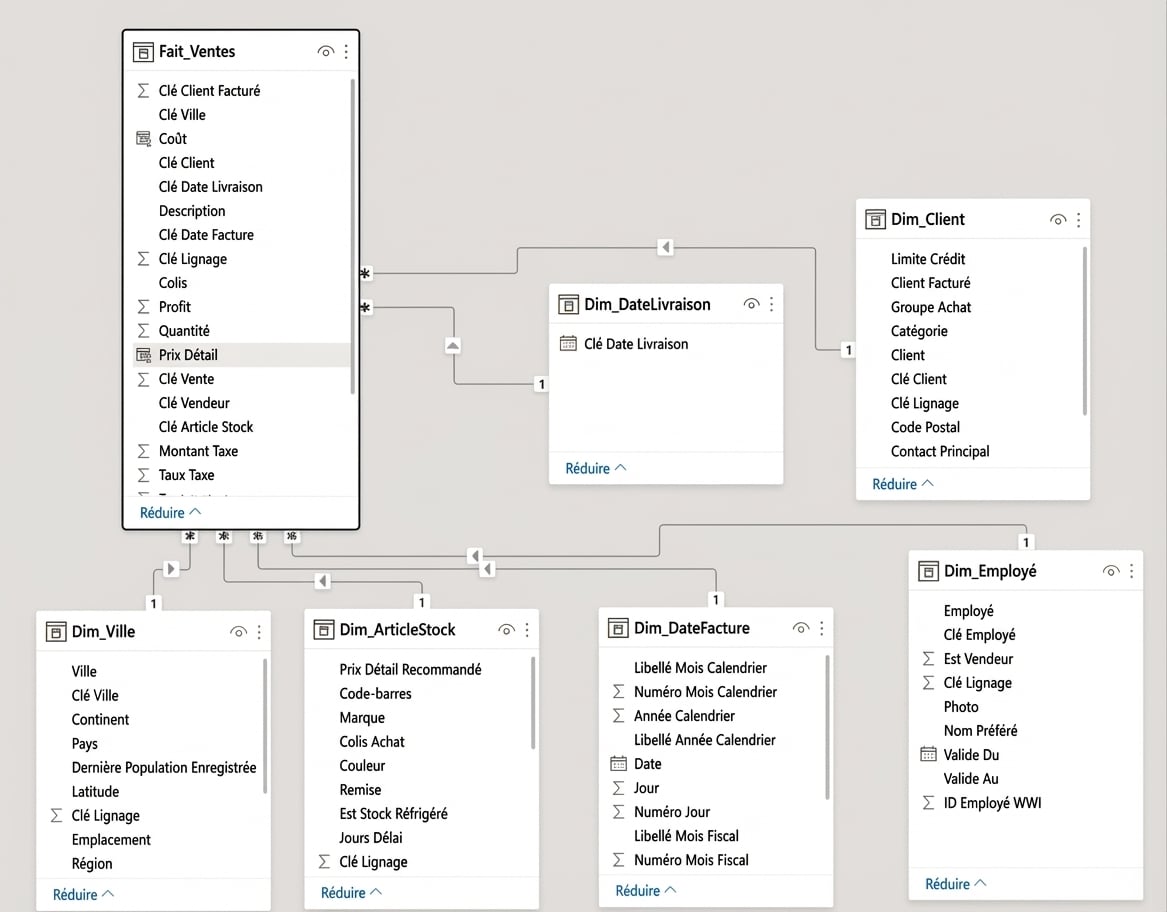
Jeu de données World Wide Importers