Introduction aux tableaux

Introduction à NumPy

Izzy Weber

Core Curriculum Manager, DataCamp

NumPy et l’écosystème Python
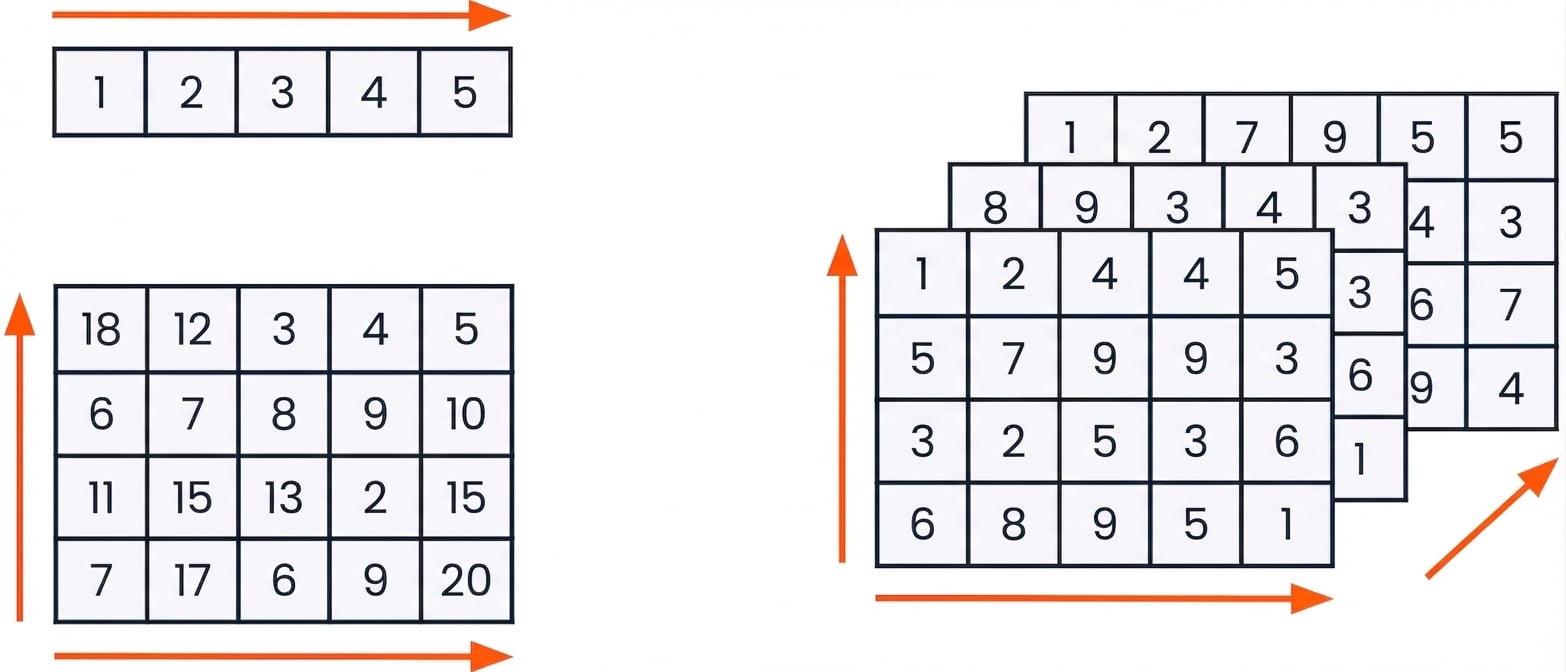
Un visuel d’Atlas portant le globe, stylisé NumPy, car NumPy soutient l’écosystème Python

Introduction à NumPy

Tableaux NumPy


graphique de tableaux 1D, 2D et 3D

Introduction à NumPy

Importer NumPy


import numpy as np
Introduction à NumPy

Créer des tableaux 1D depuis des listes

python_list = [3, 2, 5, 8, 4, 9, 7, 6, 1]
array = np.array(python_list)
array
array([3, 2, 5, 8, 4, 9, 7, 6, 1])


type(array)
numpy.ndarray
Introduction à NumPy

Créer des tableaux 2D depuis des listes

python_list_of_lists = [[3, 2, 5],
                        [9, 7, 1],
                        [4, 3, 6]]
np.array(python_list_of_lists)
array([[3, 2, 5],
       [9, 7, 1],
       [4, 3, 6]])
Introduction à NumPy

Listes Python

  • Peuvent contenir plusieurs types de données
python_list = ["beep", False, 56, .945, [3, 2, 5]]


Tableaux NumPy

  • Ne contiennent qu’un seul type de données
  • Occupent moins de mémoire
numpy_boolean_array = [[True, False], [True, True], [False, True]]

numpy_float_array = [1.9, 5.4, 8.8, 3.6, 3.2]
Introduction à NumPy

Créer des tableaux depuis zéro


De nombreuses fonctions NumPy créent des tableaux depuis zéro, notamment :

  • np.zeros()
  • np.random.random()
  • np.arange()
Introduction à NumPy

Créer des tableaux : np.zeros()

np.zeros((5, 3))
array([[0., 0., 0.],
       [0., 0., 0.],
       [0., 0., 0.],
       [0., 0., 0.],
       [0., 0., 0.]])
Introduction à NumPy

Créer des tableaux : np.random.random()

np.random.random((2, 4))
array([[0.88524516, 0.85641352, 0.33463107, 0.53337117],
       [0.69933362, 0.09295327, 0.93616428, 0.03601592]])


np.random est un module NumPy, tandis que np.random.random() est une fonction de np.random

Introduction à NumPy

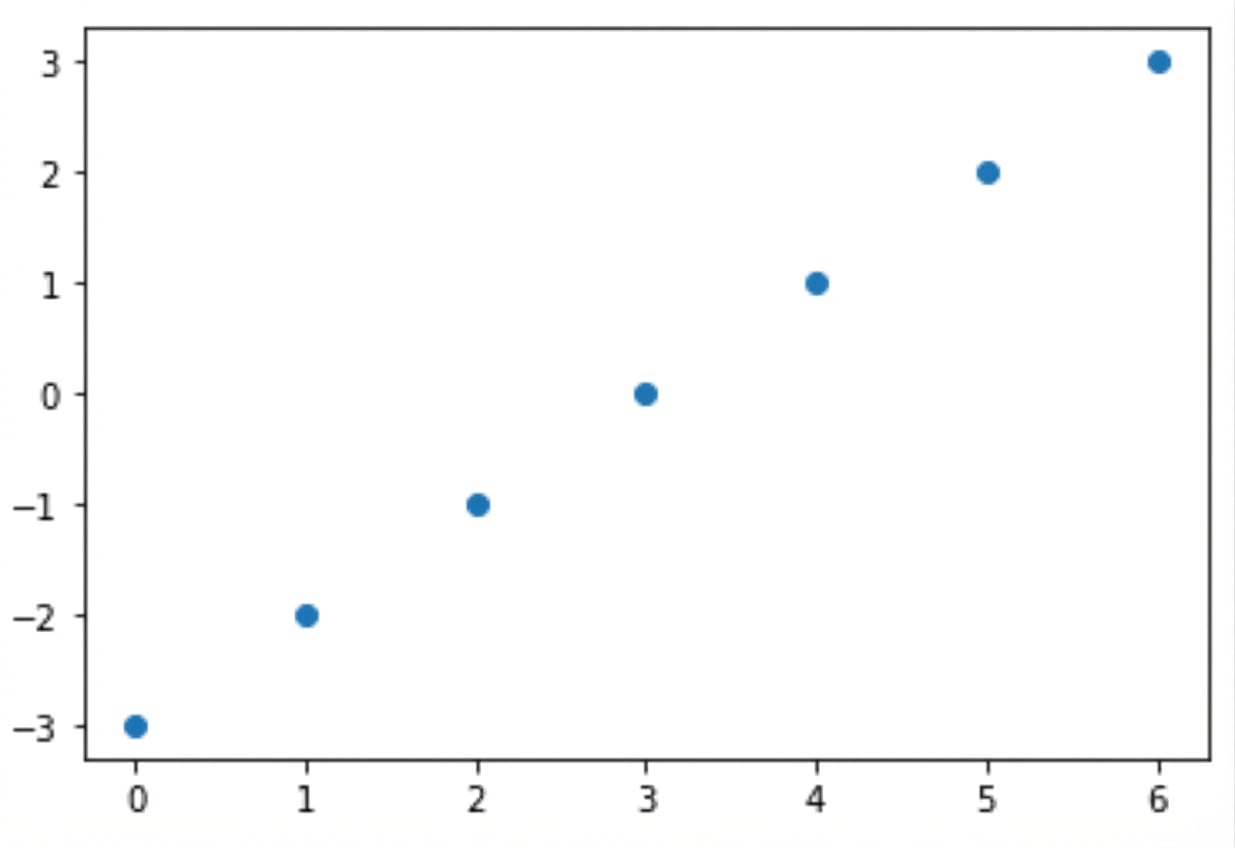
Créer des tableaux avec np.arange()

np.arange(-3, 4)
array([-3, -2, -1,  0,  1,  2,  3])
np.arange(4)
array([0, 1, 2, 3])
np.arange(-3, 4, 3)
array([-3,  0,  3])
from matplotlib import pyplot as plt
plt.scatter(np.arange(0, 7),
            np.arange(-3, 4))
plt.show()

Un nuage de points de deux intervalles sur les axes X et Y

Introduction à NumPy

Passons à la pratique !

Introduction à NumPy

Preparing Video For Download...