Options supplémentaires de catplot()
Utilisation de données catégorielles dans Python

Kasey Jones
Research Data Scientist
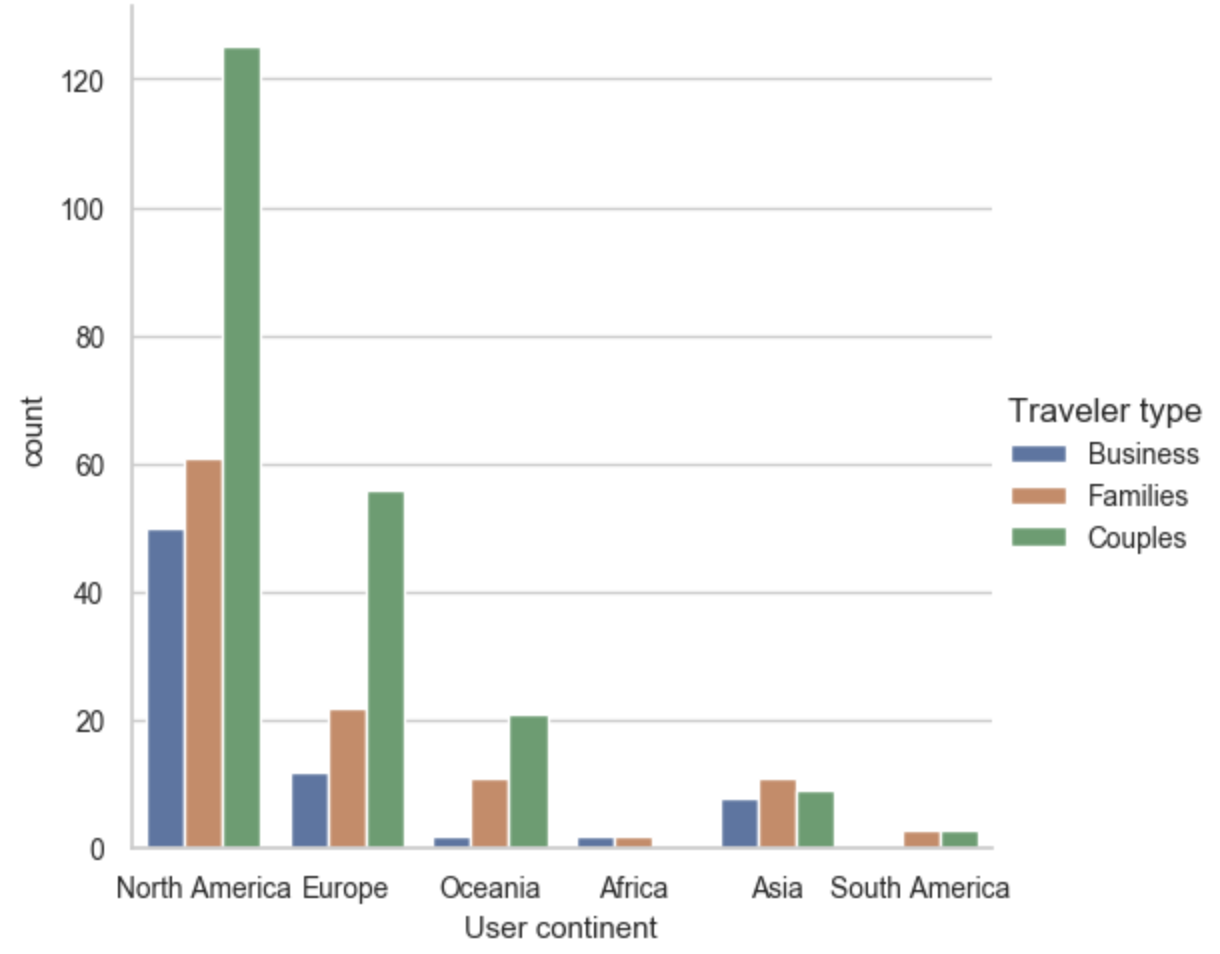
Difficultés avec les graphiques catégoriels
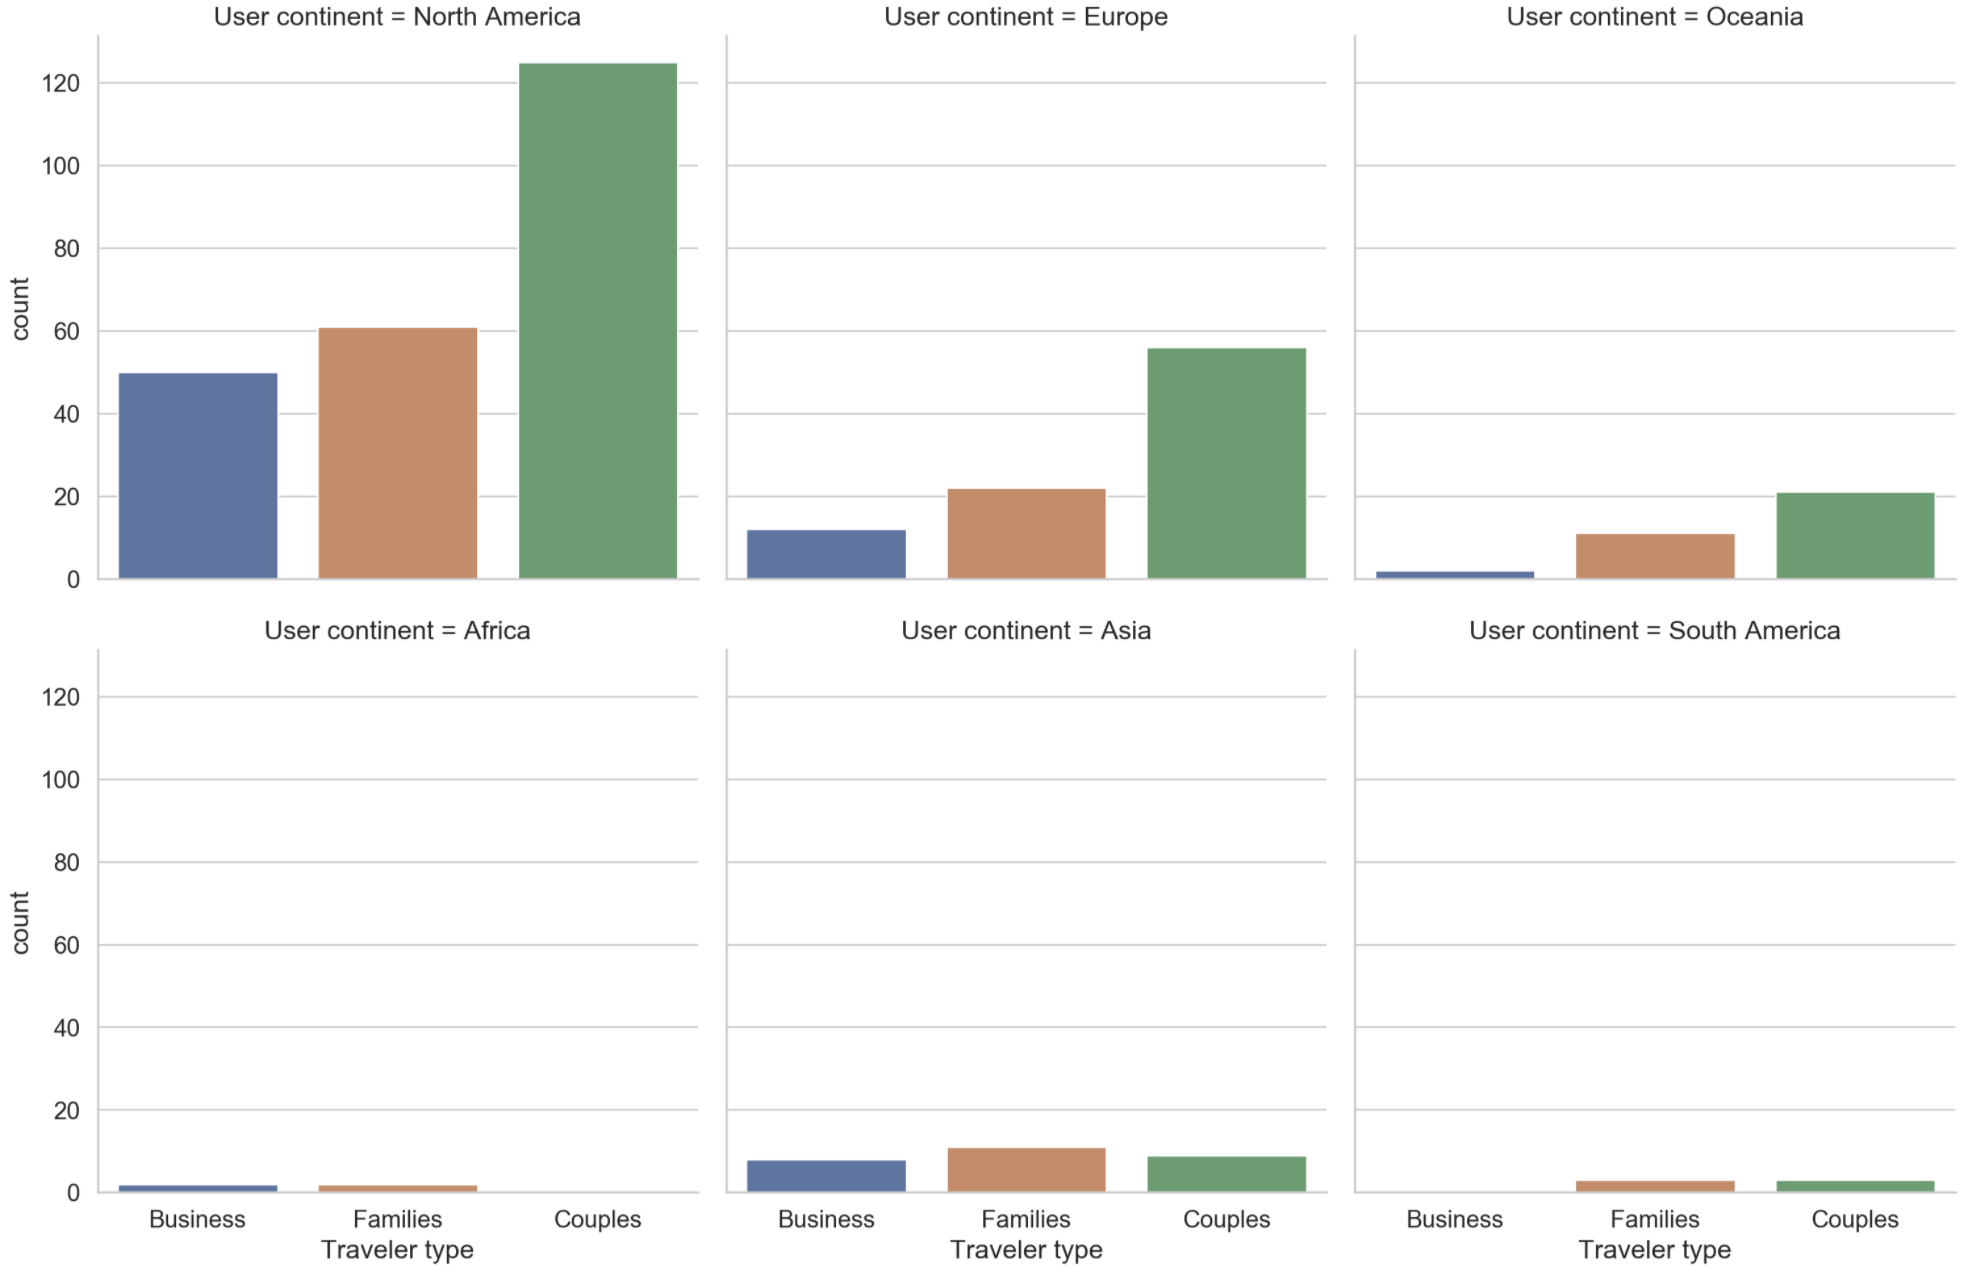
Utiliser le facetgrid de catplot()
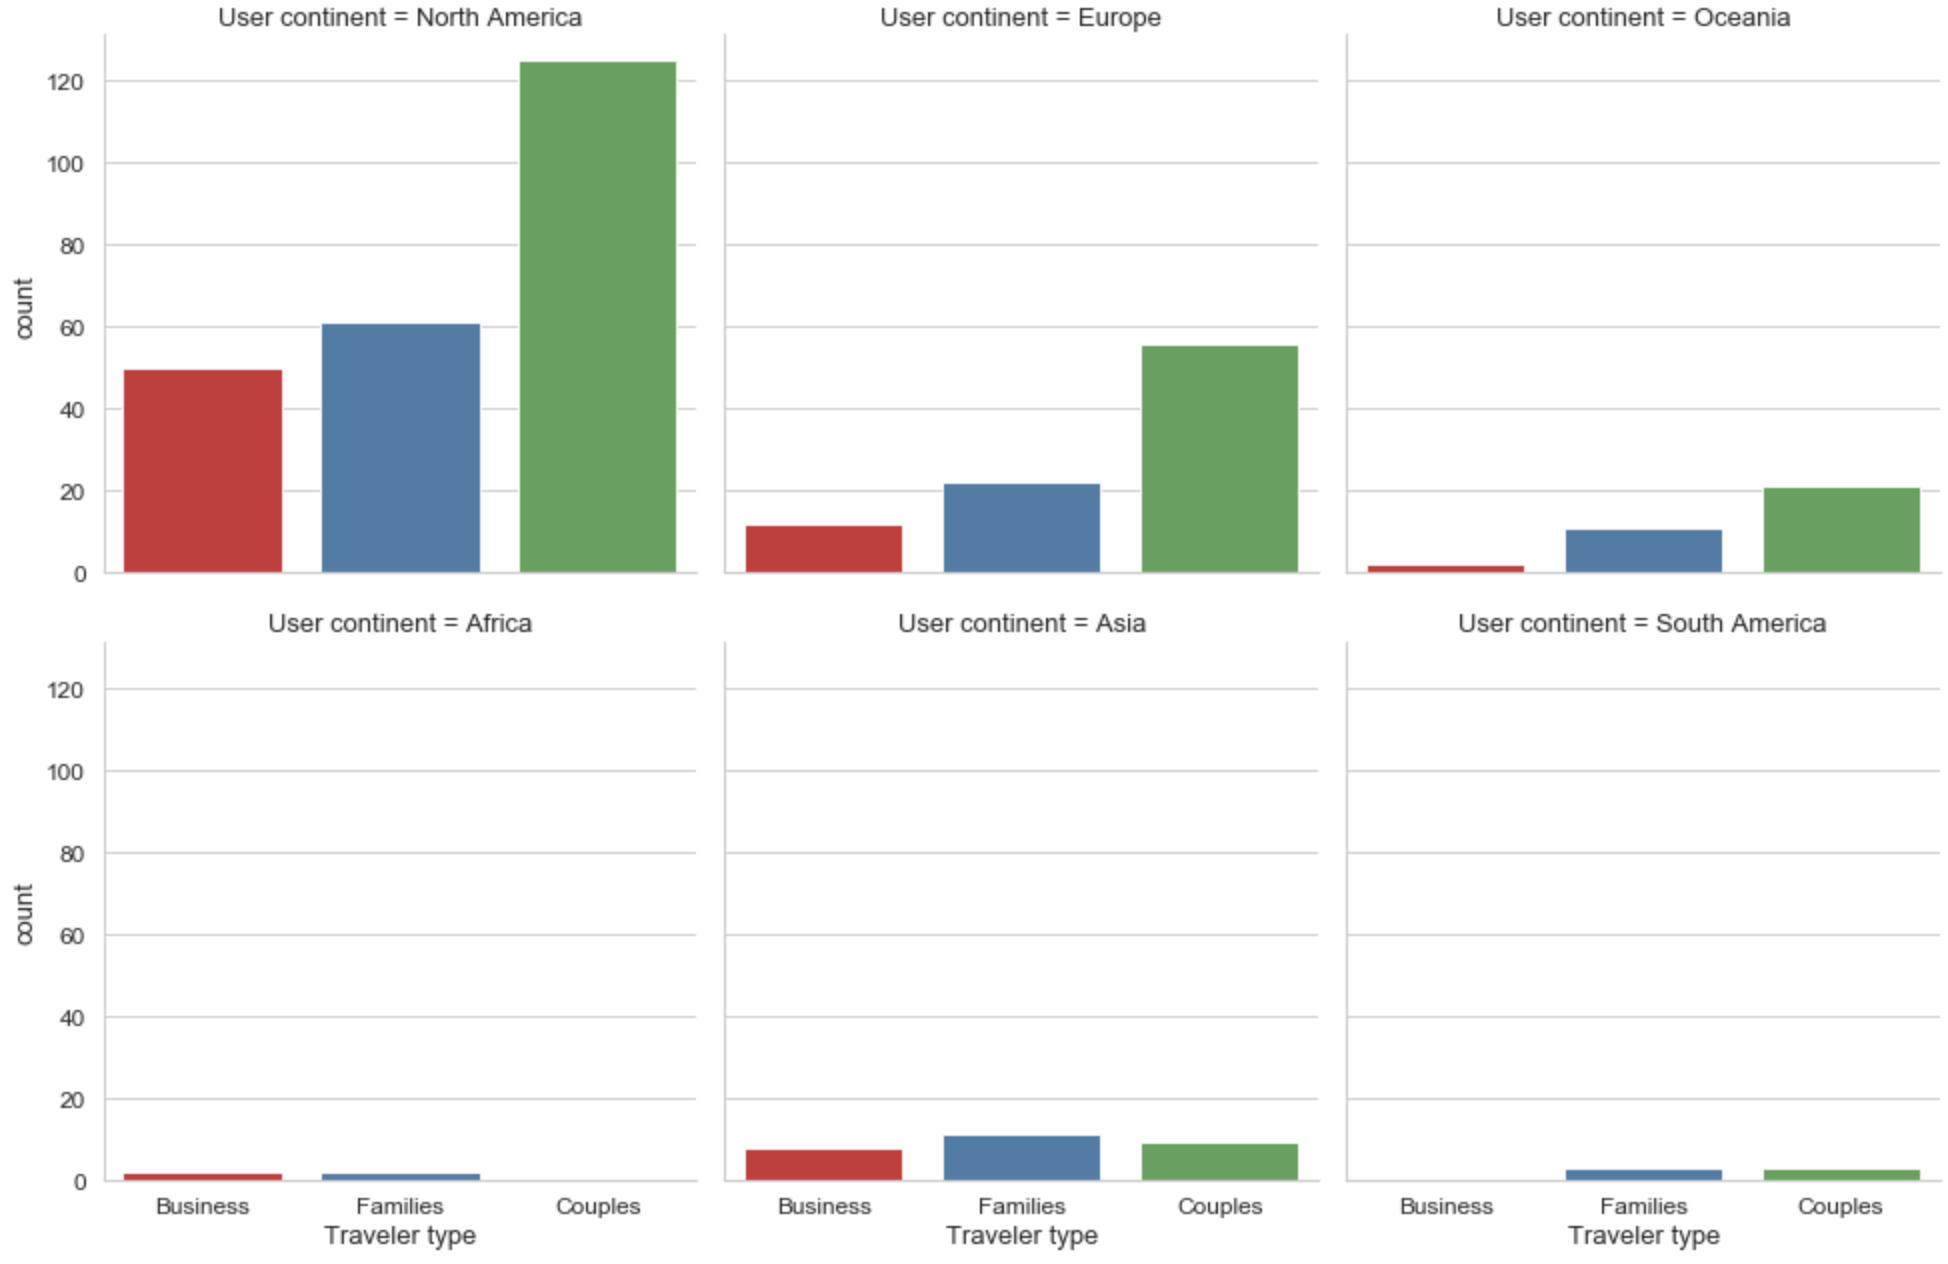
Un dernier aperçu
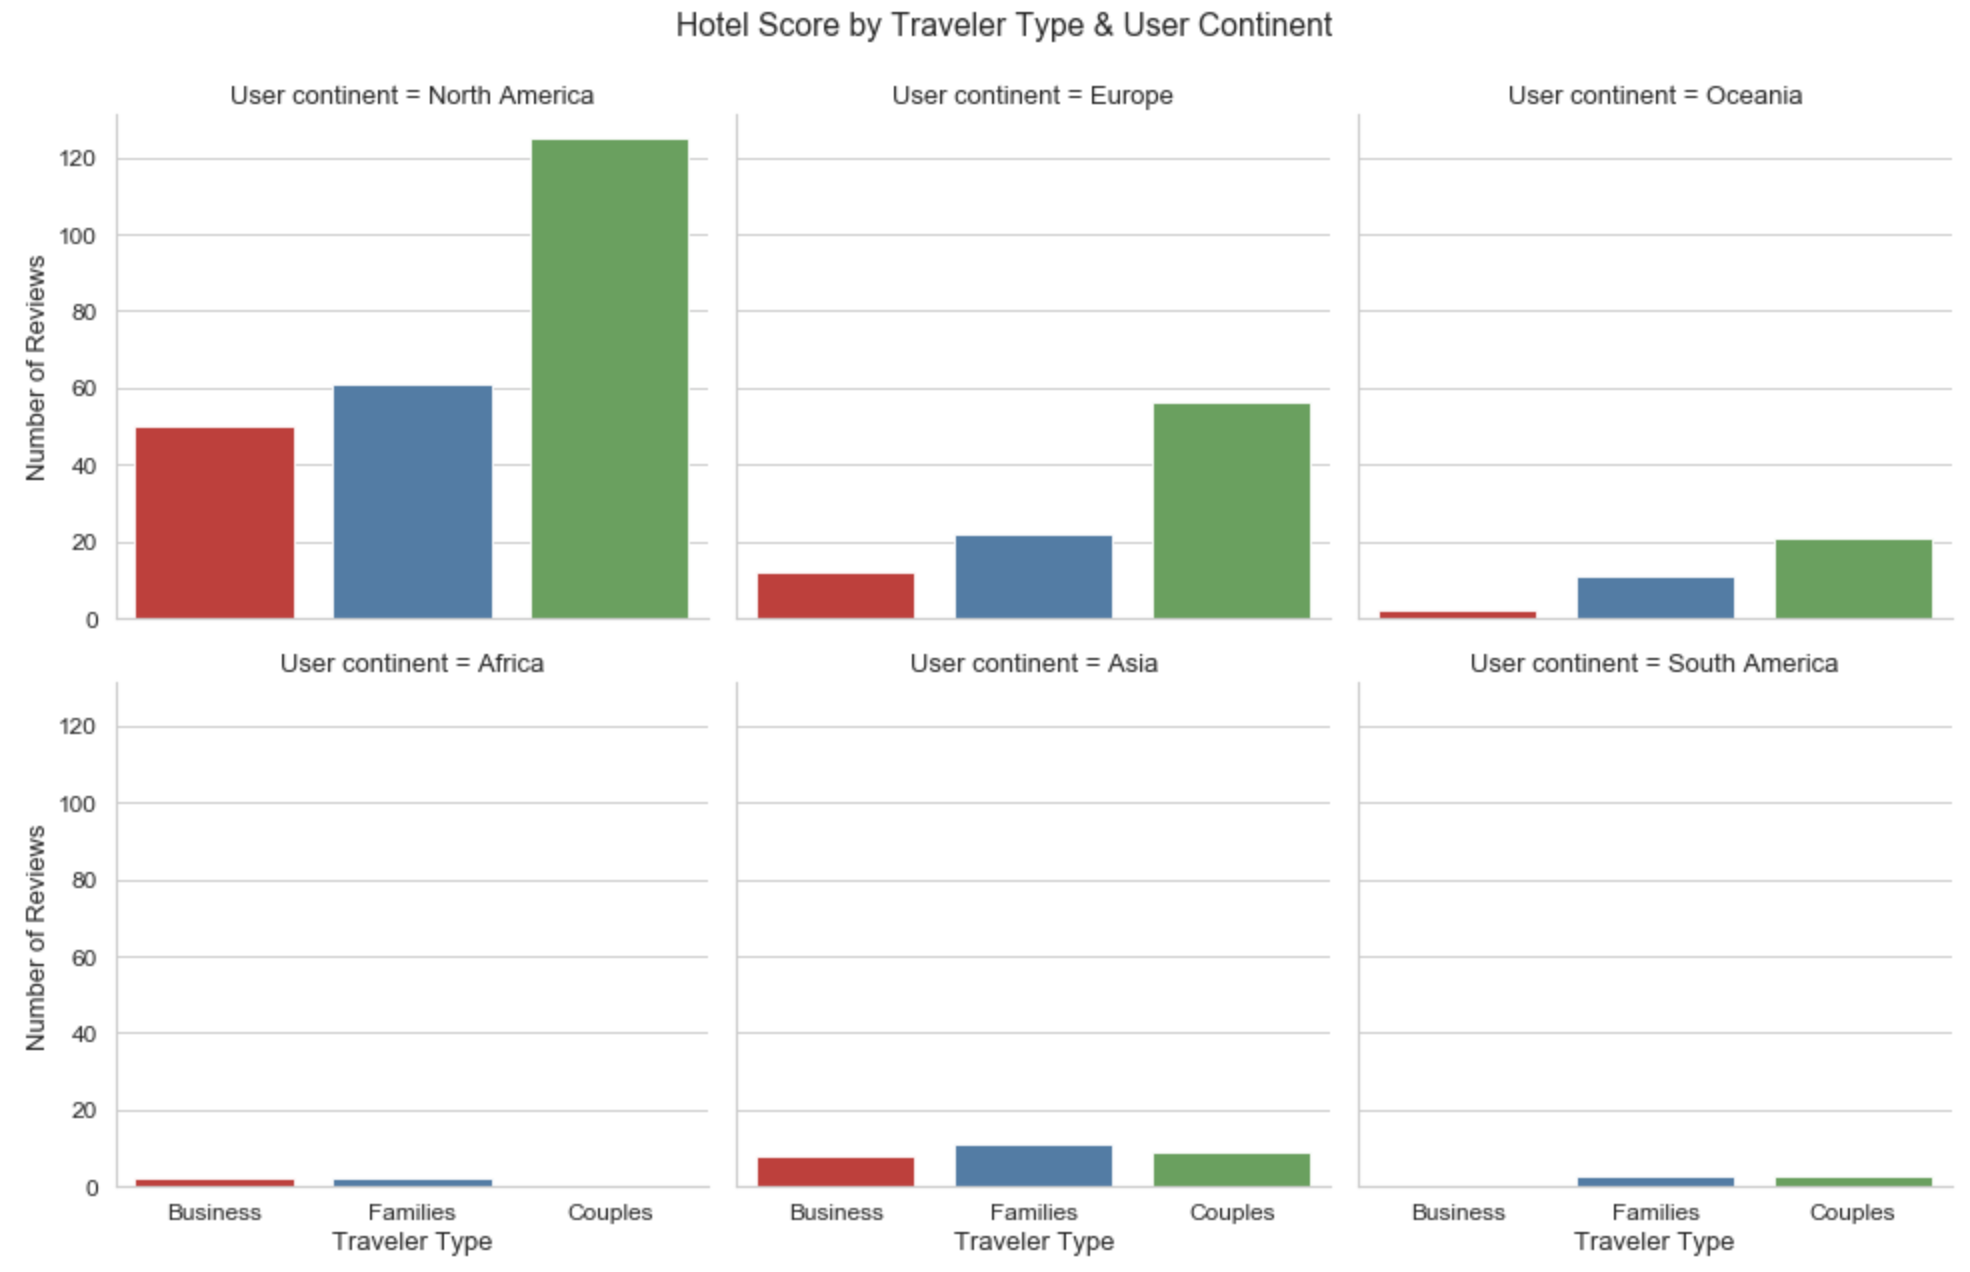
Résultat final
Utilisation de données catégorielles dans Python
Kasey Jones
Research Data Scientist

