Histogrammes
Introduction à Python pour la finance

Adina Howe
Professor
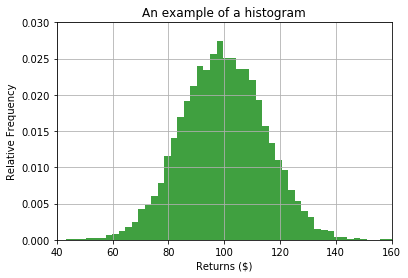
Pourquoi des histogrammes en finance ?
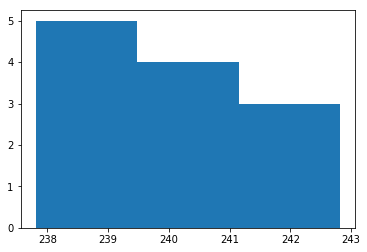
Histogrammes et matplotlib.pyplot
import matplotlib.pyplot as plt
plt.hist(x=prices, bins=3)
plt.show()
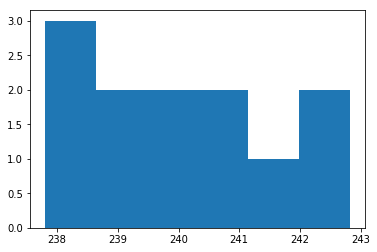
Modifier le nombre de classes
import matplotlib.pyplot as plt
plt.hist(prices, bins=6)
plt.show()
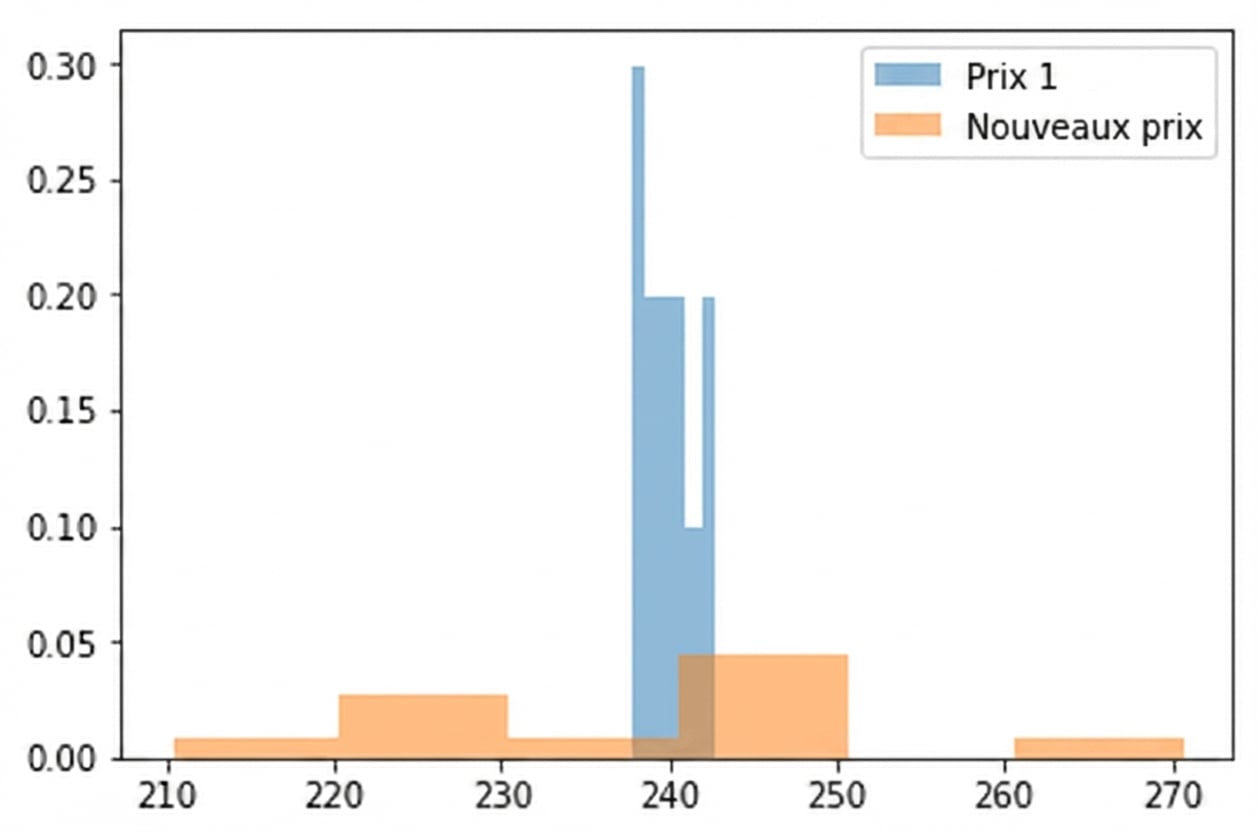
Normaliser l’histogramme
import matplotlib.pyplot as plt
plt.hist(prices, bins=6, density=True)
plt.show()
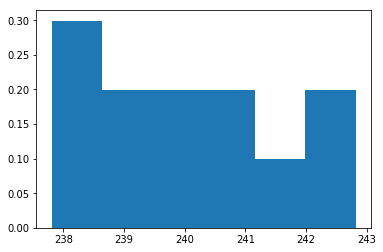
Résultat de l’histogramme
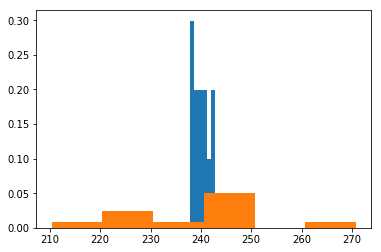
Résultat de l’histogramme
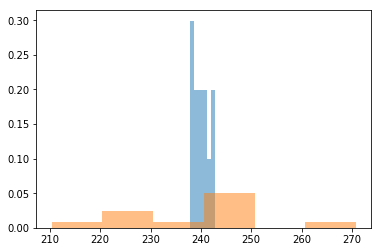
Résultat de l’histogramme