Distributions continues
Introduction aux statistiques

George Boorman
Curriculum Manager, DataCamp
En attente du bus
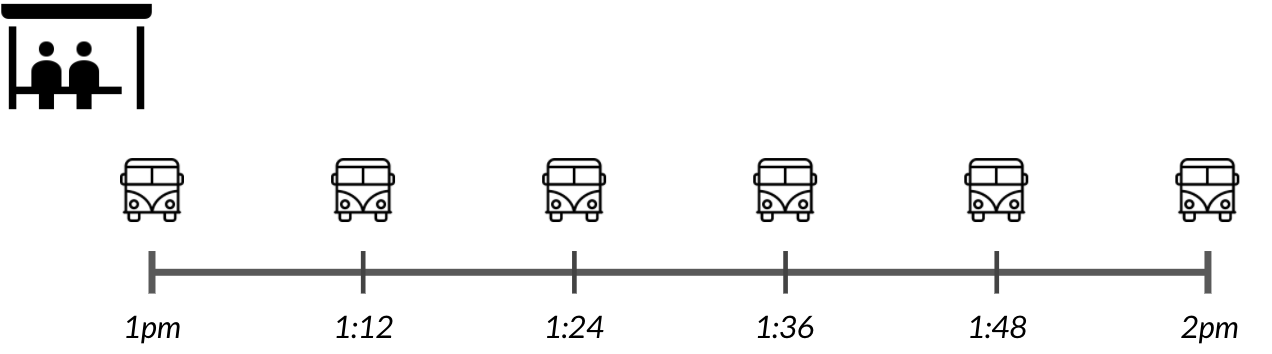
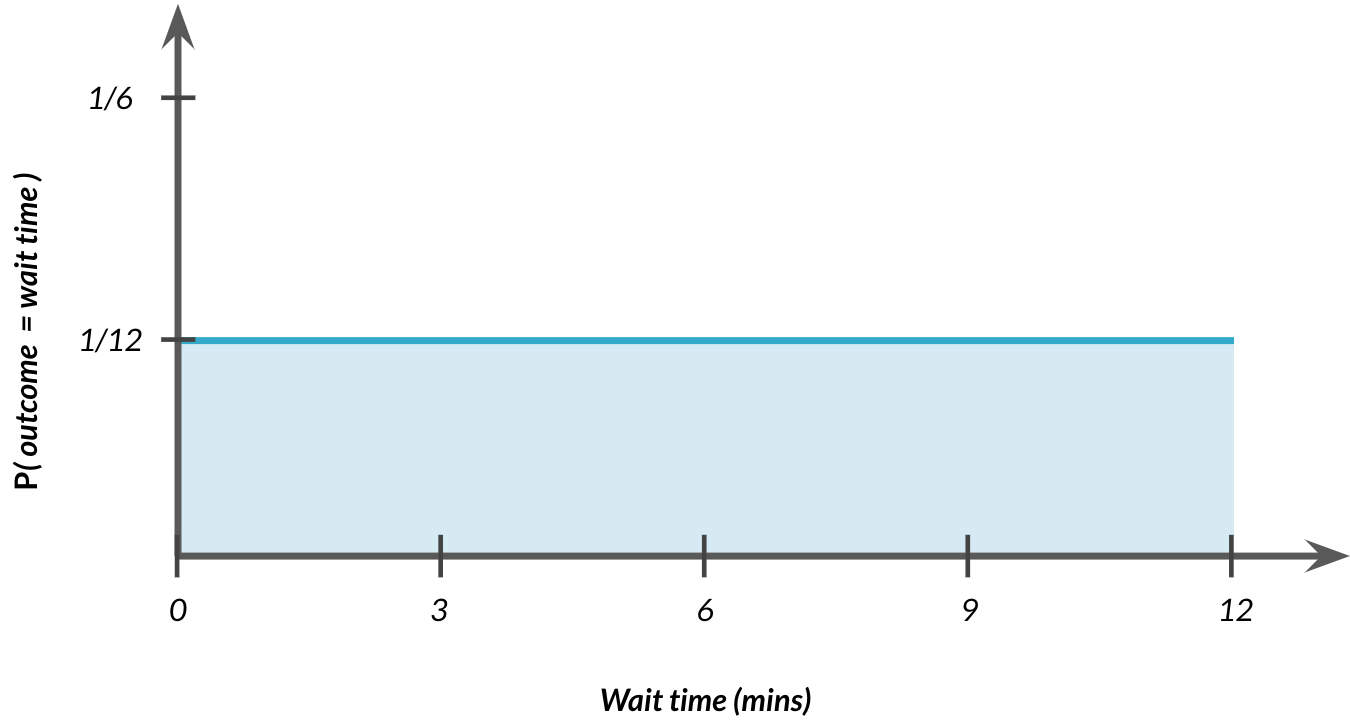
Distribution uniforme continue
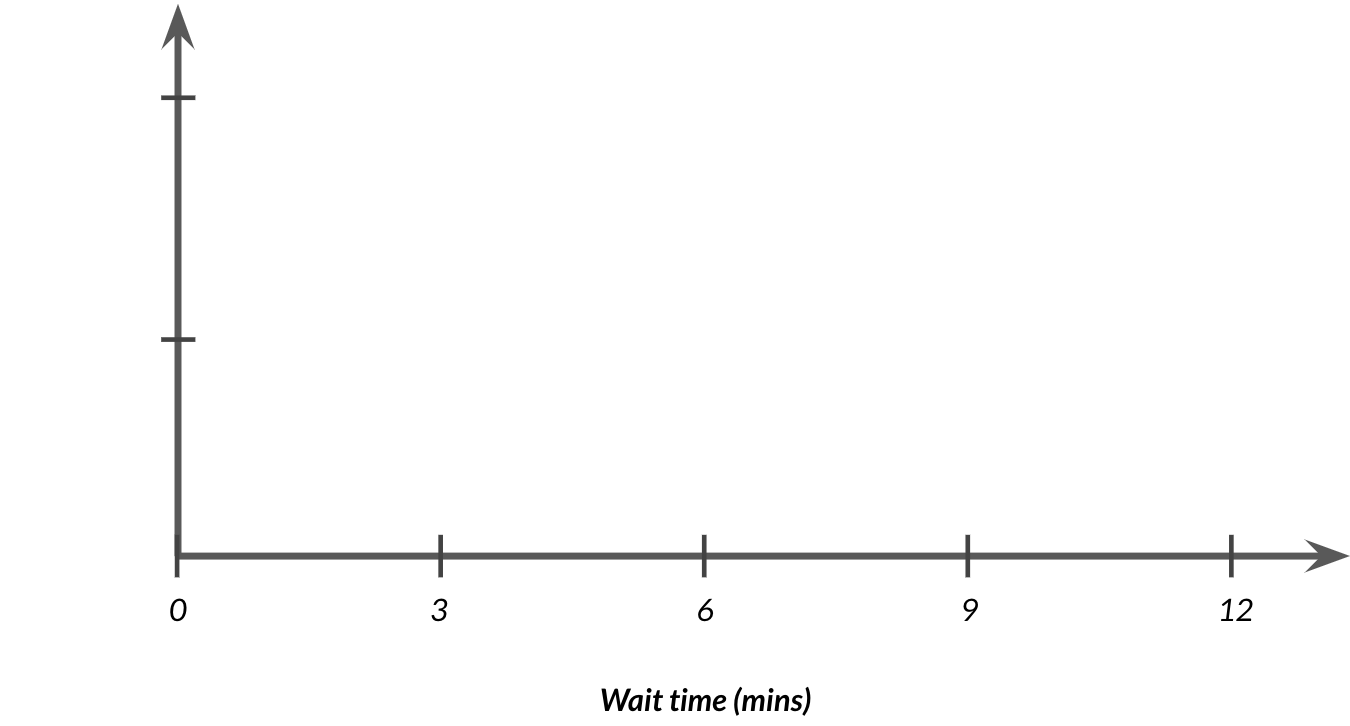
Distribution uniforme continue
Probabilité toujours égale à l’aire
$$P(4 \le \text{wait time} \le 7) = ~~ ?$$
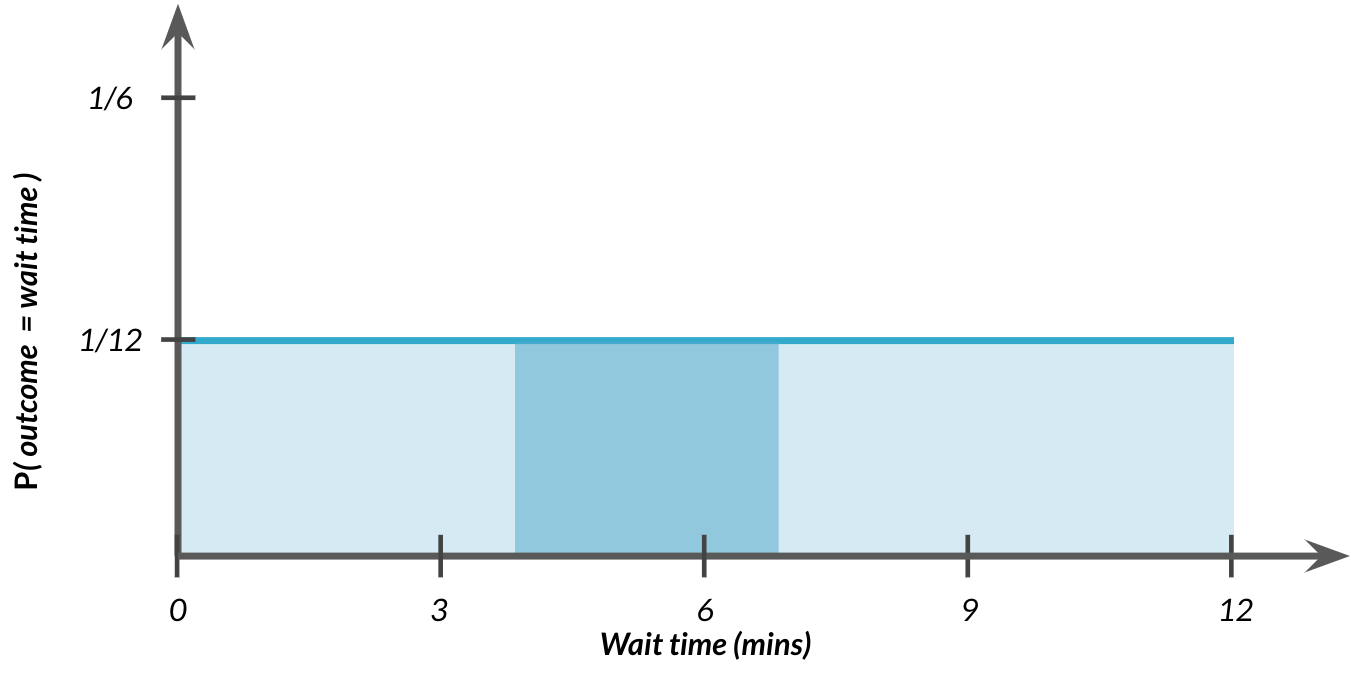
Probabilité toujours égale à l’aire
$$P(4 \le \text{wait time} \le 7) = ~~ ?$$
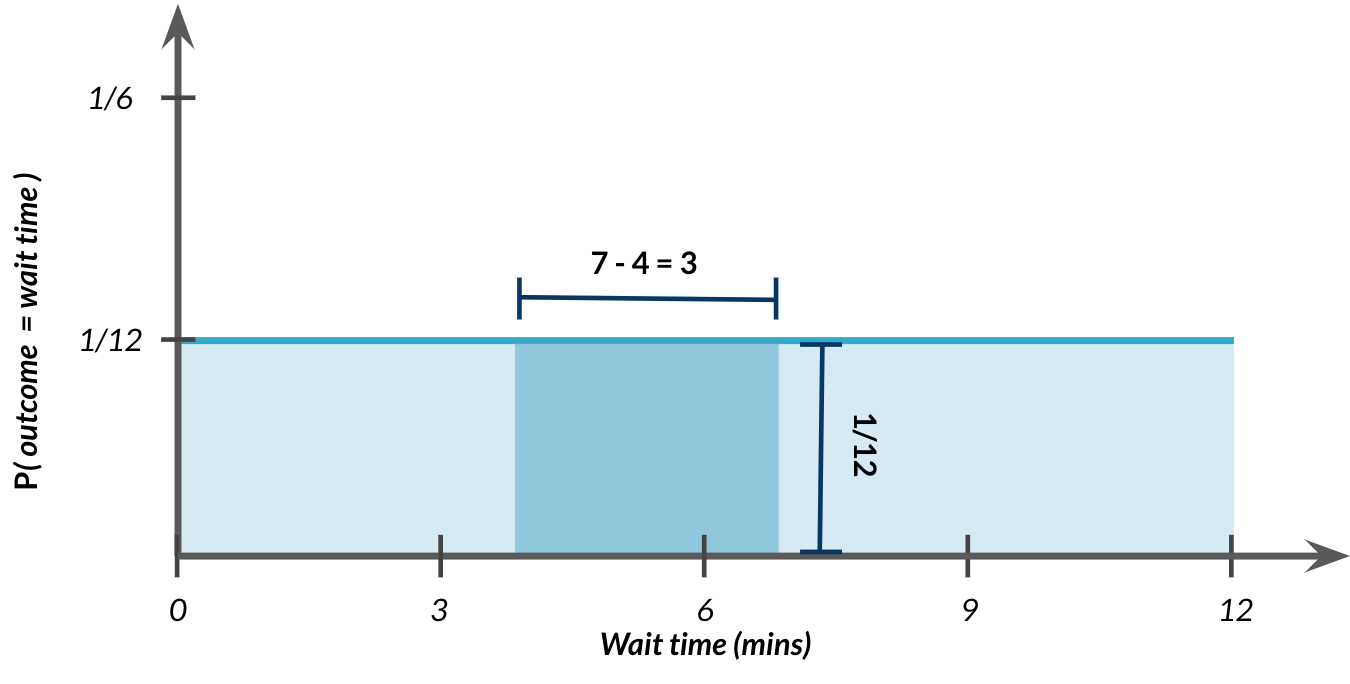
Probabilité toujours égale à l’aire
$$P(4 \le \text{wait time} \le 7) = 3 \times 1/12 = 3/12$$
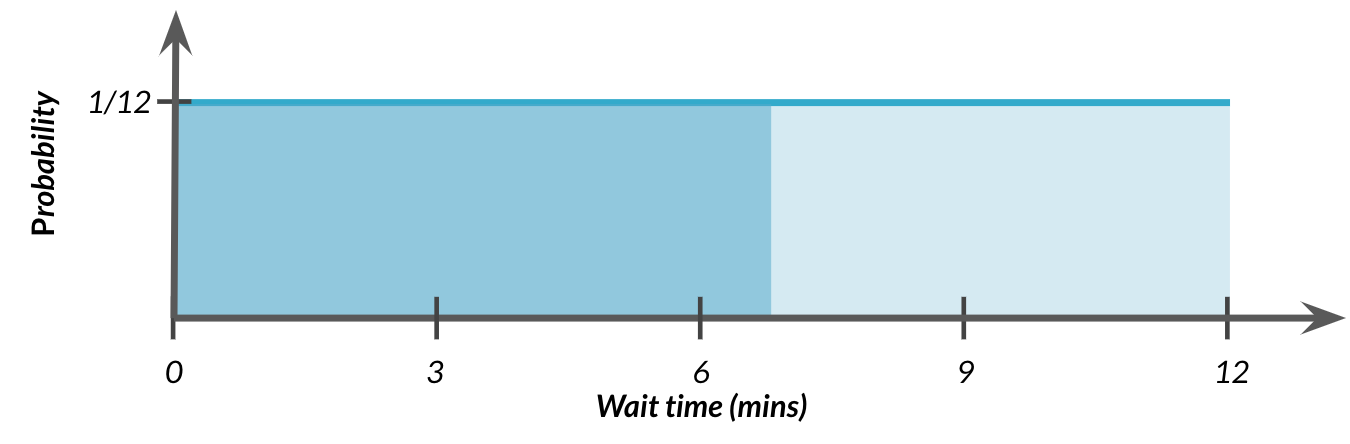
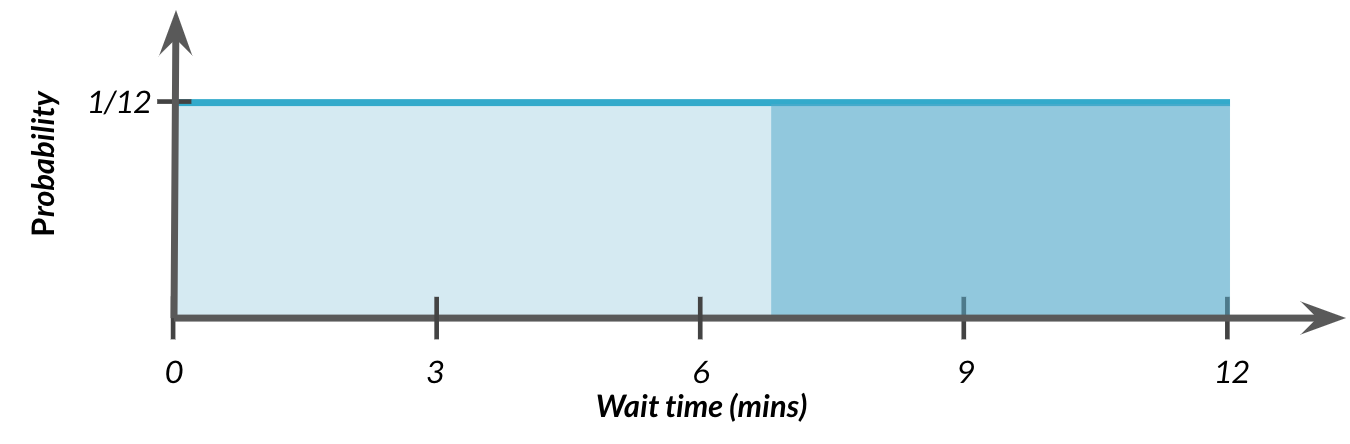
Attendre sept minutes ou moins
$$ P(\text{wait time} \le 7) = ~~ ?$$
$$ P(\text{wait time} \le 7) = \frac{7-0}{12} $$
$$ P(\text{wait time} \le 7) = \frac{7}{12} = 58.33% $$
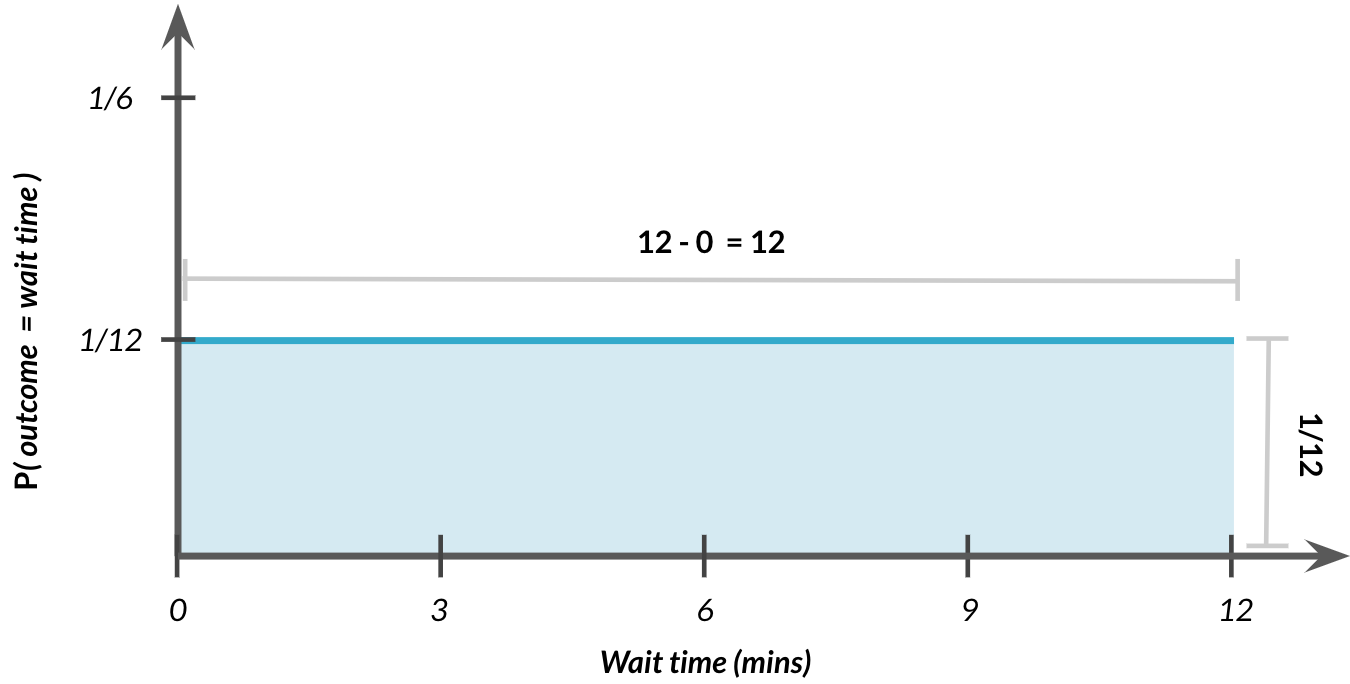
Aire totale = 1
$$P(0 \le \text{wait time} \le 12) = ~~ ?$$
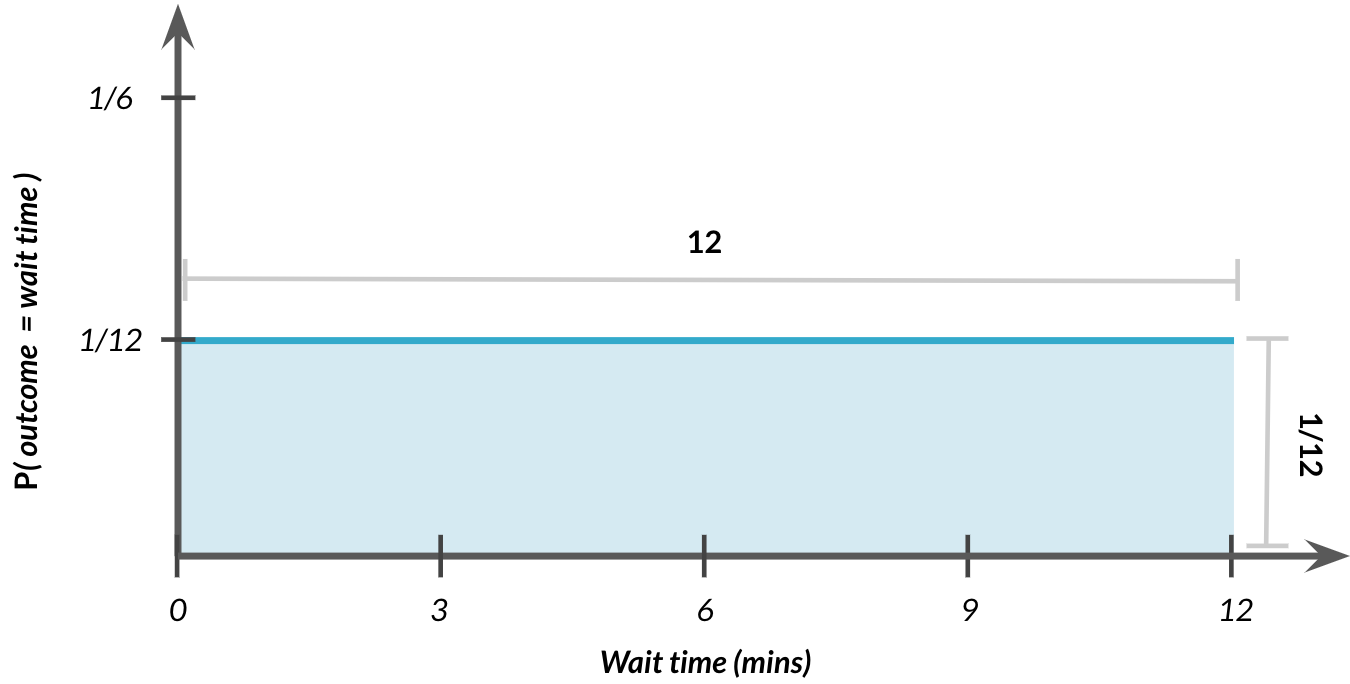
Aire totale = 1
$$P(0 \le \text{outcome} \le 12) = 12 \times 1/12 = 1$$
Probabilité d'attendre plus de sept minutes
$$ P(\text{wait time} \ge 7) = 1 - \frac{7}{12} $$
$$ P(\text{wait time} \ge 7) = \frac{5}{12} = 41.67% $$
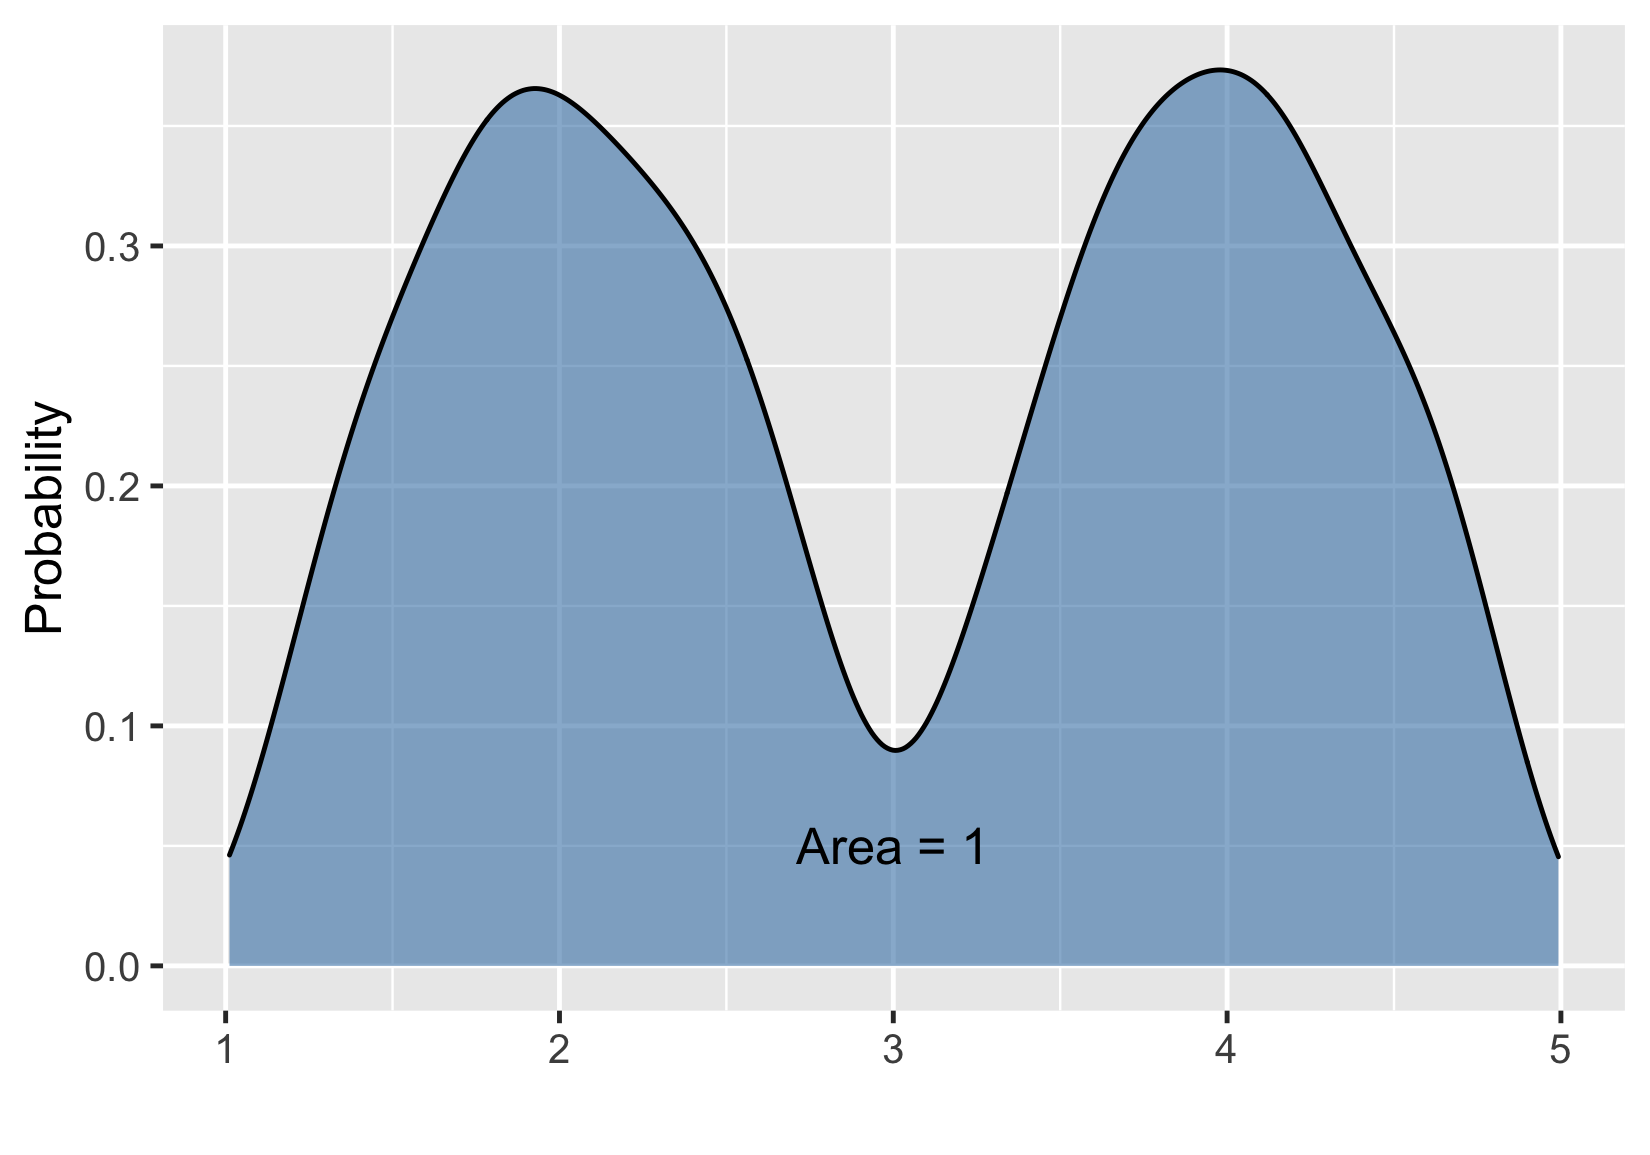
Distribution bimodale
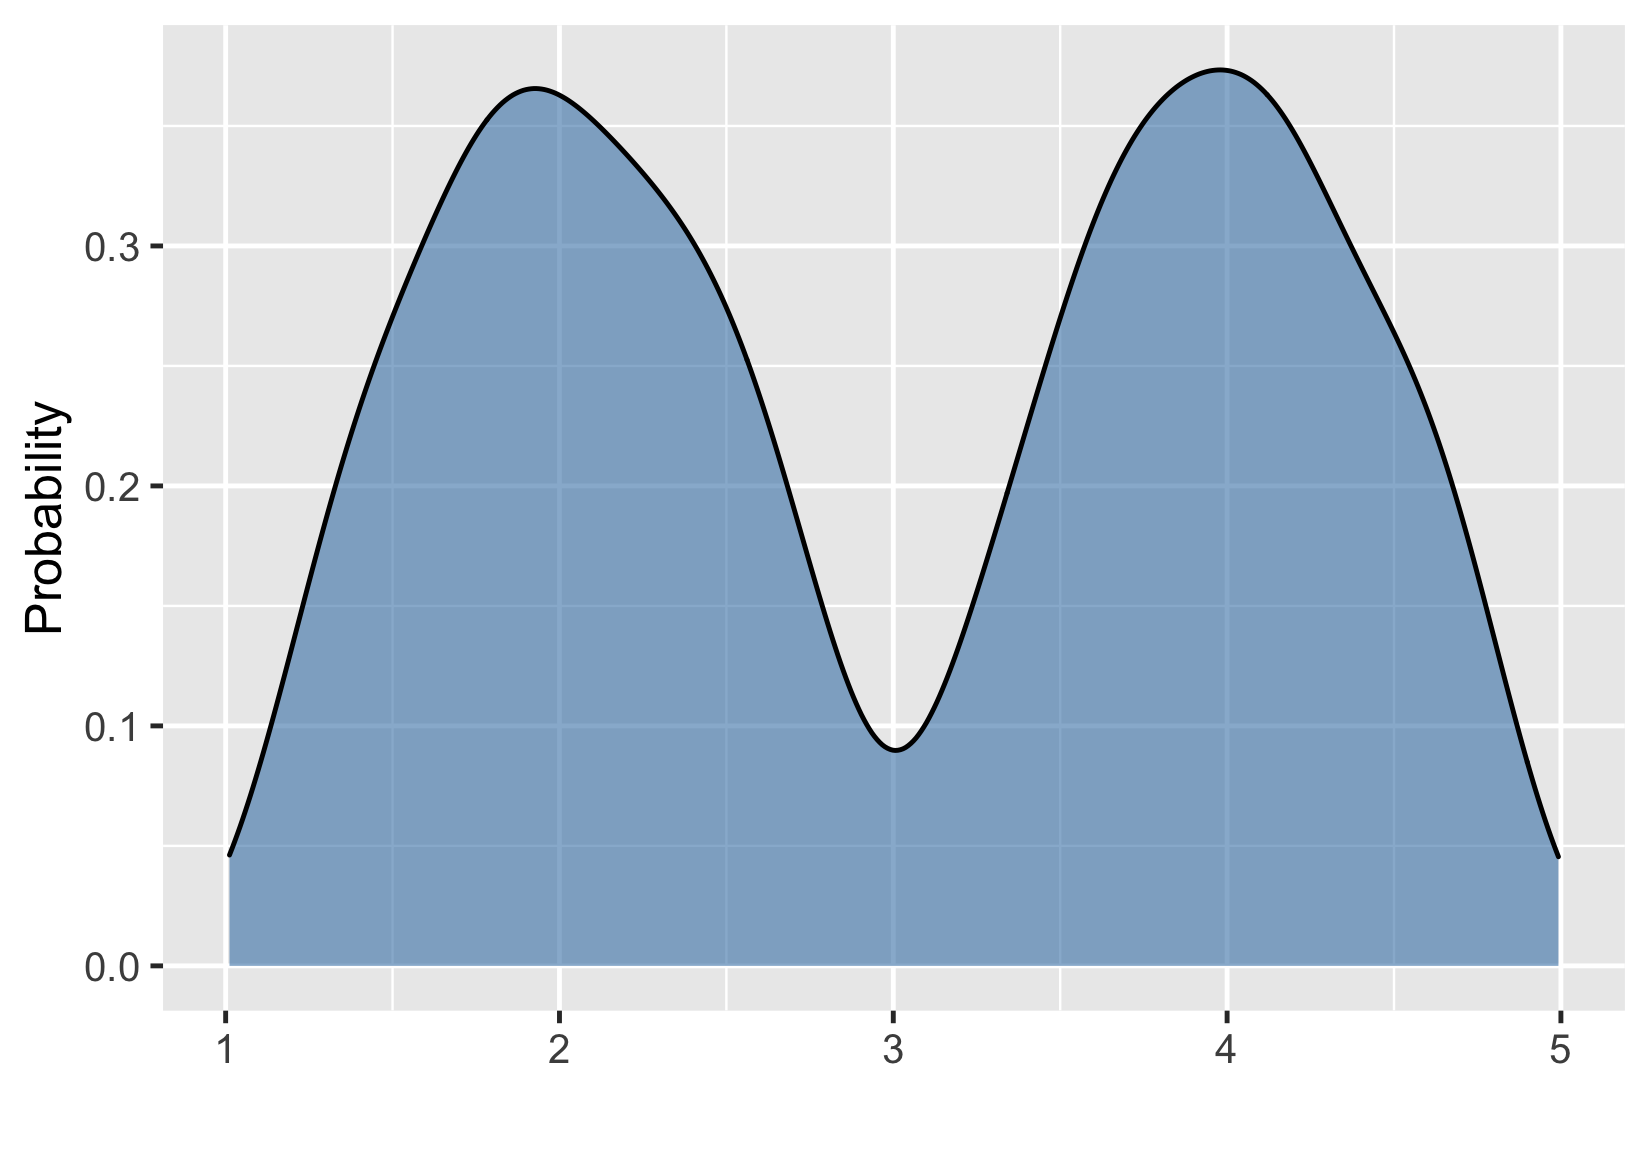
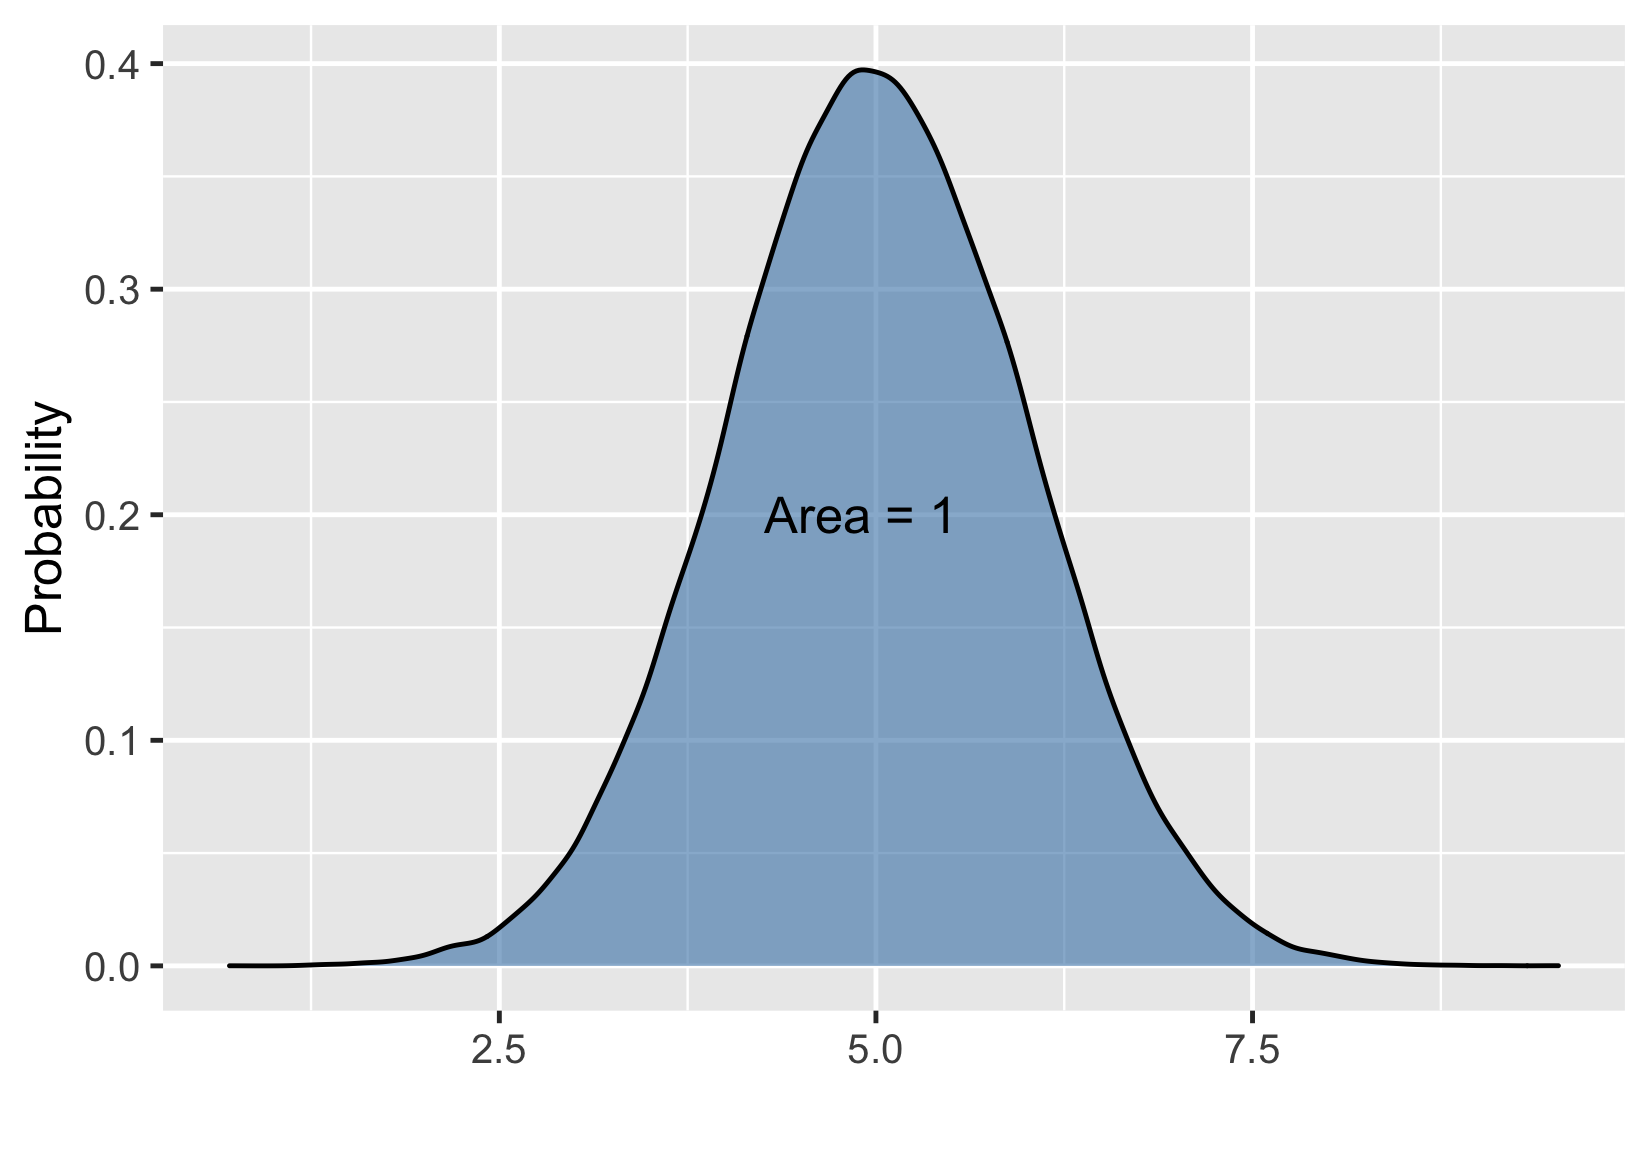
La distribution normale
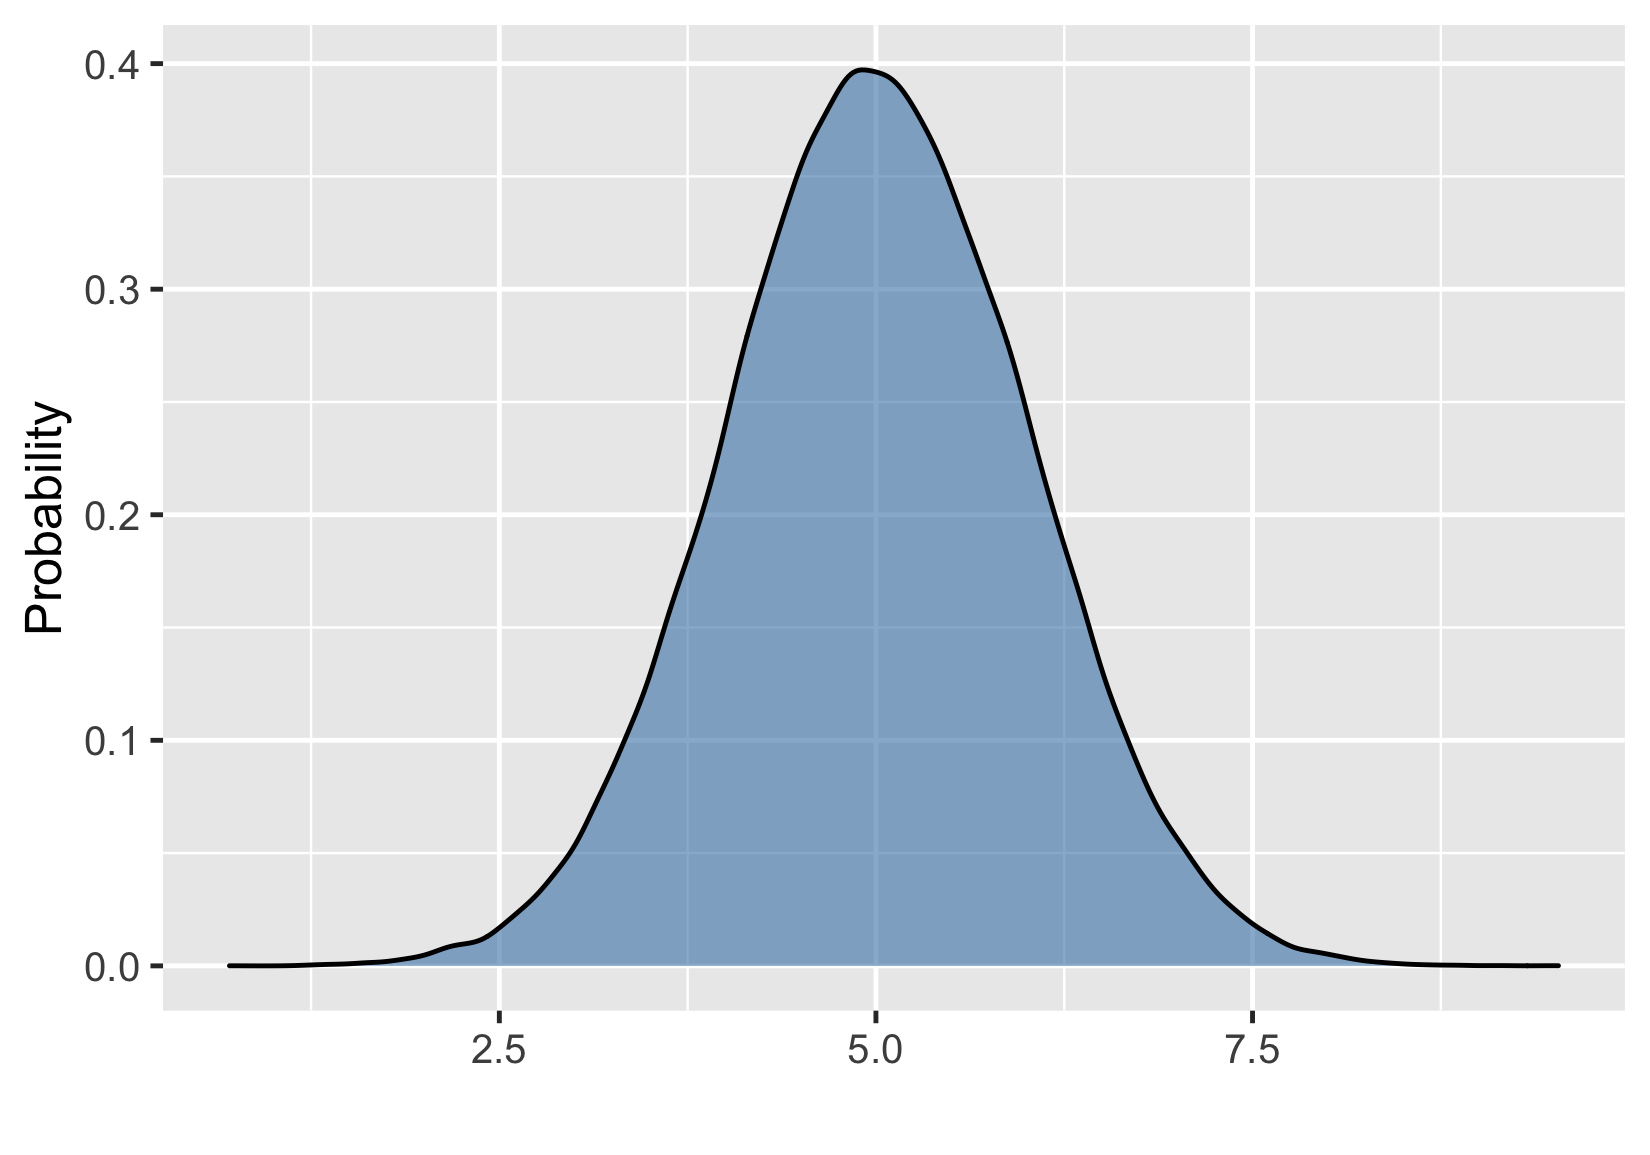
Superficie totale inchangée = 1