Personnalisation
Python intermédiaire

Hugo Bowne-Anderson
Data Scientist at DataCamp
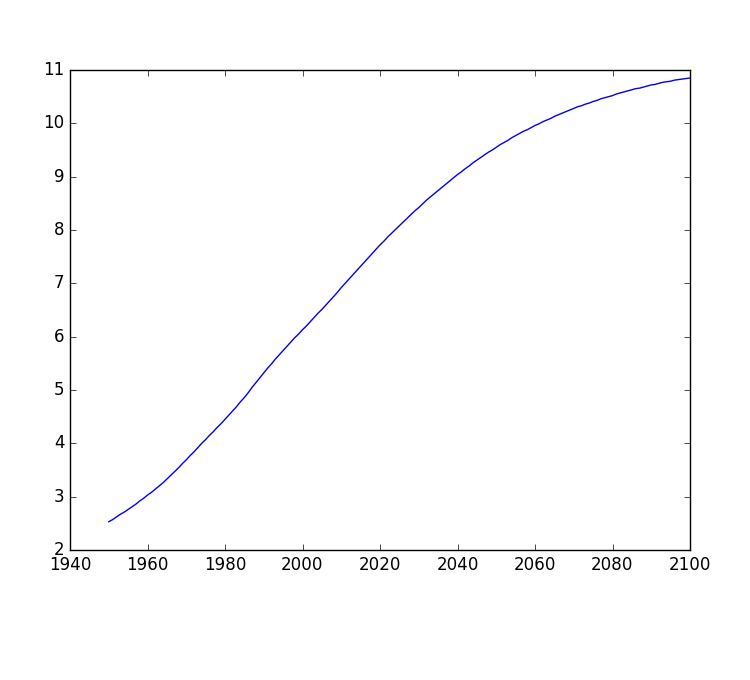
Graphique de base
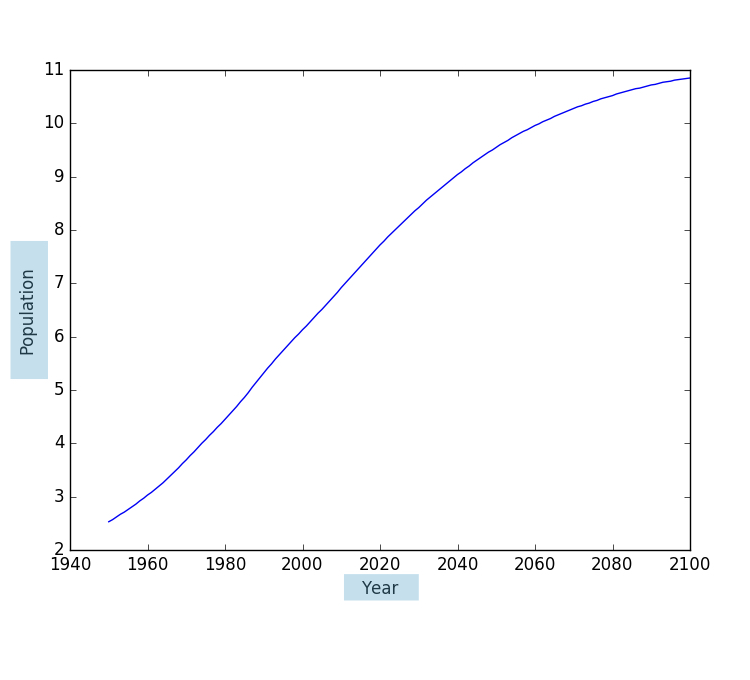
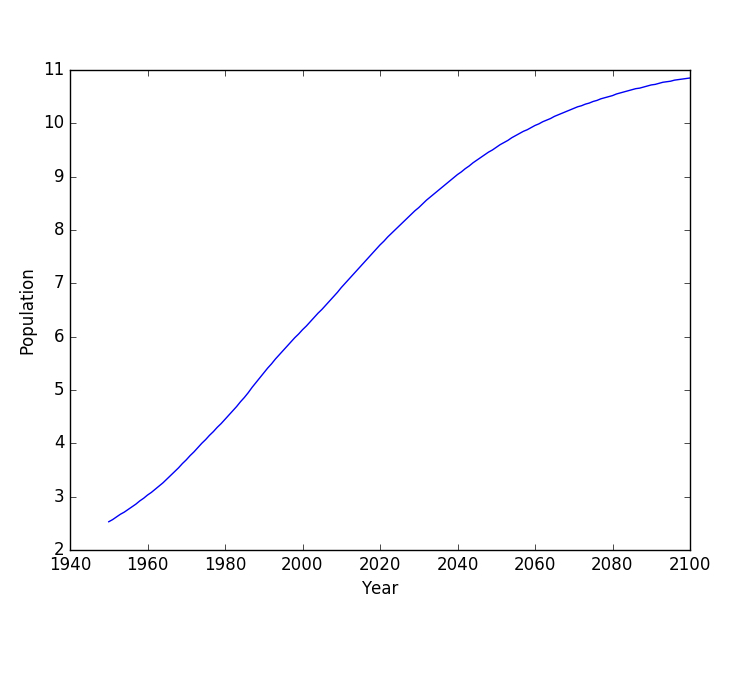
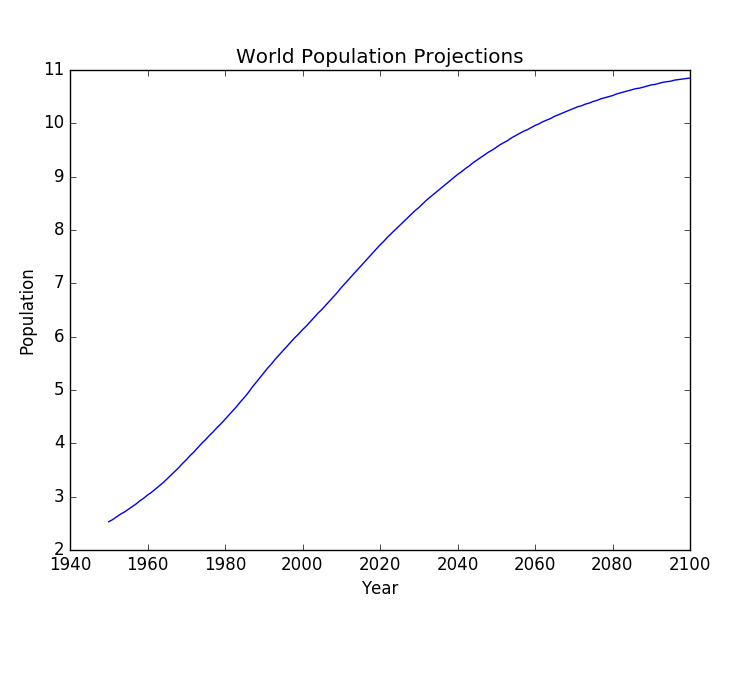
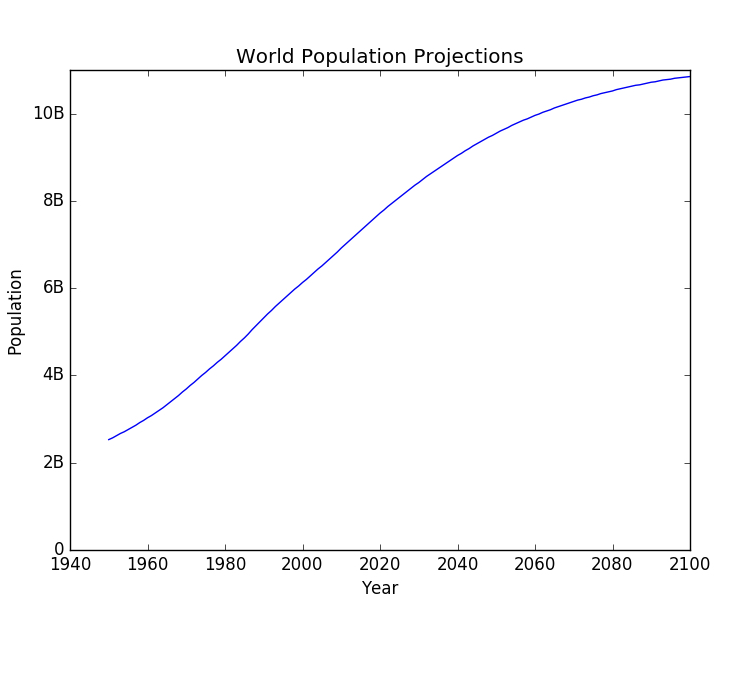
Étiquettes des axes
Étiquettes des axes
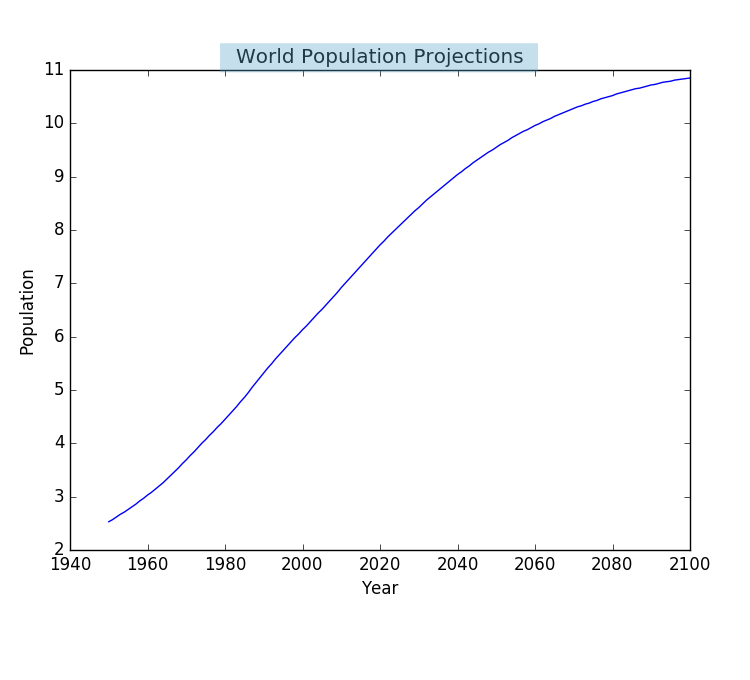
Titre
Titre
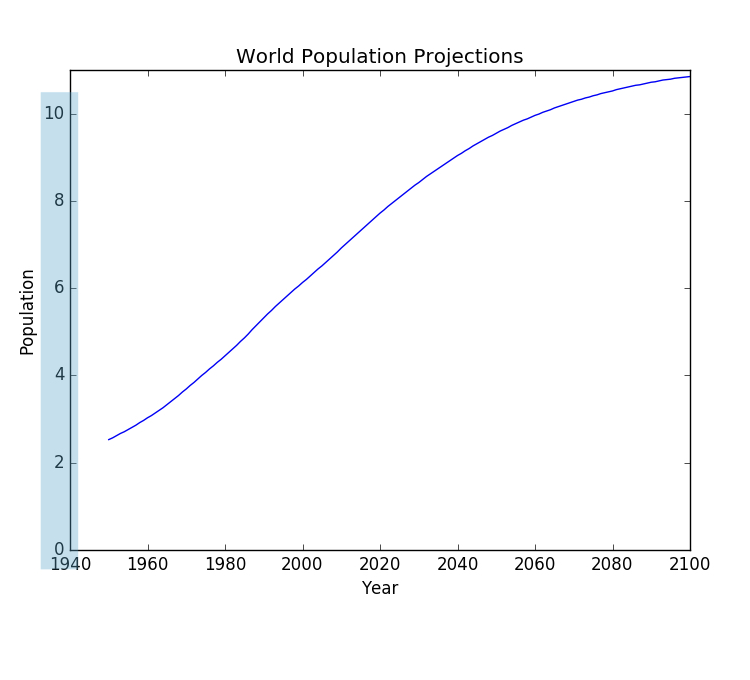
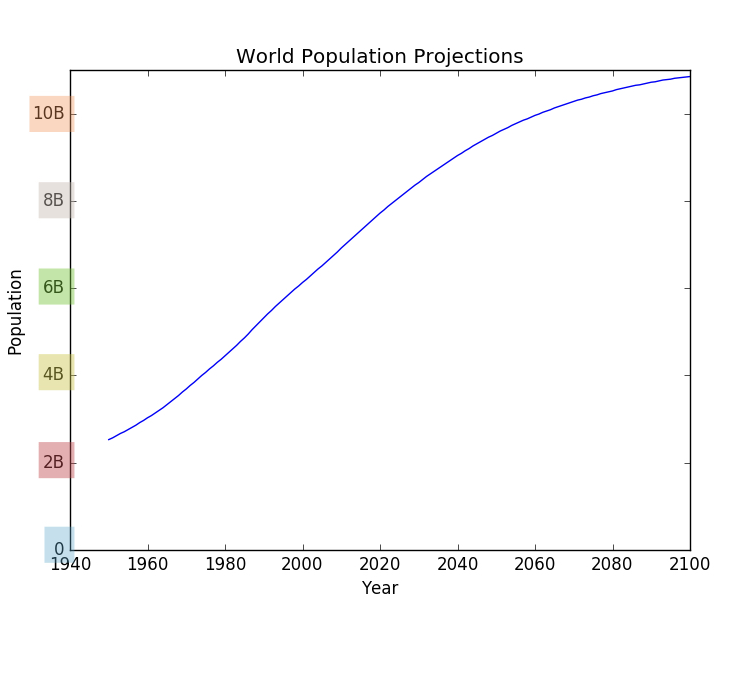
Coches
Coches
Coches (2)
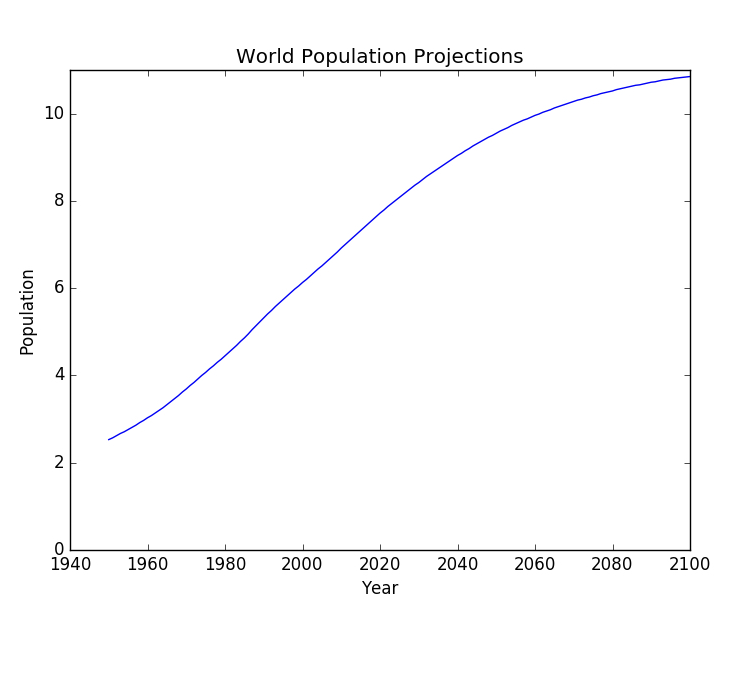
Coches (2)
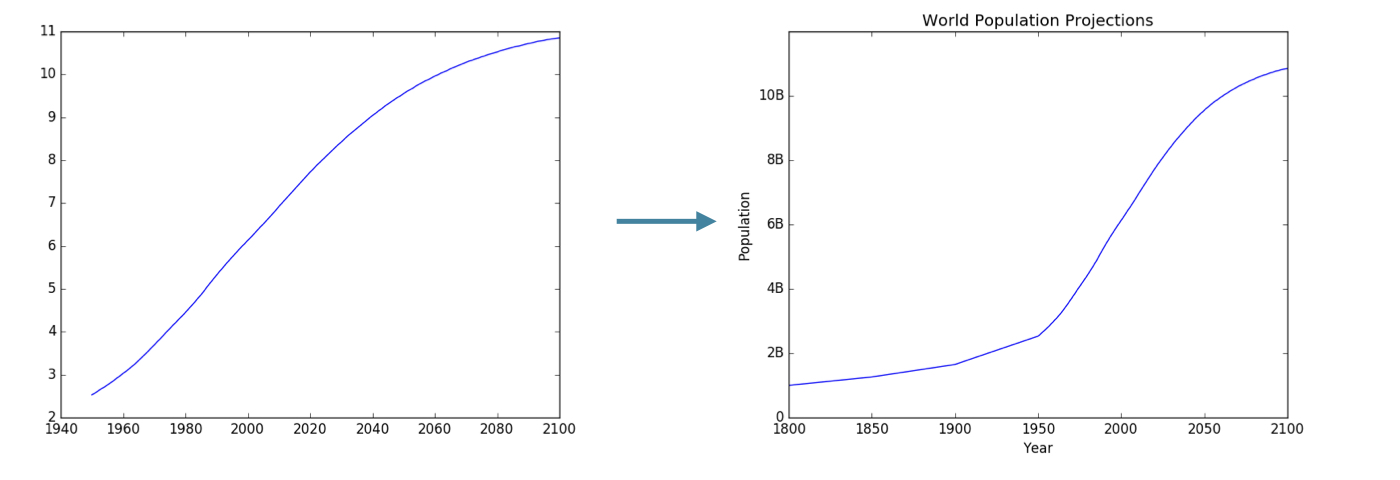
Ajouter des données historiques
Ajouter des données historiques
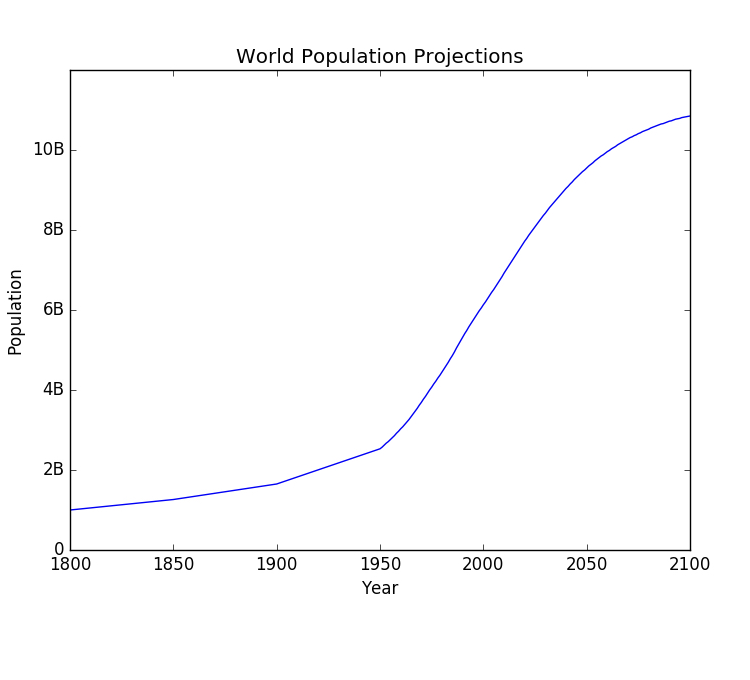
Avant et après