Visualizing data in Excel
Understanding Excel

Jess Ahmet
Curriculum Manager, DataCamp
Data visualization cheat sheet
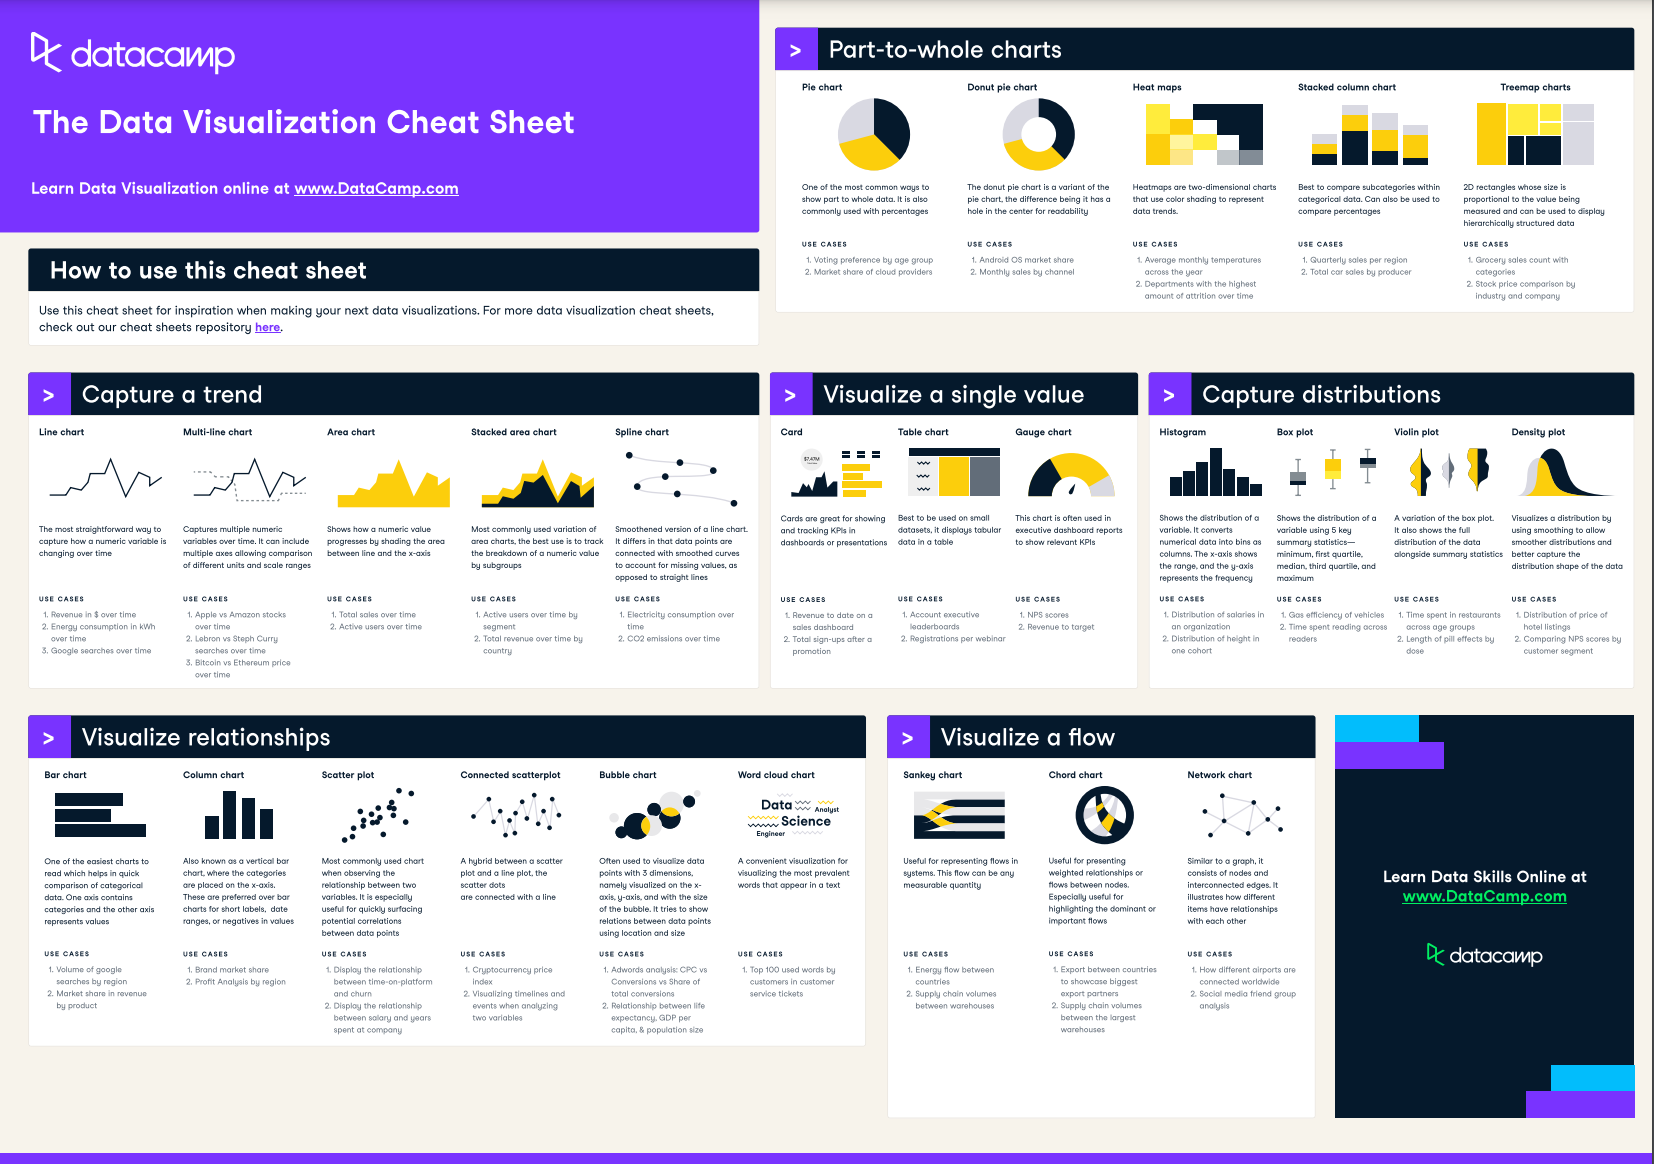
1 https://www.datacamp.com/cheat-sheet/data-viz-cheat-sheet
What is data visualization?

Excel for data visualization
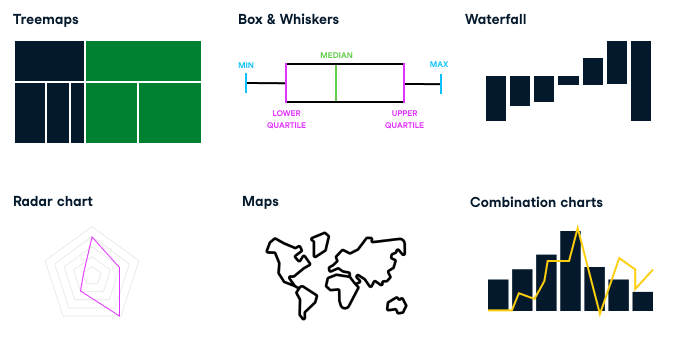
Visualization options
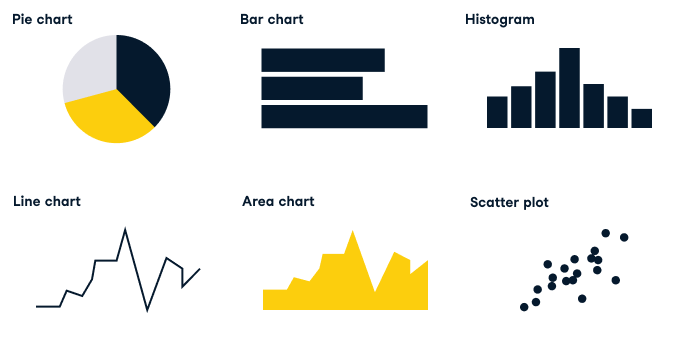
Visualization options