Mises en garde sur les corrélations
Introduction aux statistiques en Python

Maggie Matsui
Content Developer, DataCamp
Relations non linéaires
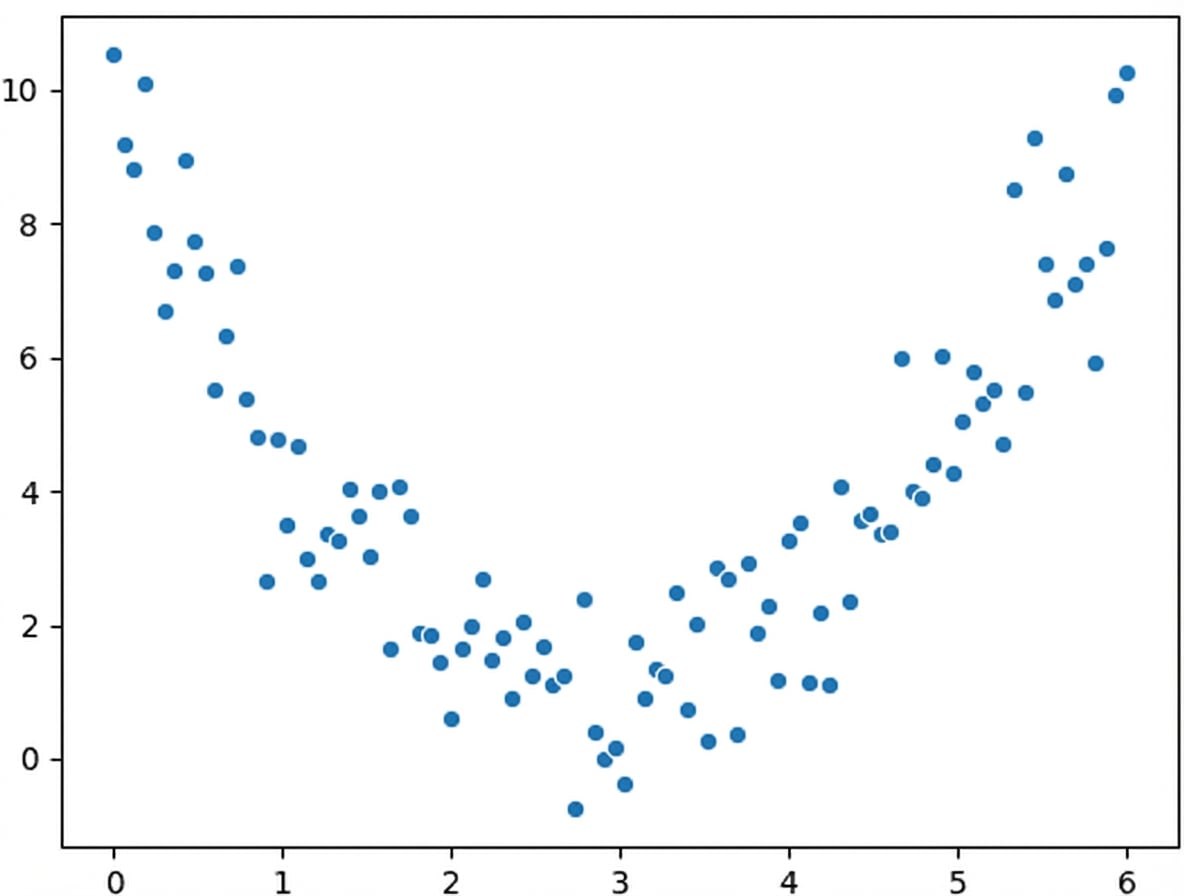
$$r = 0,18$$
Relations non linéaires
Ce que nous voyons :
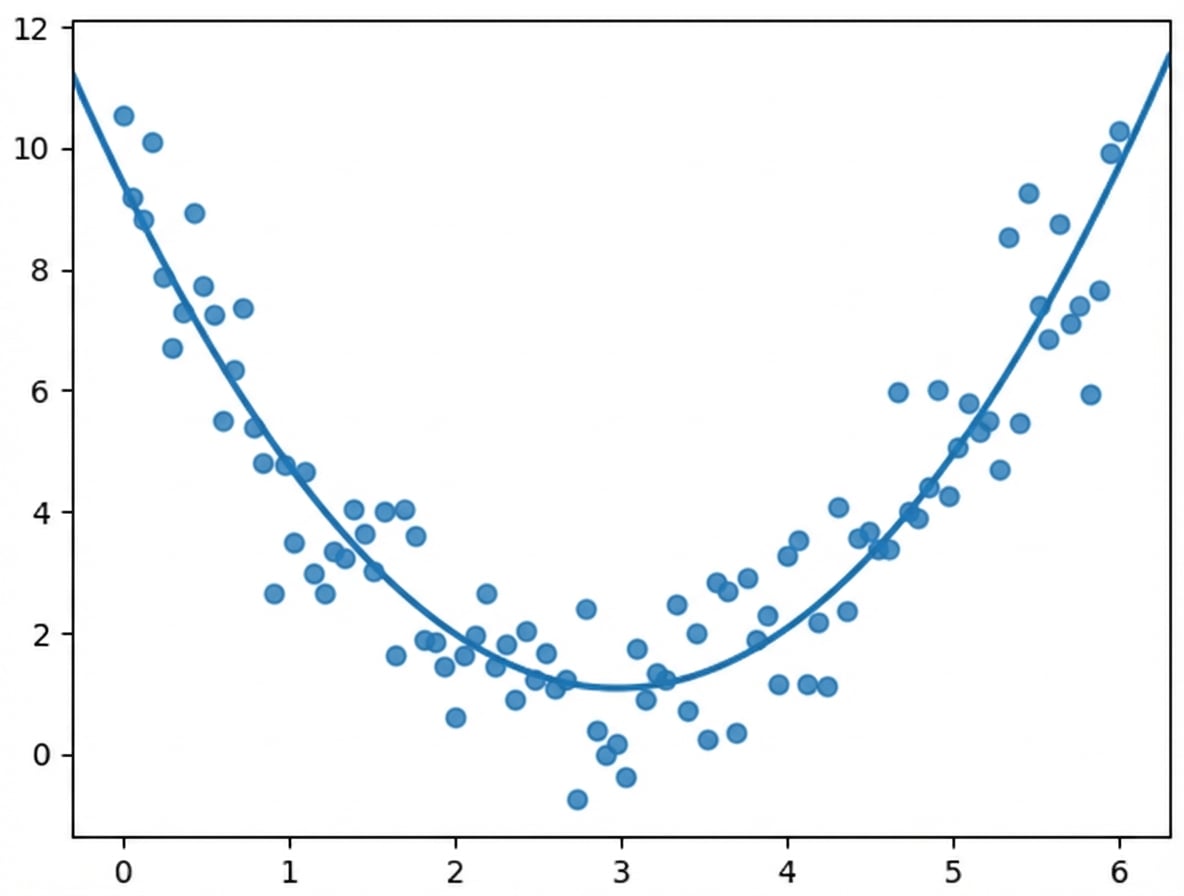
Ce que le coefficient de corrélation voit :
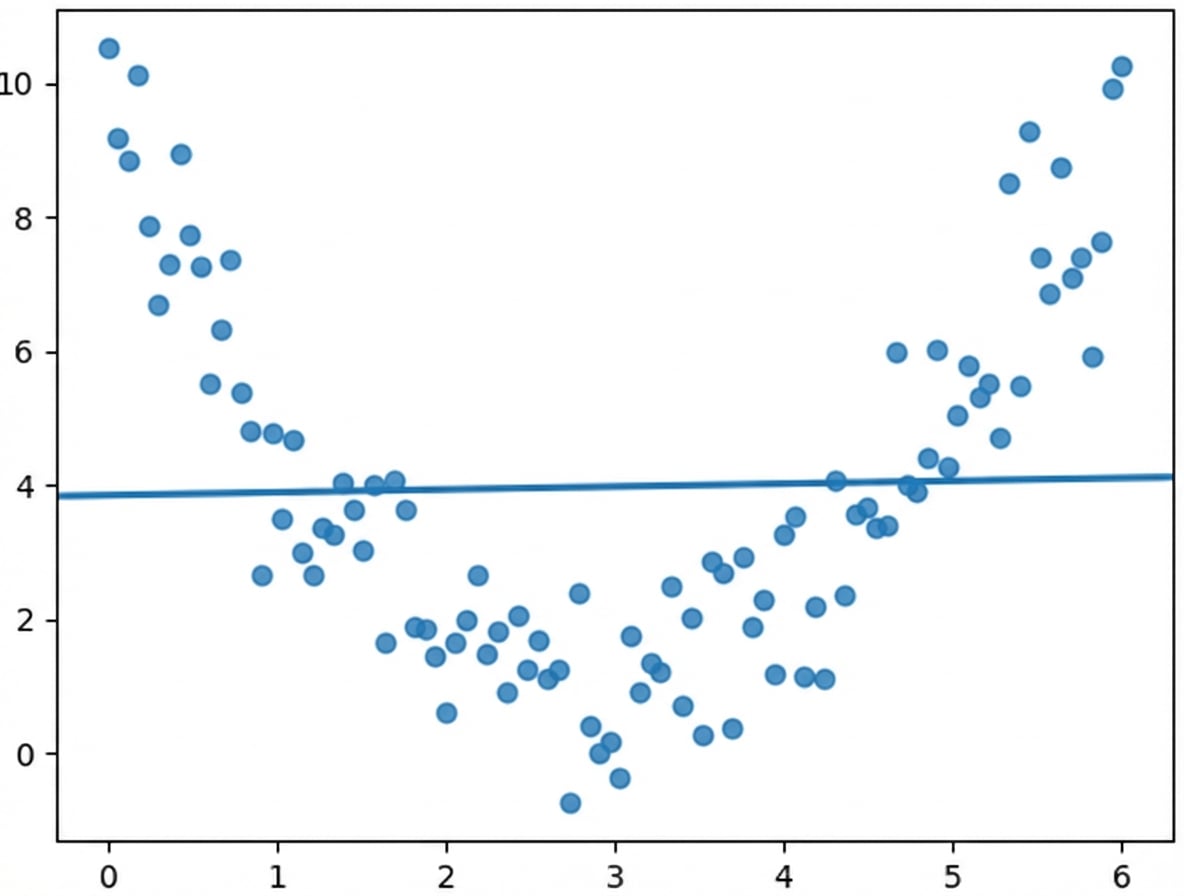
La corrélation ne tient compte que des relations linéaires
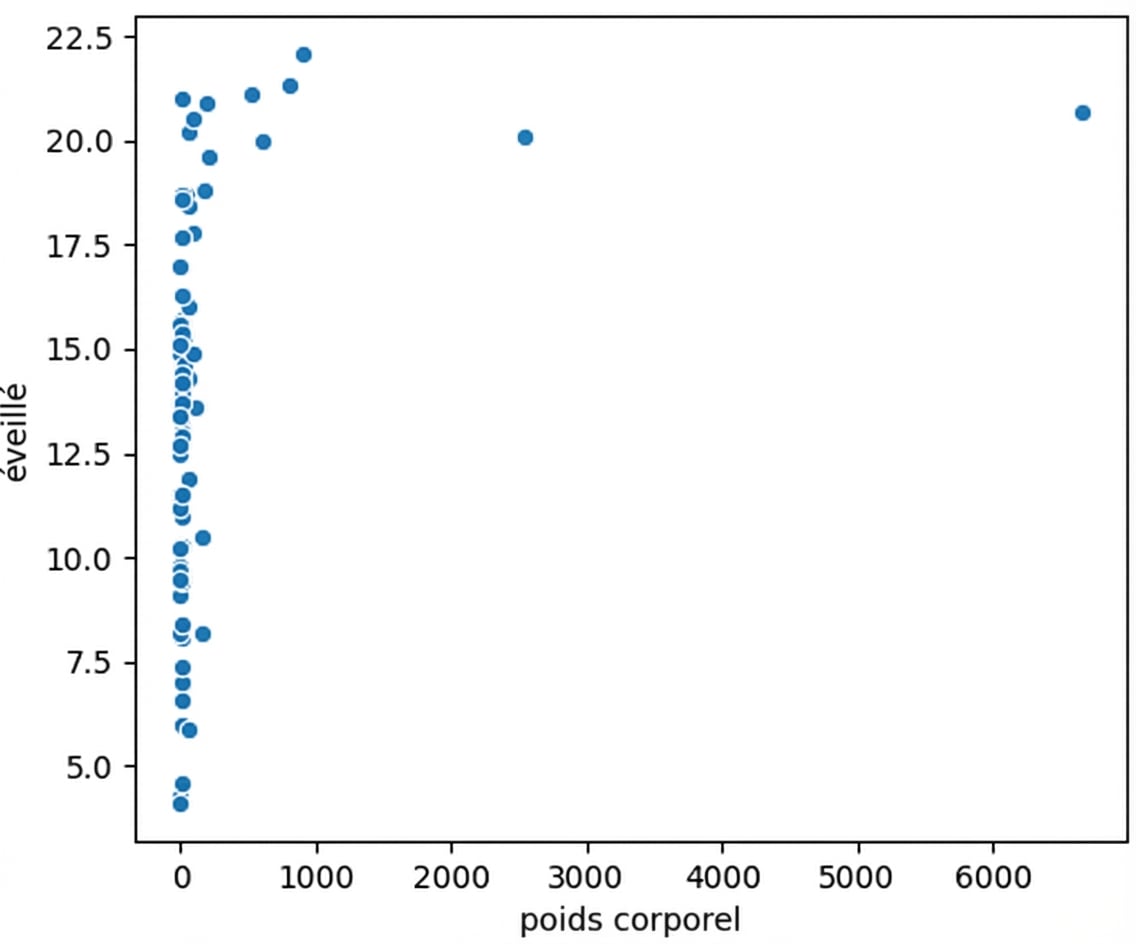
Visualisez toujours vos données
Poids corporel en fonction du temps d’éveil
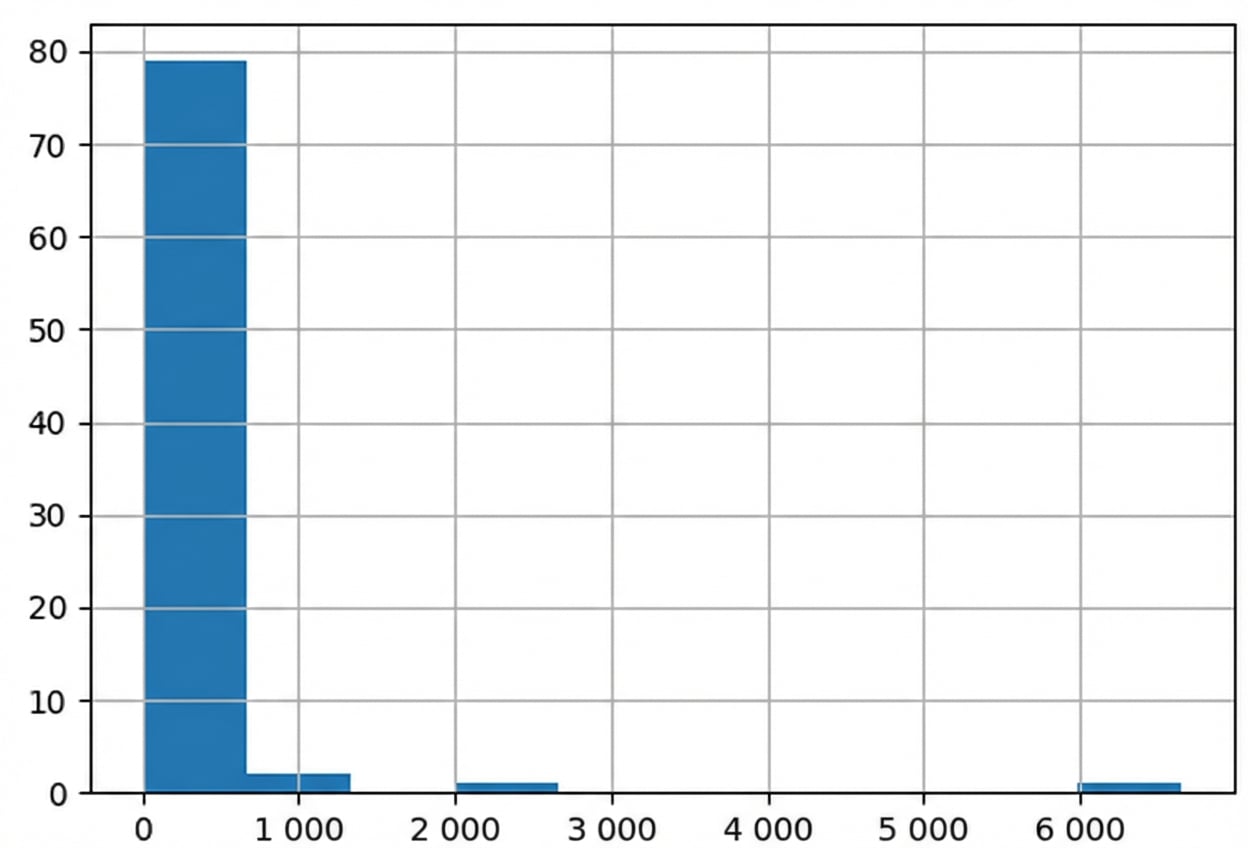
Distribution du poids corporel
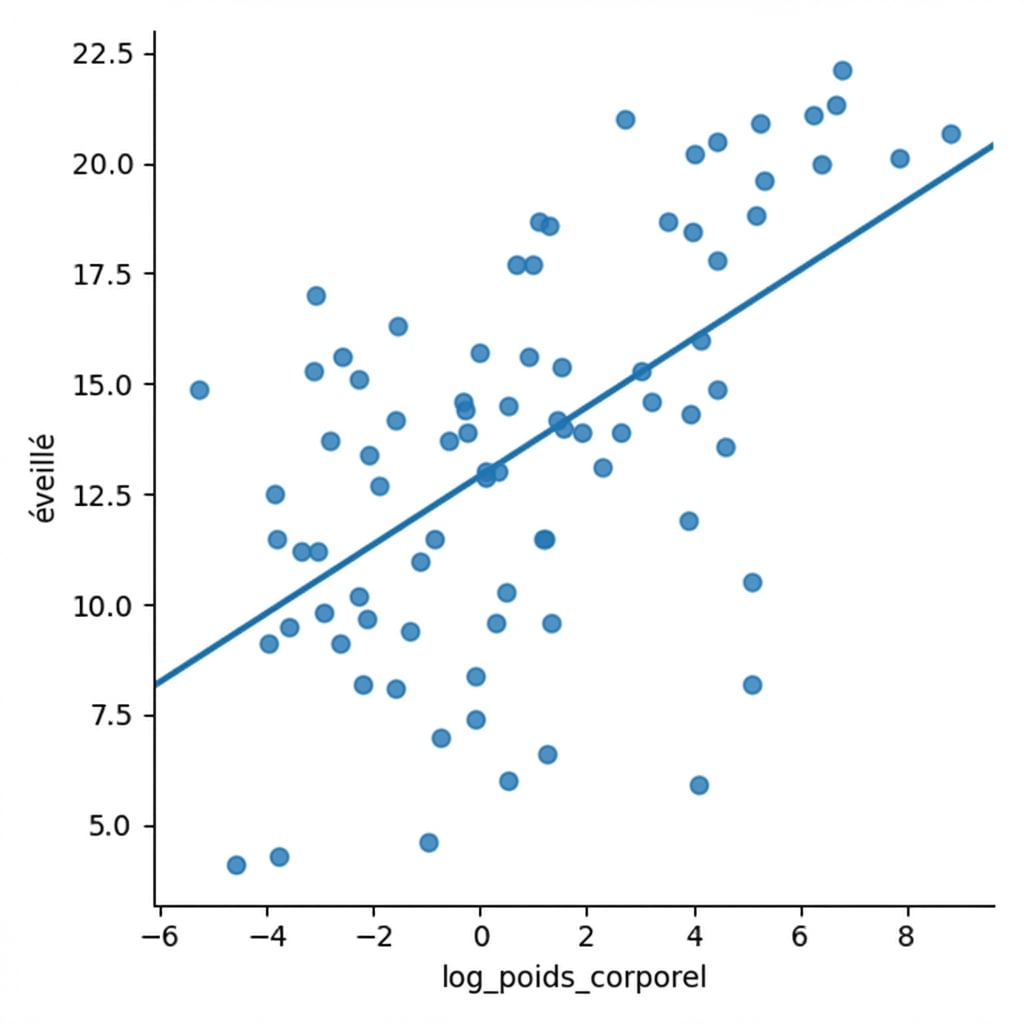
Transformation logarithmique
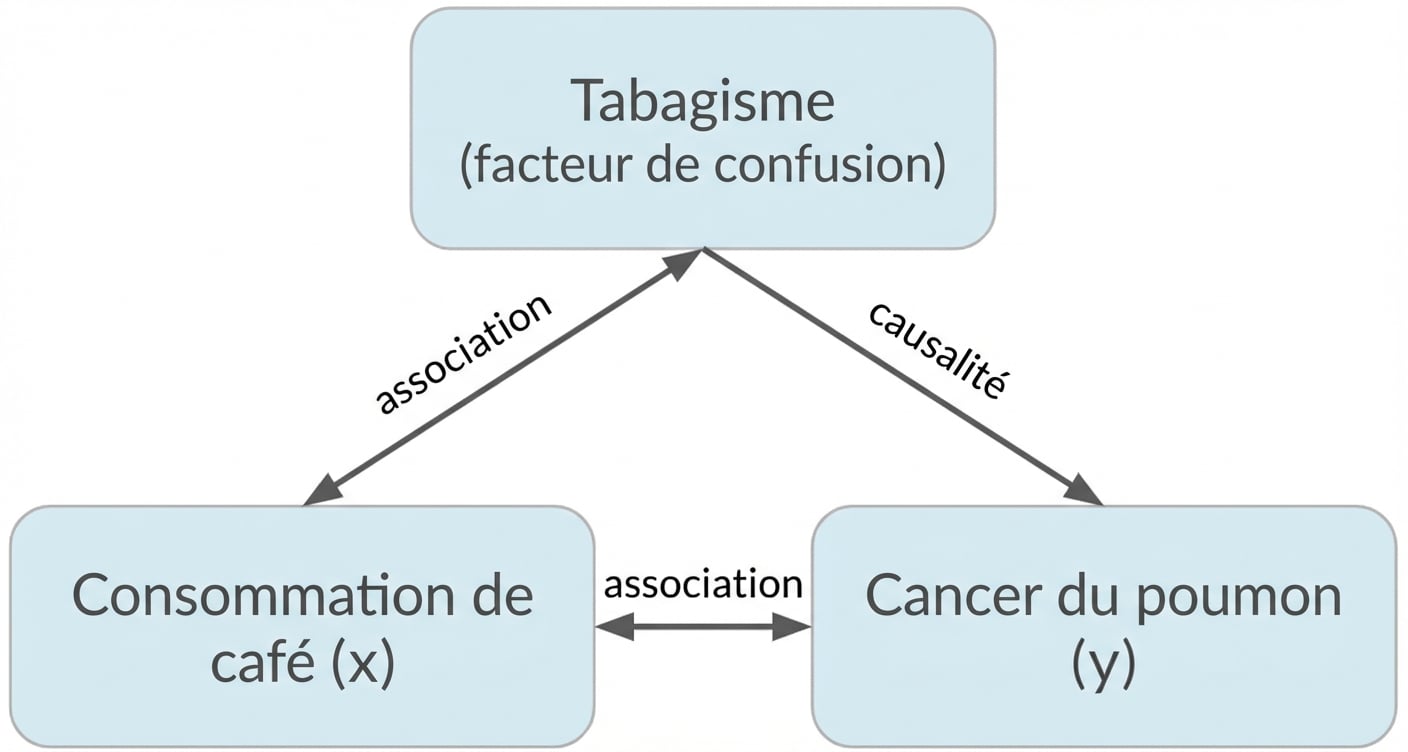
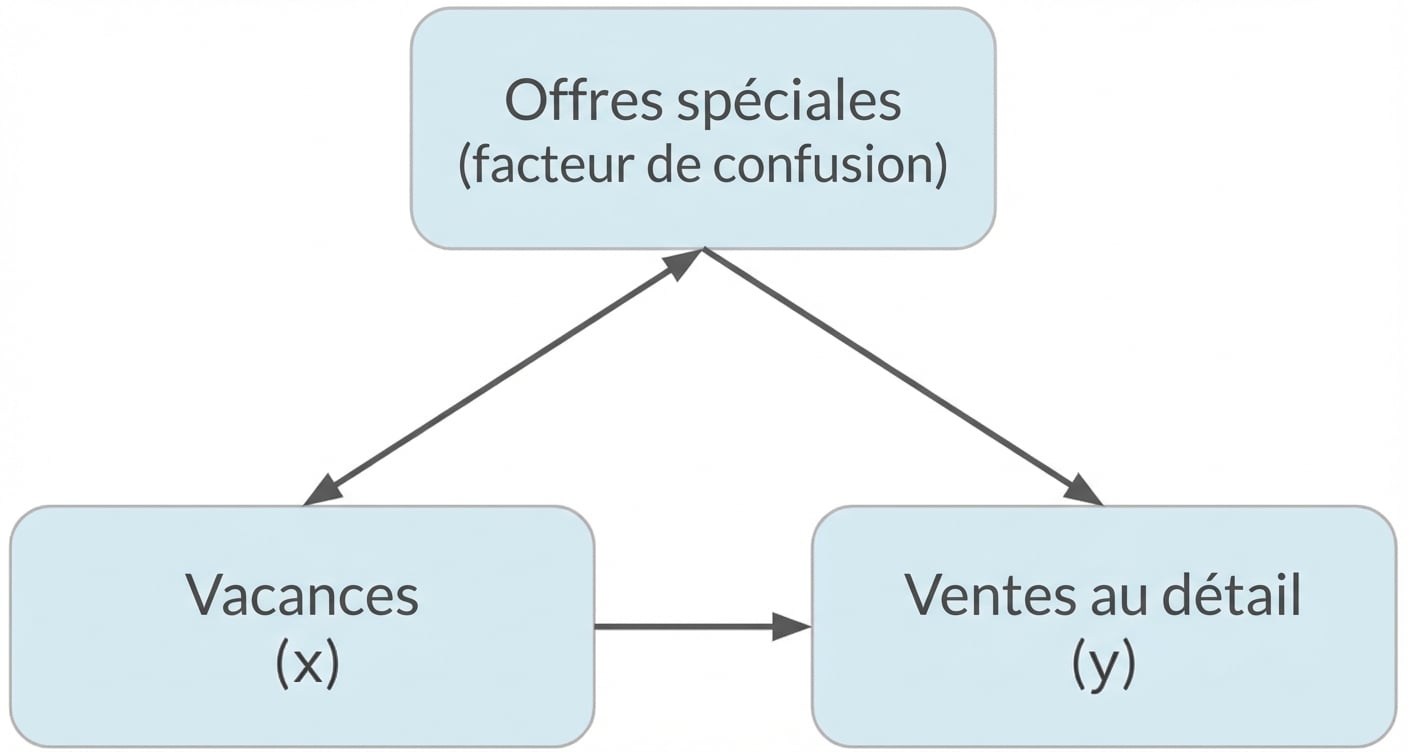
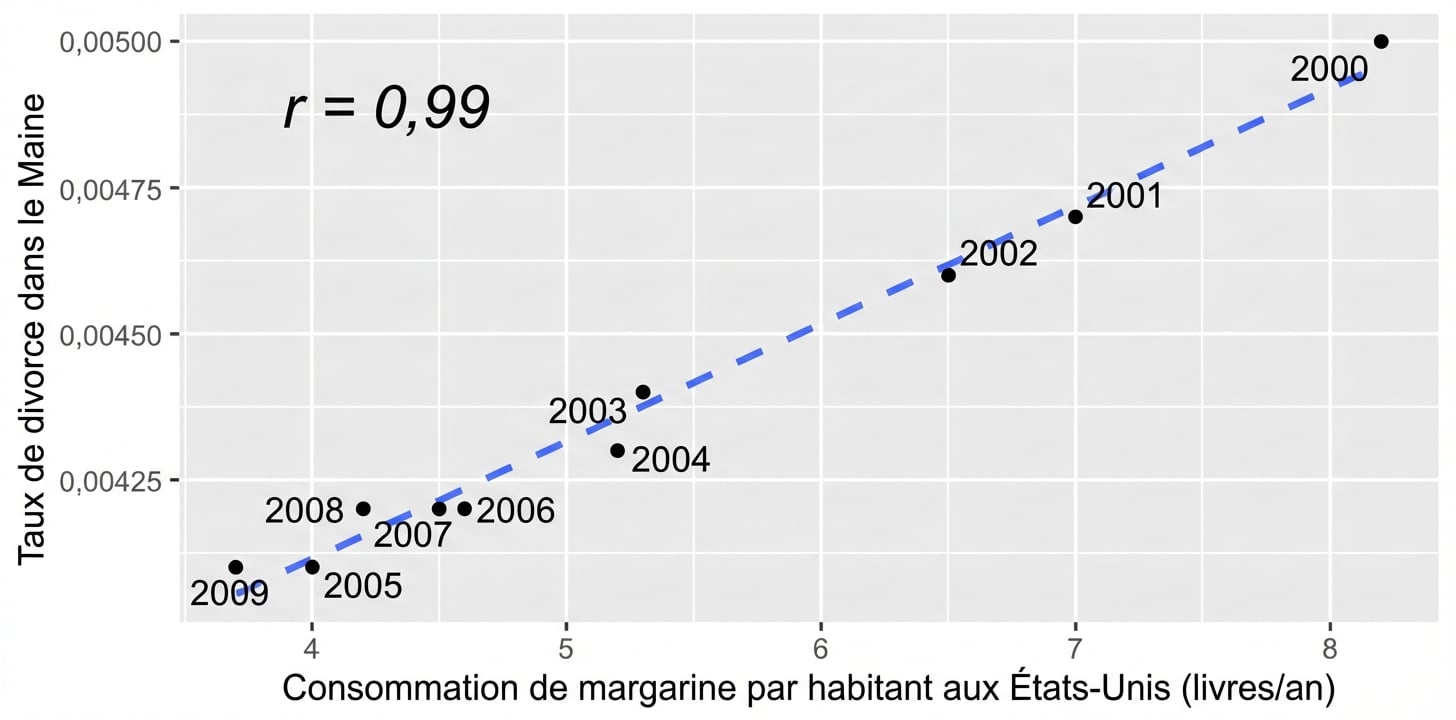
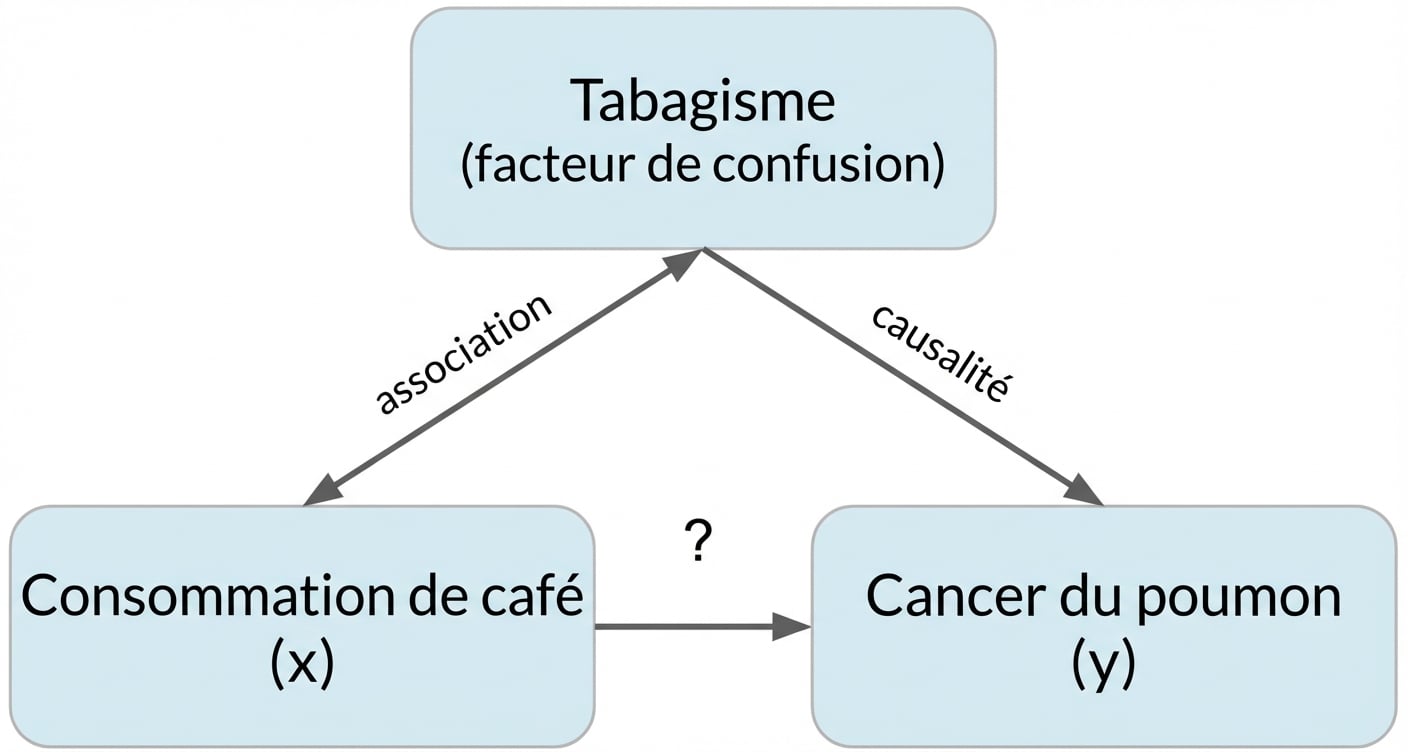
La corrélation n’implique pas la causalité
x est en corrélation avec y ne signifie pas x cause y
Confusion
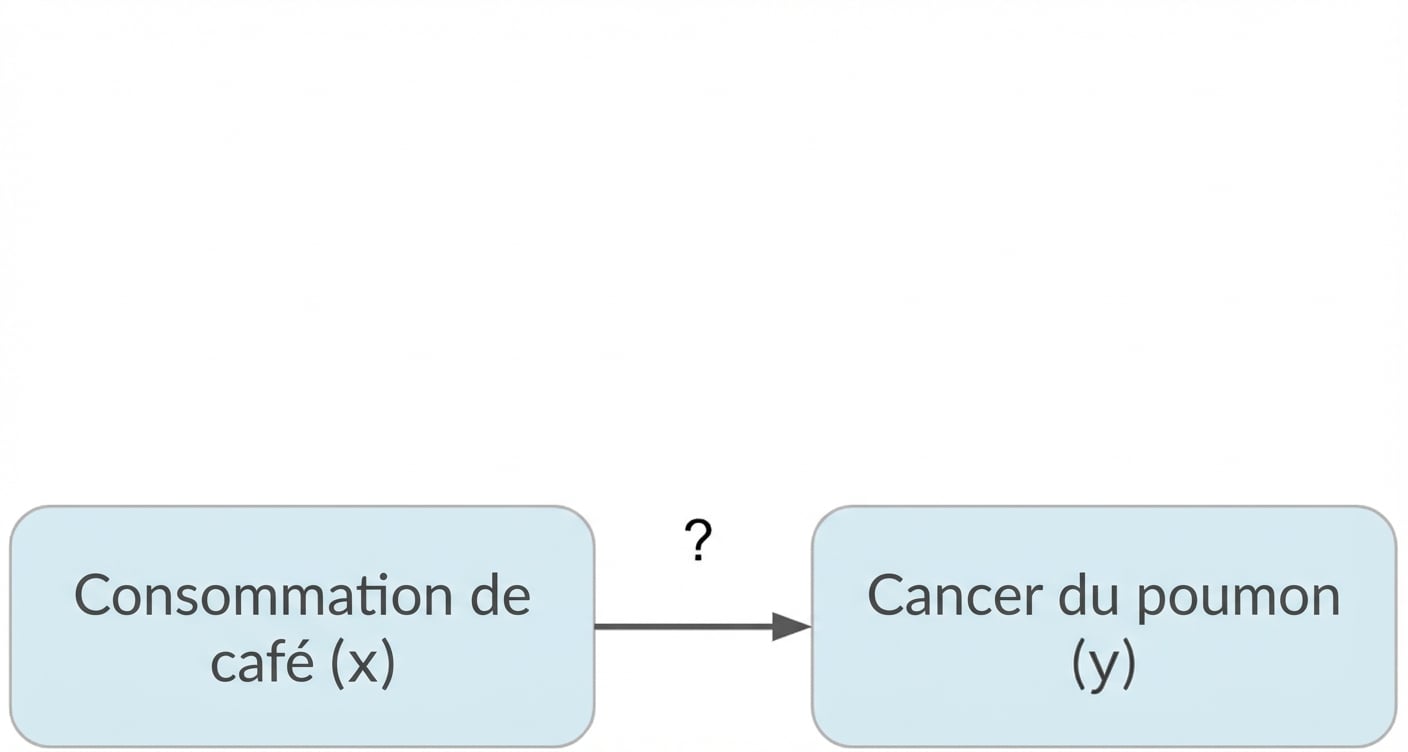
Confusion
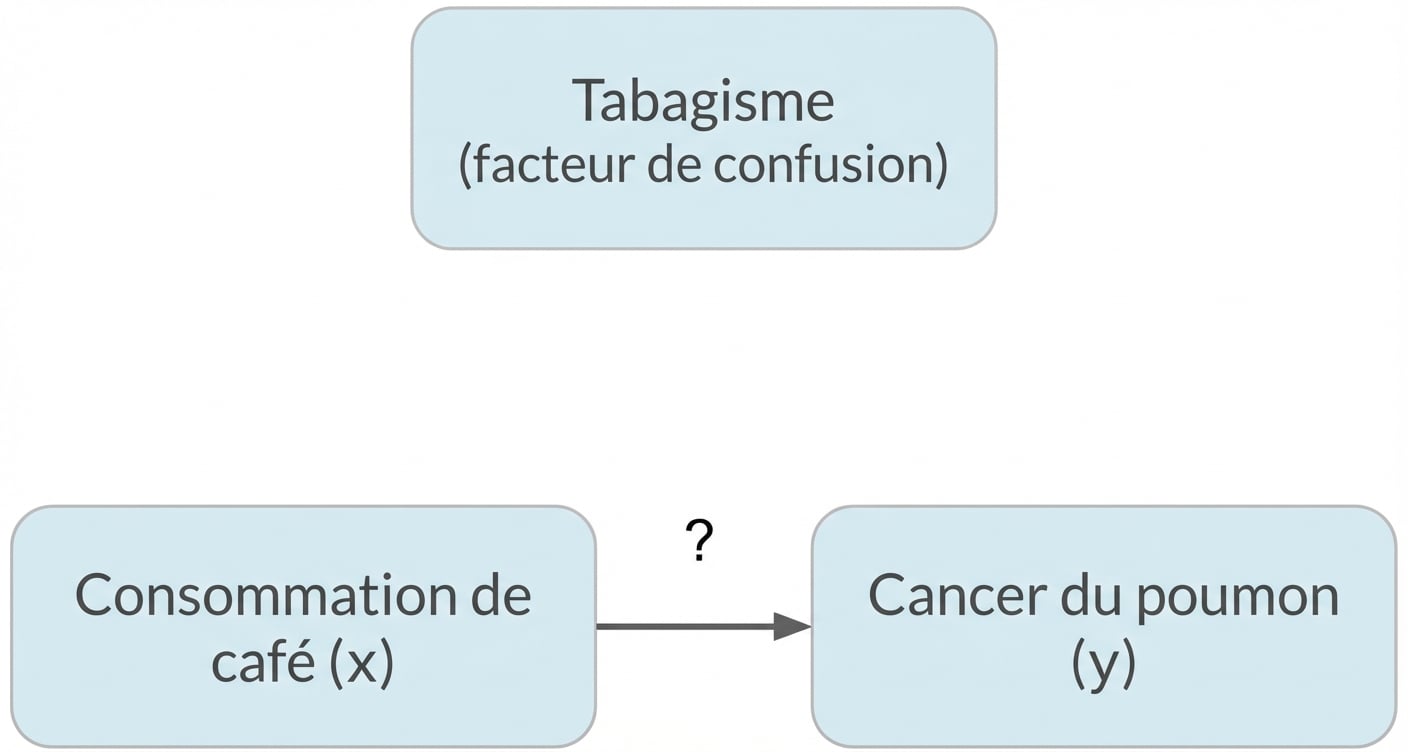
Confusion
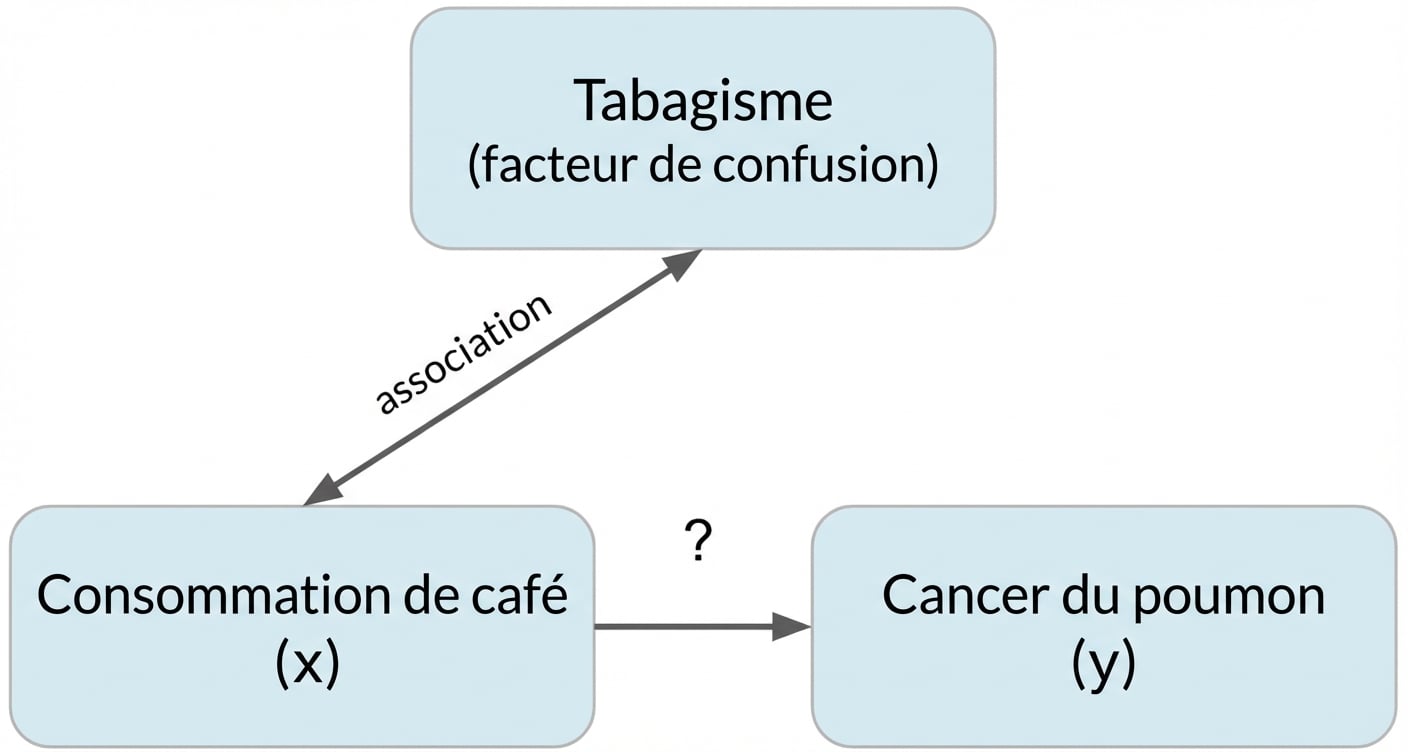
Confusion
Confusion