What if...
Analisi dei dati su Excel

Nick Edwards
Analyst at Mynd
What is scenario analysis?
- Scenario analysis is a type of what-if analysis that evaluates the impact of a dependent variable given one or more inputs.
- Asks "WHAT is this IF that?"
1 https://www.investopedia.com/terms/s/scenario_analysis.asp
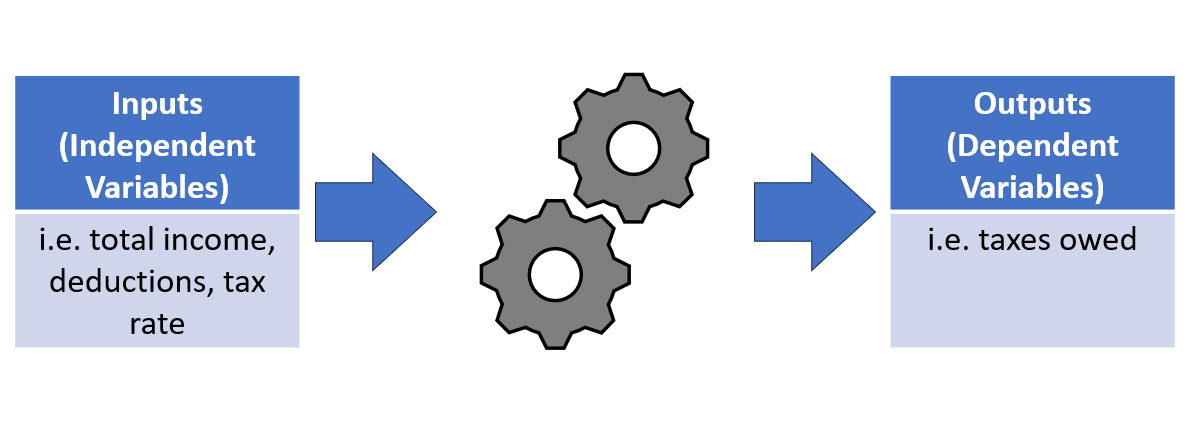
Dependent versus independent
Independent variables derive their value from outside of the model
- They are the inputs of the analysis
Dependent variables derive their value from the model and rely on inputs
- The observed output of the analysis
Example: Taxes Owed = (Total Income - Deductions) * Tax Rate
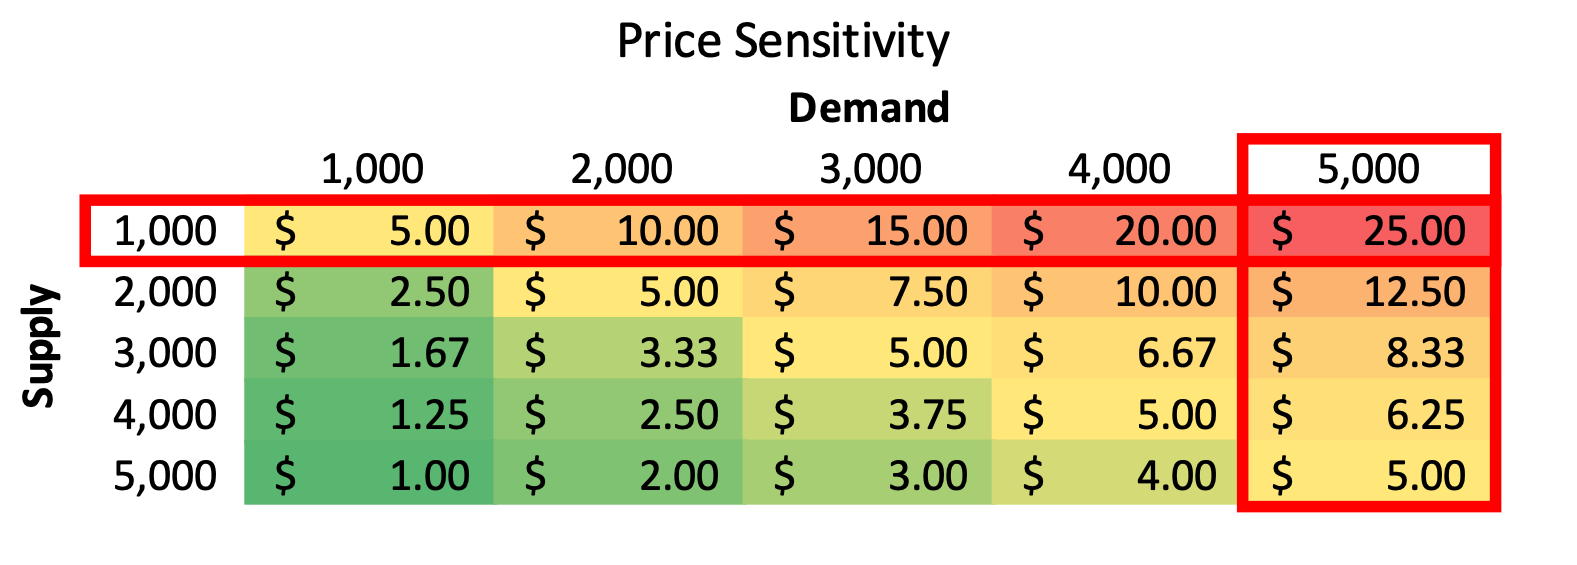
Sensitivity table
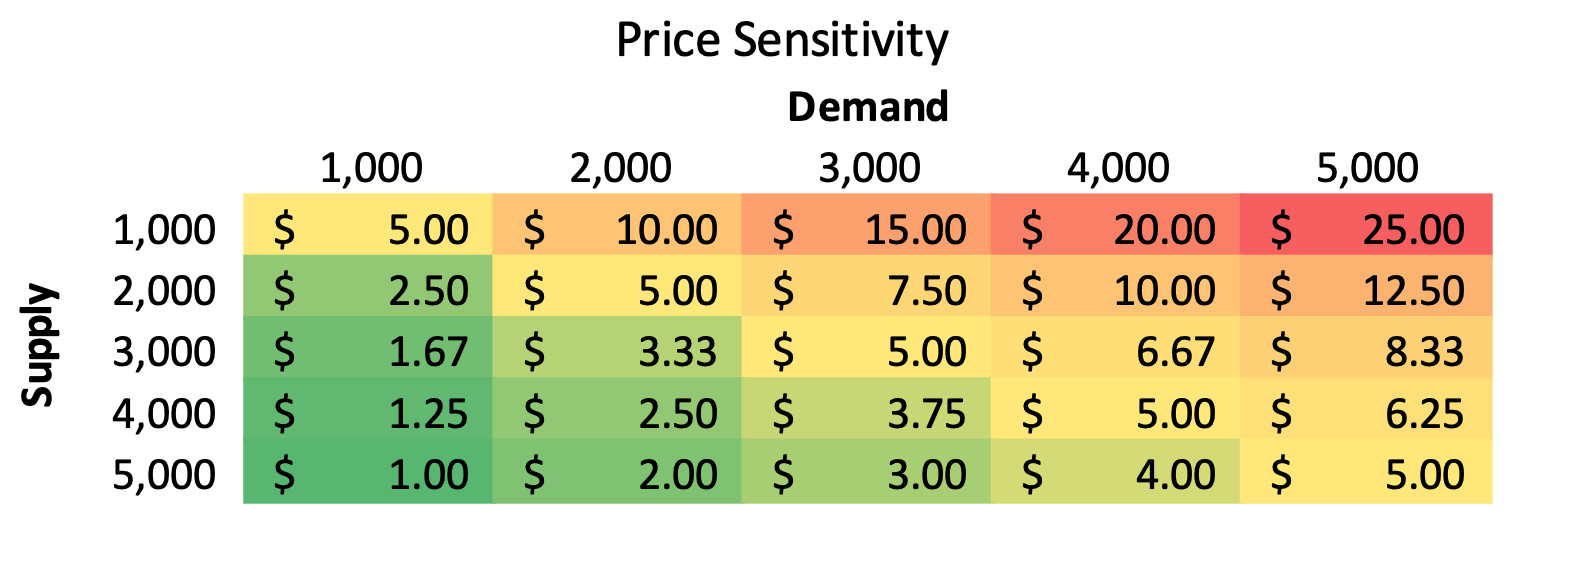
Sensitivity table
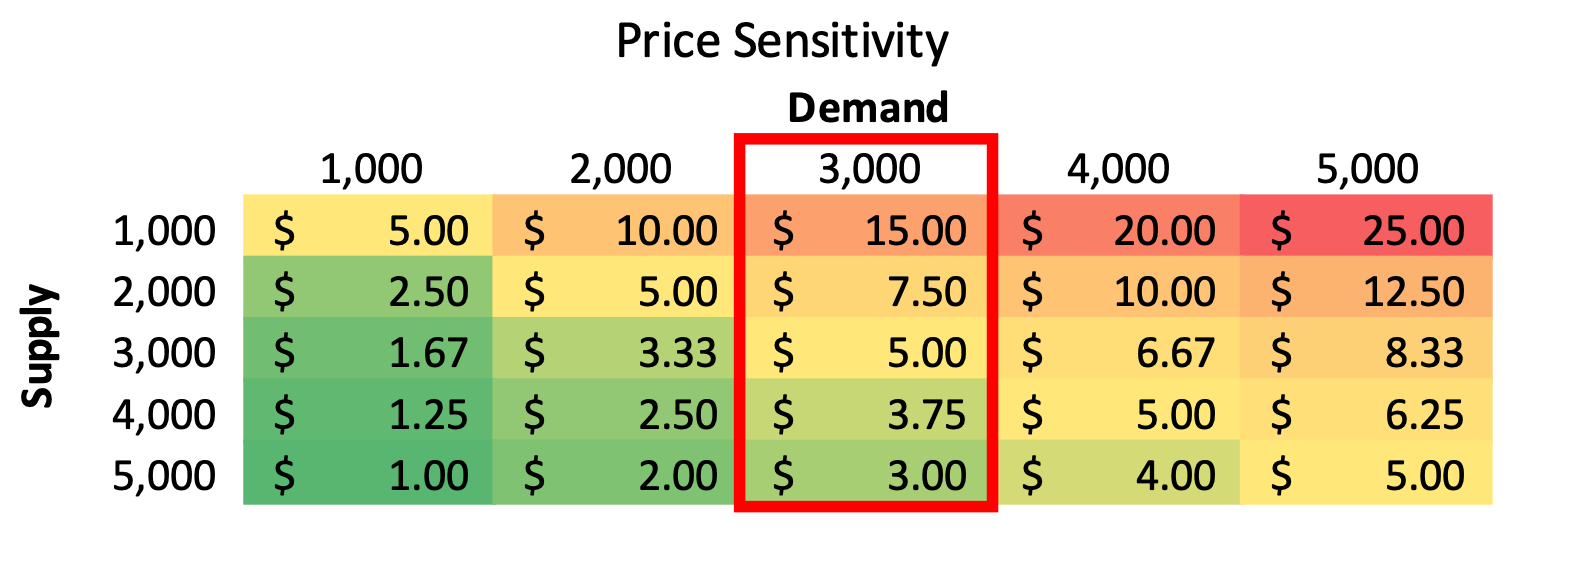
Sensitivity table

Sensitivity table
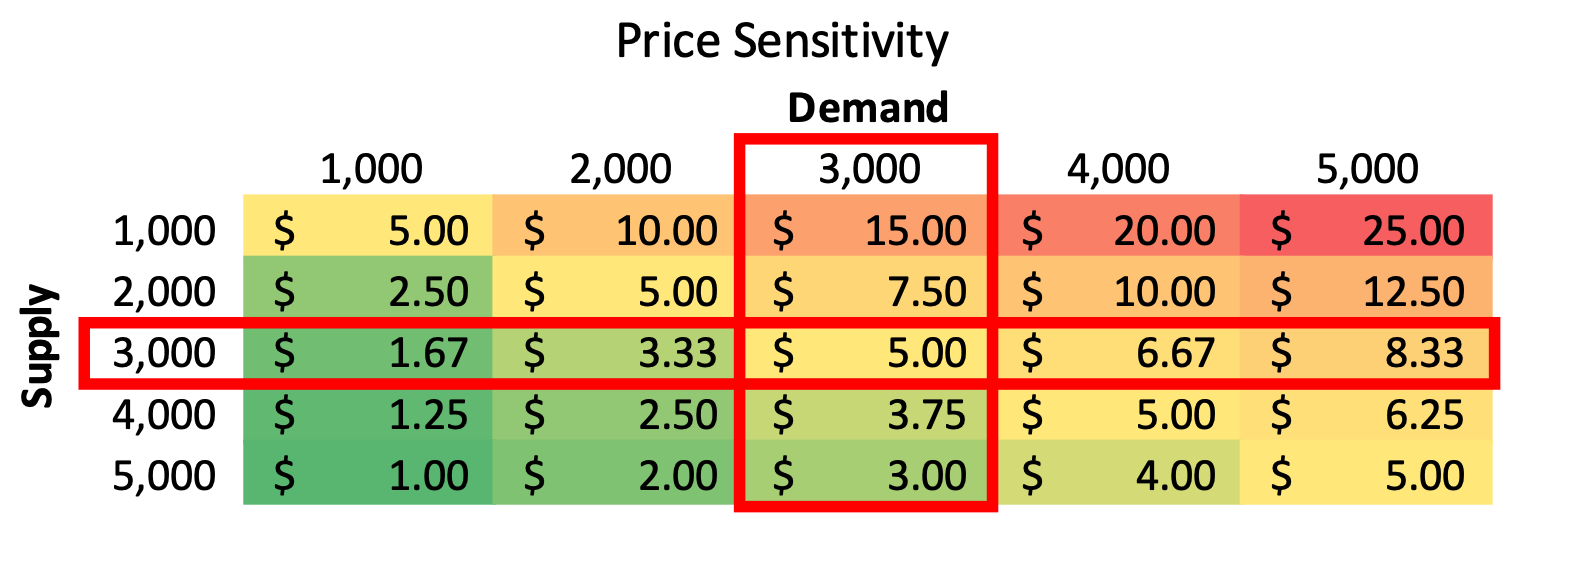
Sensitivity table
Growth rate
- Finds the change in x between two periods
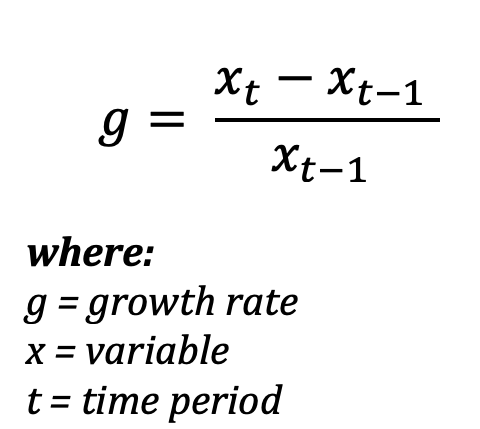
Growth rate
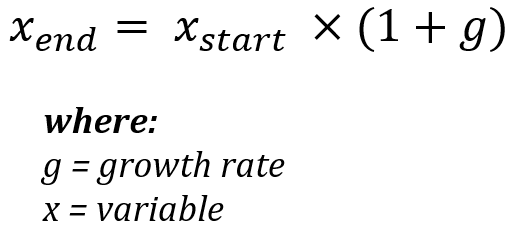
- Add
1togbefore multiplying!

