Getting an emotional response

Visualizzazione dei dati in Power BI

Iason Prassides

Content Developer at DataCamp

Have you hit the right audience?

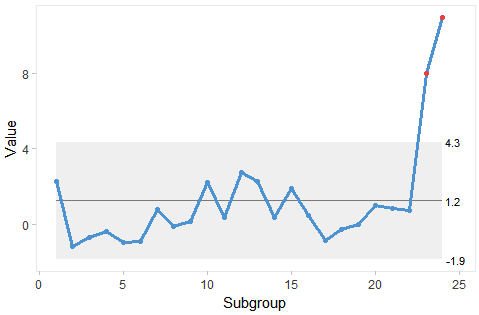
Process Control Chart

An example of an i chart

Context

  • Show the bore depth on drilled machinery versus ideal
  • If this is outside the acceptable (grey) zone, we have permanently damaged the product
  • You are a specialist responsible for managing this drill press
Visualizzazione dei dati in Power BI

Emotion engagement

Why I'm Happy

happy smiley

  • Everything on the dashboard looks fine
  • Do not need to perform any action (or can perform a positive action)

Why I'm Angry

angry smiley

  • Something has gone wrong
  • Need to act in response to this issue
Visualizzazione dei dati in Power BI

Emotion engagement

An neutral-looking smiley

Worst case: zero emotional response

  • Dashboard not relevant to the user
Visualizzazione dei dati in Power BI

Our audience

Product Manager

  • Main focus is:
    • product success
    • product development
  • Obtaining information on product performance is vital
  • Product manager at Threads Ltd has a large team:
    • Any reports will be shared

Cartoon image of two individuals looking at performance visuals

Visualizzazione dei dati in Power BI

Let's practice!

Visualizzazione dei dati in Power BI

Preparing Video For Download...