Data-driven product forecasting

Processo decisionale basato sui dati per le aziende

Ted Kwartler

Data Dude

Not always simple

$$

Processo decisionale basato sui dati per le aziende

Products on products on products

The number of new products sold dictate the number of customer service phone calls received

Processo decisionale basato sui dati per le aziende

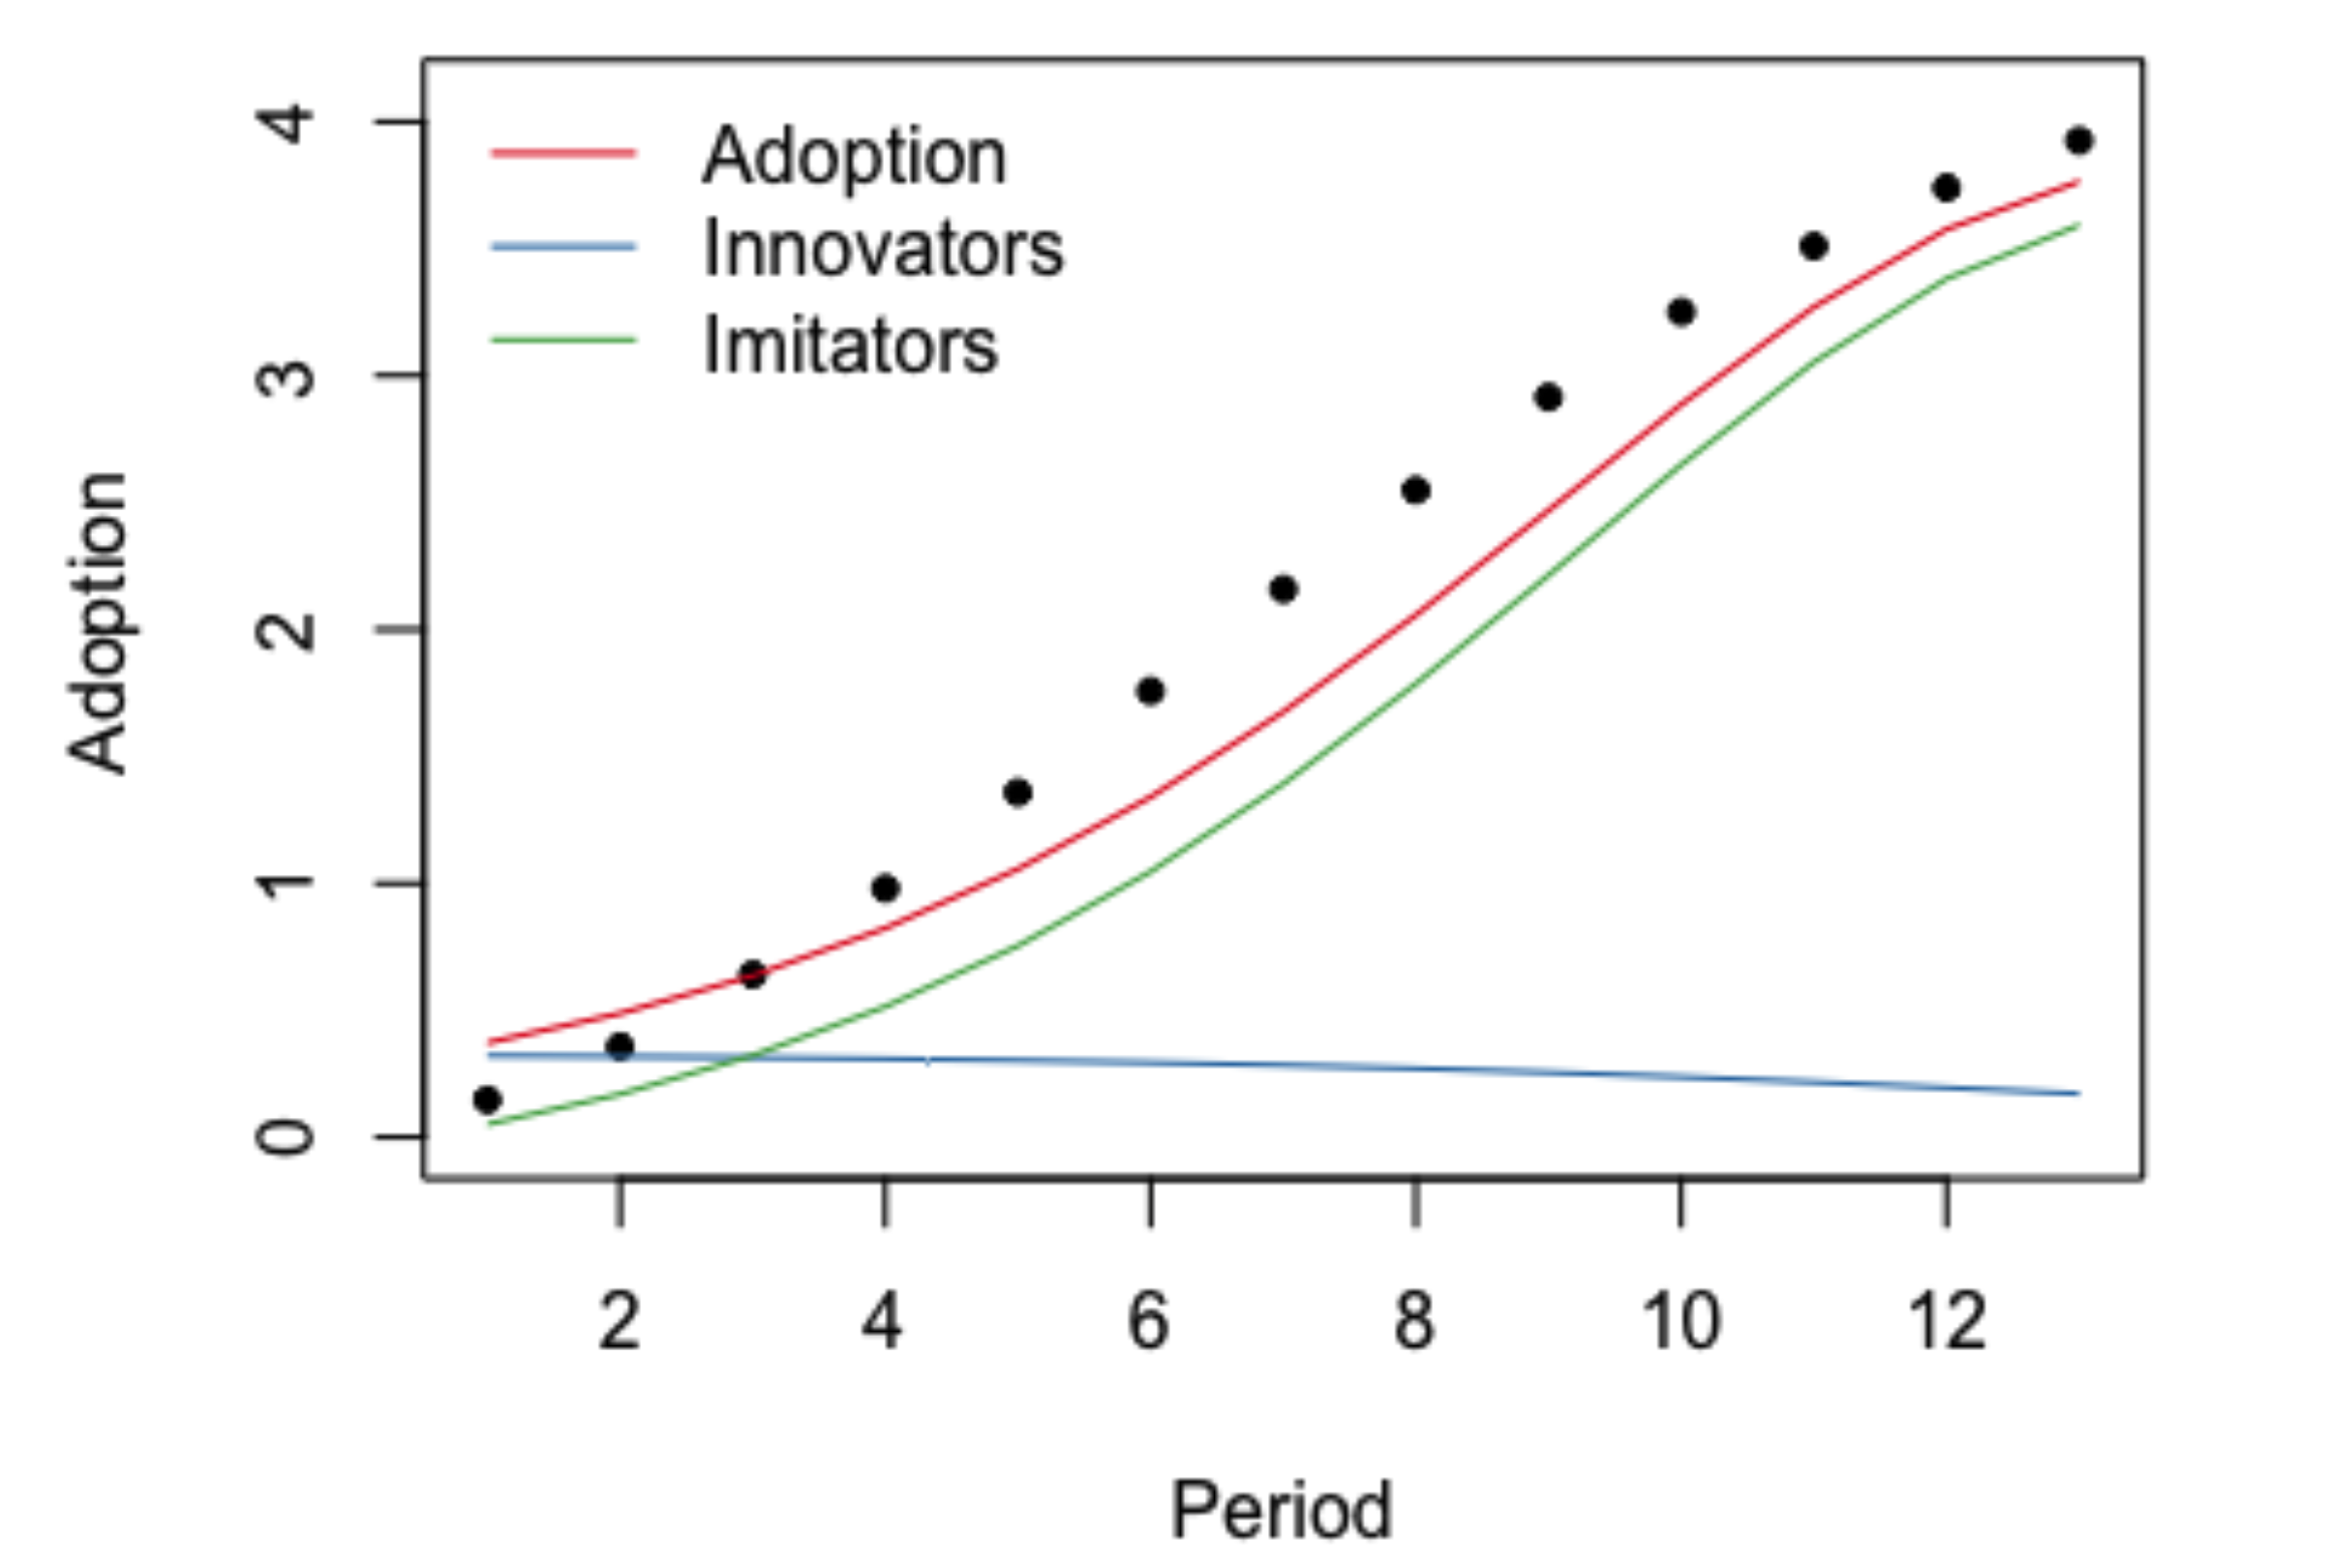
Growth model example

BASS model: early adopters curve and late adopter curve combine over time for the total market

curves

Processo decisionale basato sui dati per le aziende

Innovation vs. imitation

  • m: Total market capacity
  • p: Rate of innovation
  • q: Rate of imitation

At any given point in time, the forecast is the sum of p and q rates along reaching towards the total market capacity

Processo decisionale basato sui dati per le aziende

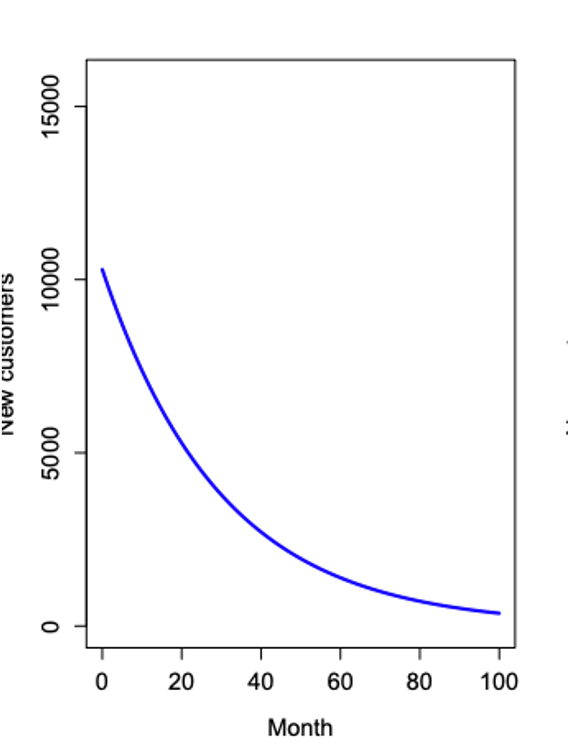
P: Innovation behavior

  • Steep decline
  • "People enticed and willing to take a chance"
  • Smaller total number

Processo decisionale basato sui dati per le aziende

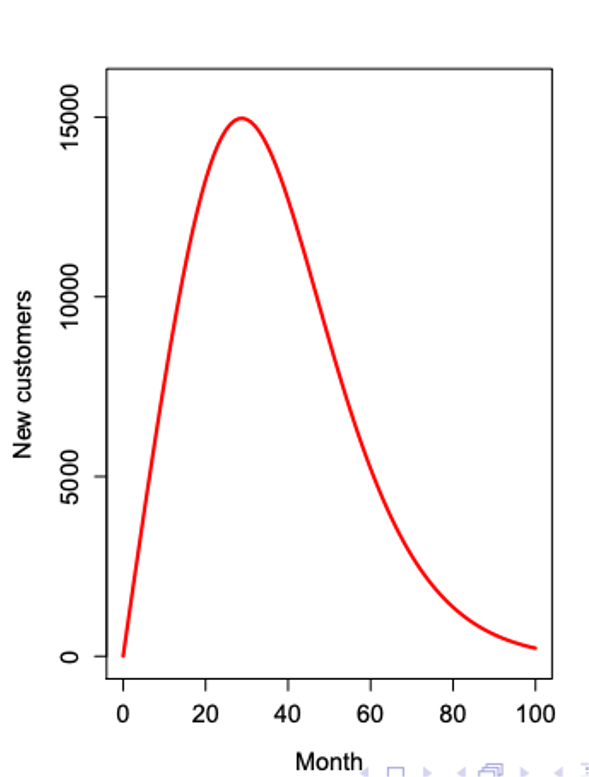
Q: Imitation behavior

  • Larger total number
  • Steep incline as they learn from innovators
  • "People eventually won over"

Processo decisionale basato sui dati per le aziende

P & Q side by side

P: Innovation

Q: Imitation

Processo decisionale basato sui dati per le aziende

Altogether now

Processo decisionale basato sui dati per le aziende

Historical P & Q

Product P-Inno Q - Imit
B/W TV .108 .231
Color TV .059 .146
Room Air Con. .006 .185
Dryers .009 .143
CD Player .055 .378
Cell Phones .008 .421
Steam Iron .031 .128
Microwave .002 .357
Hybrid Corn .000 .797
Home PC .121 .281

Averages:

  • P = 0.03
  • Q = 0.38
1 https://slideplayer.com/slide/1423750/
Processo decisionale basato sui dati per le aziende

Let's practice!

Processo decisionale basato sui dati per le aziende

Preparing Video For Download...