Exploratory Data Analysis
Comprendere la Data Science

Hadrien Lacroix
Content Developer at DataCamp
What is EDA?
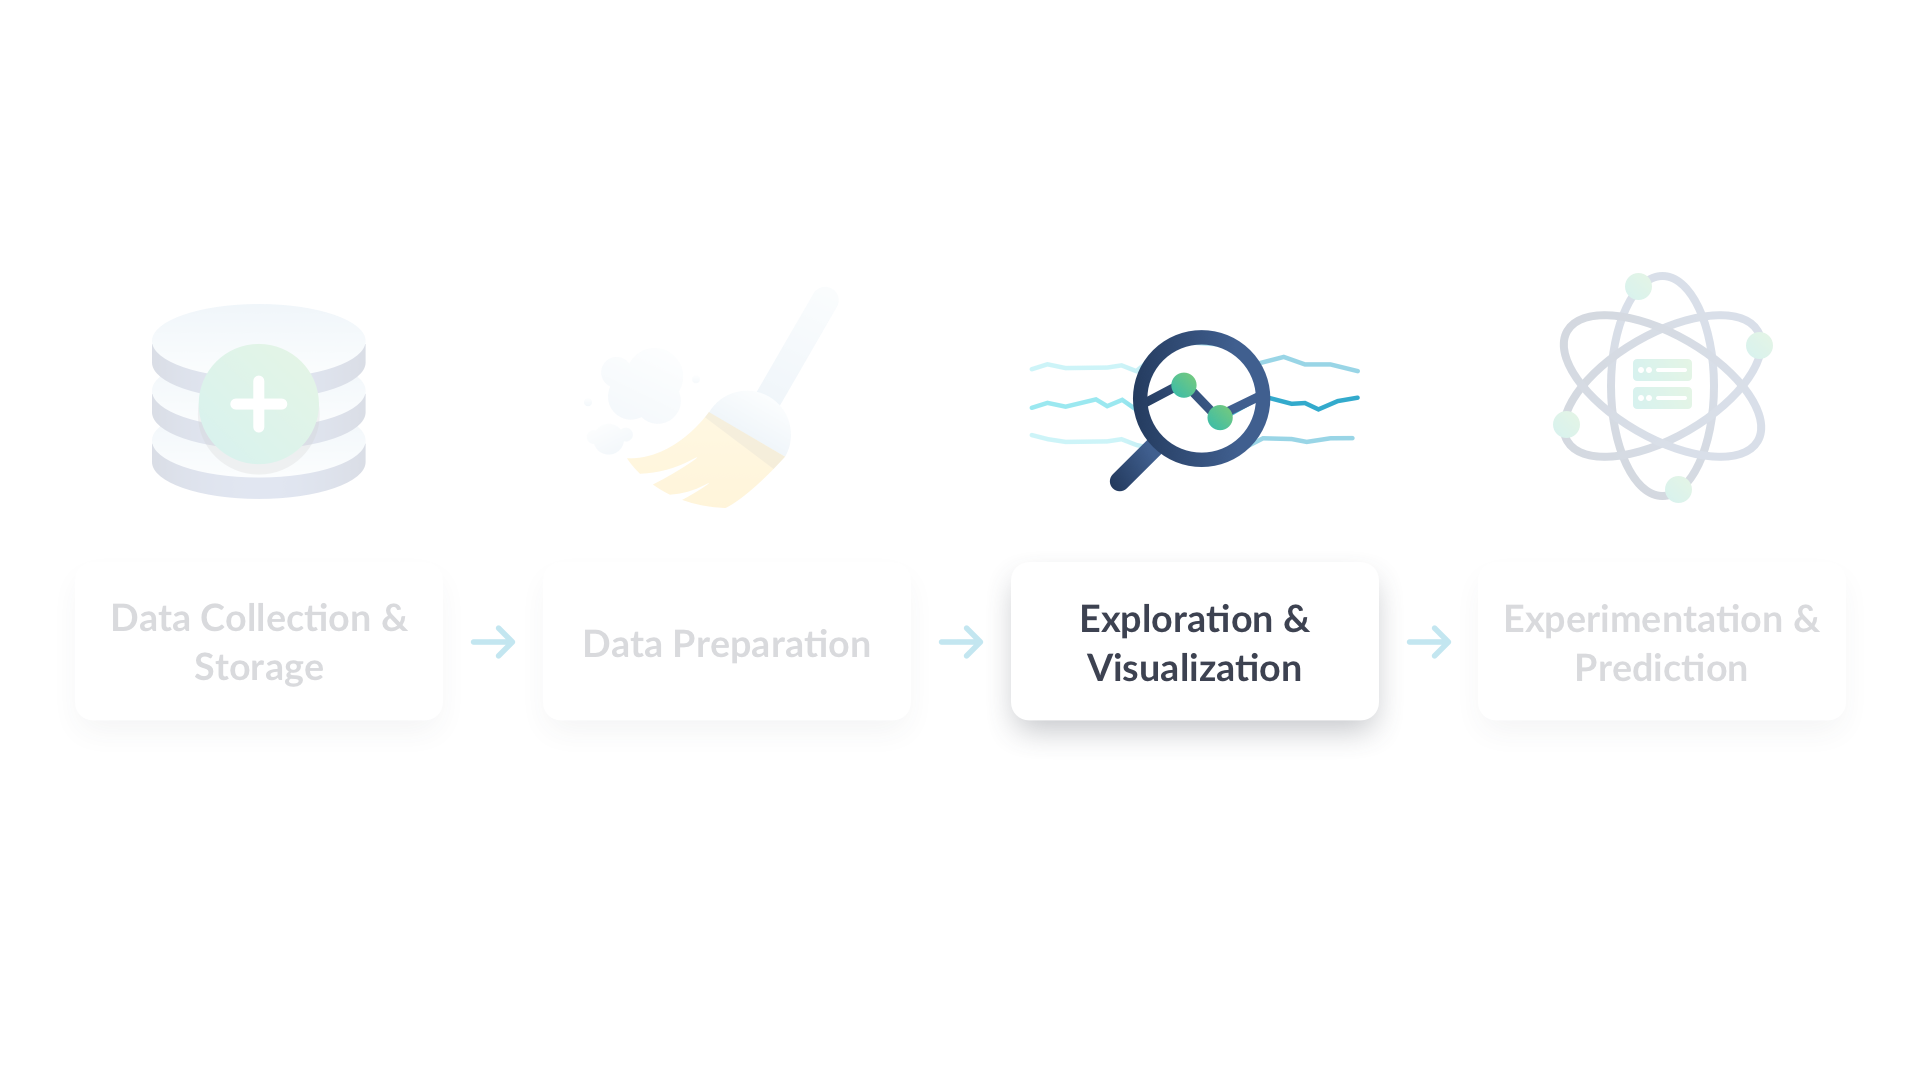
Data workflow
Anscombe's quartet
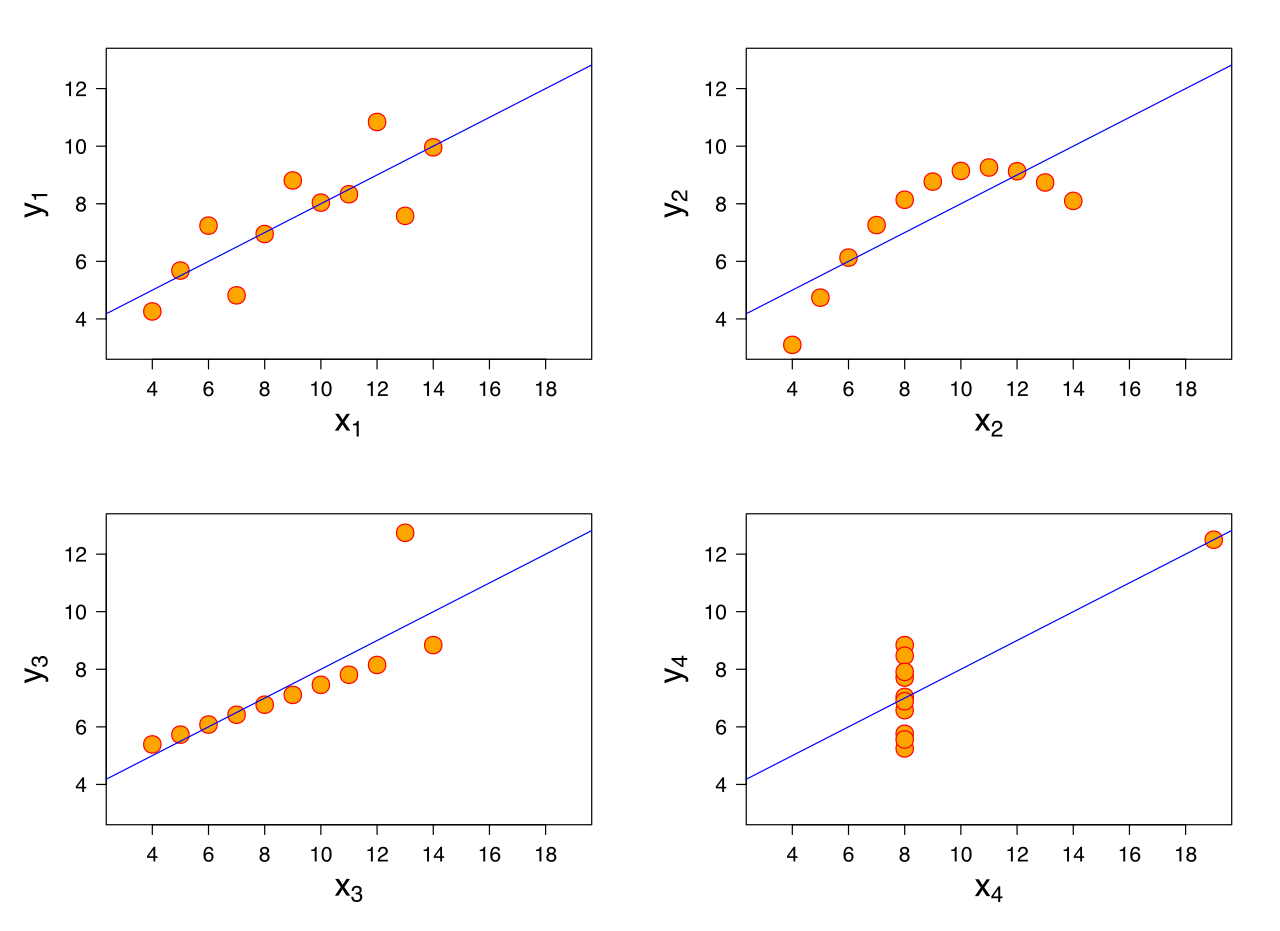
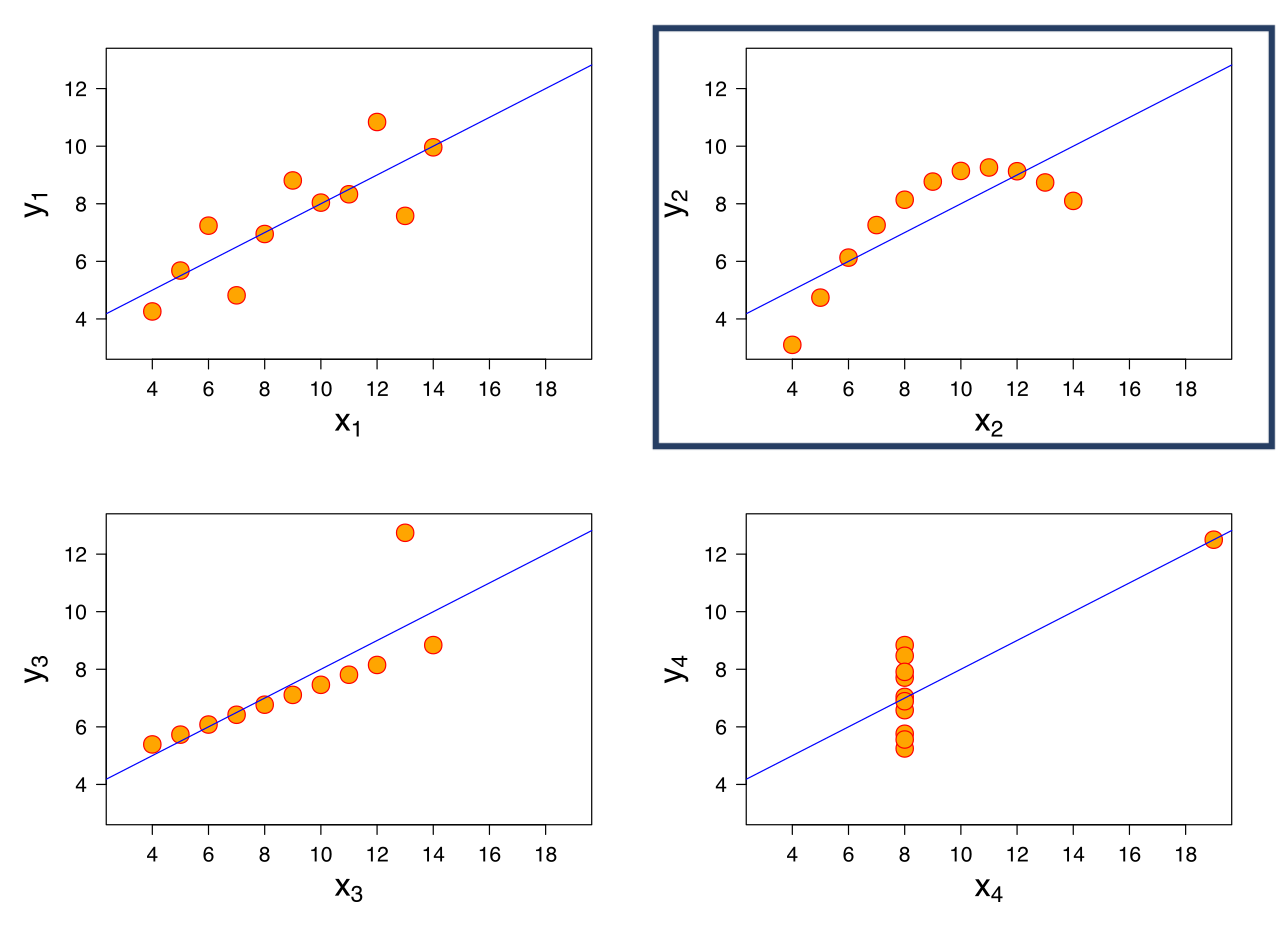
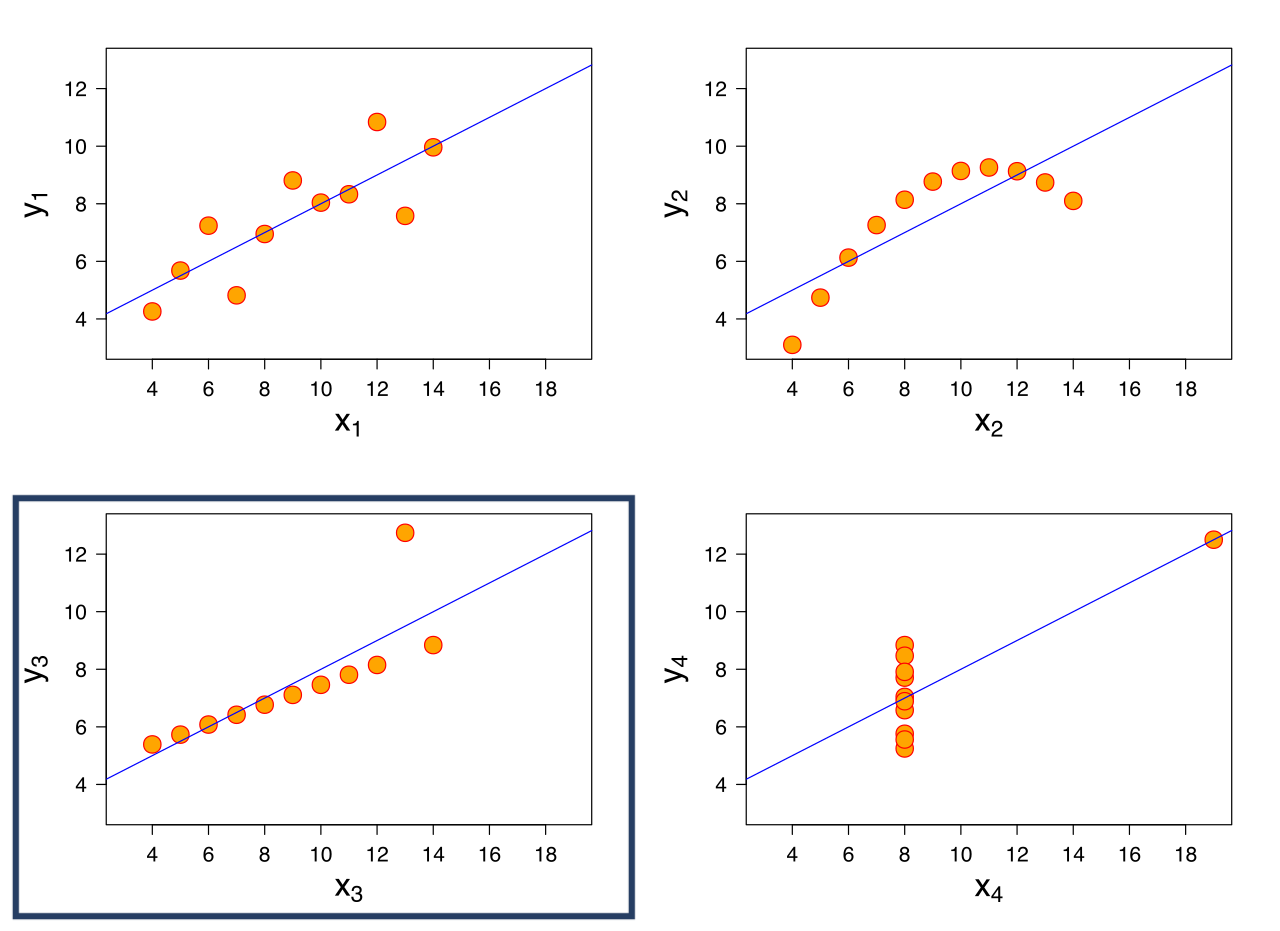
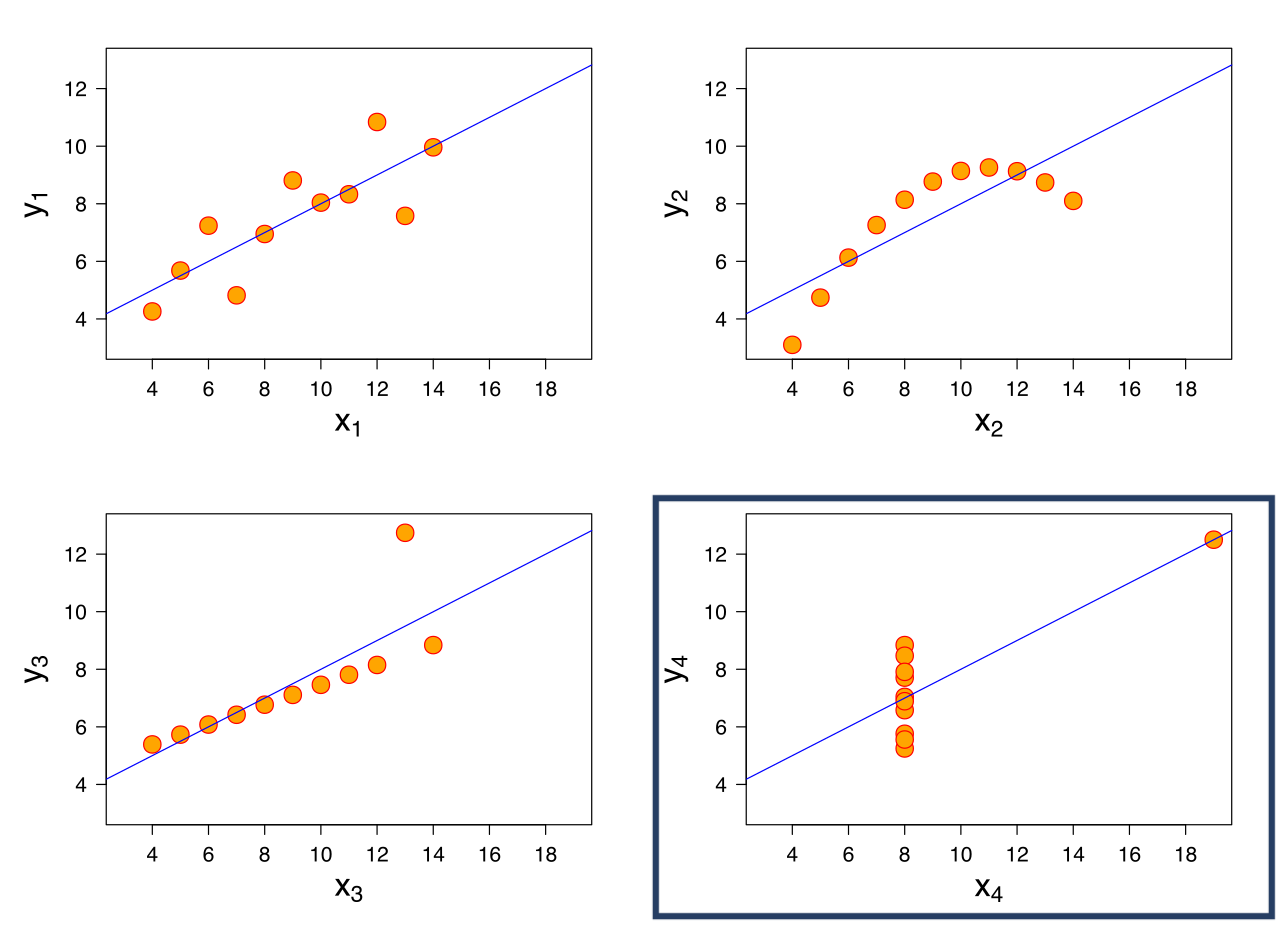

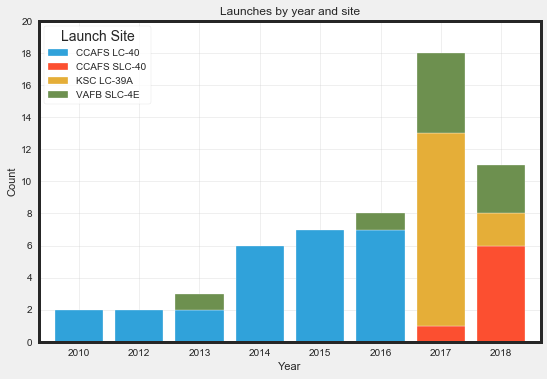
Visualize!
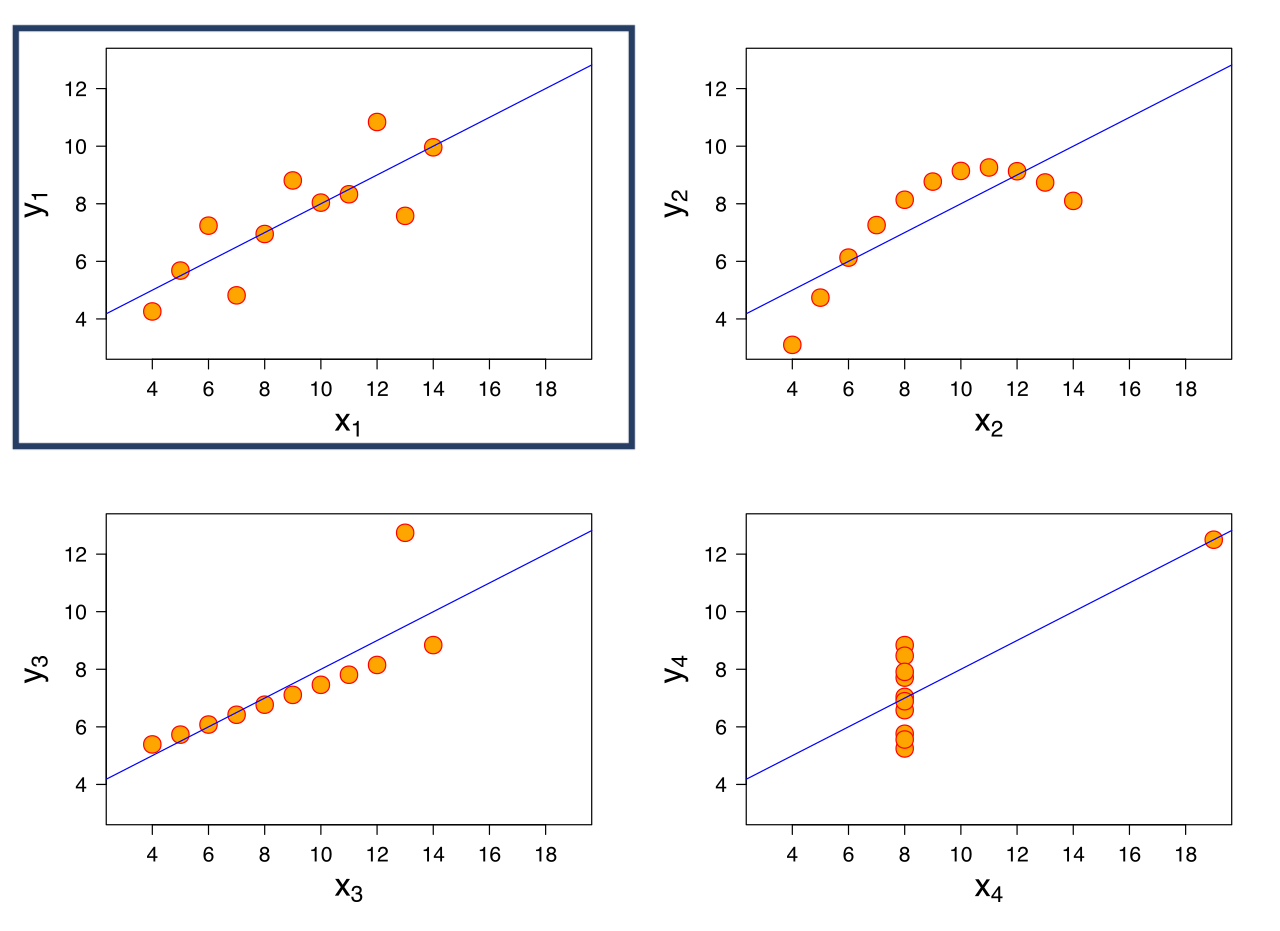
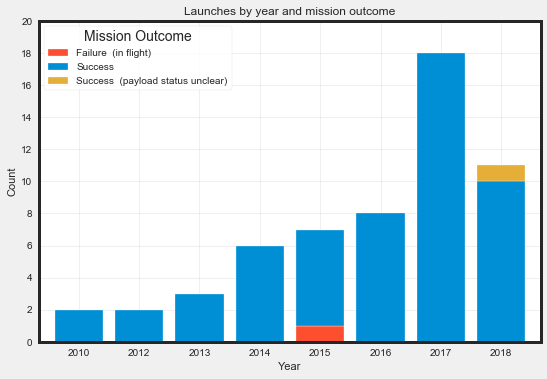
Ask more questions!
Ask more questions!
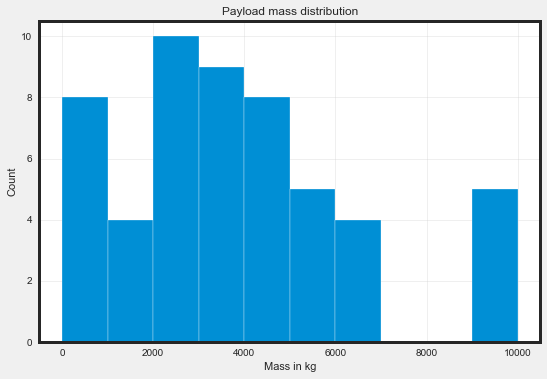
Outliers
Comprendere la Data Science
Hadrien Lacroix
Content Developer at DataCamp

