Line plots
Introduzione al Tidyverse

David Robinson
Chief Data Scientist, DataCamp
Types of plots
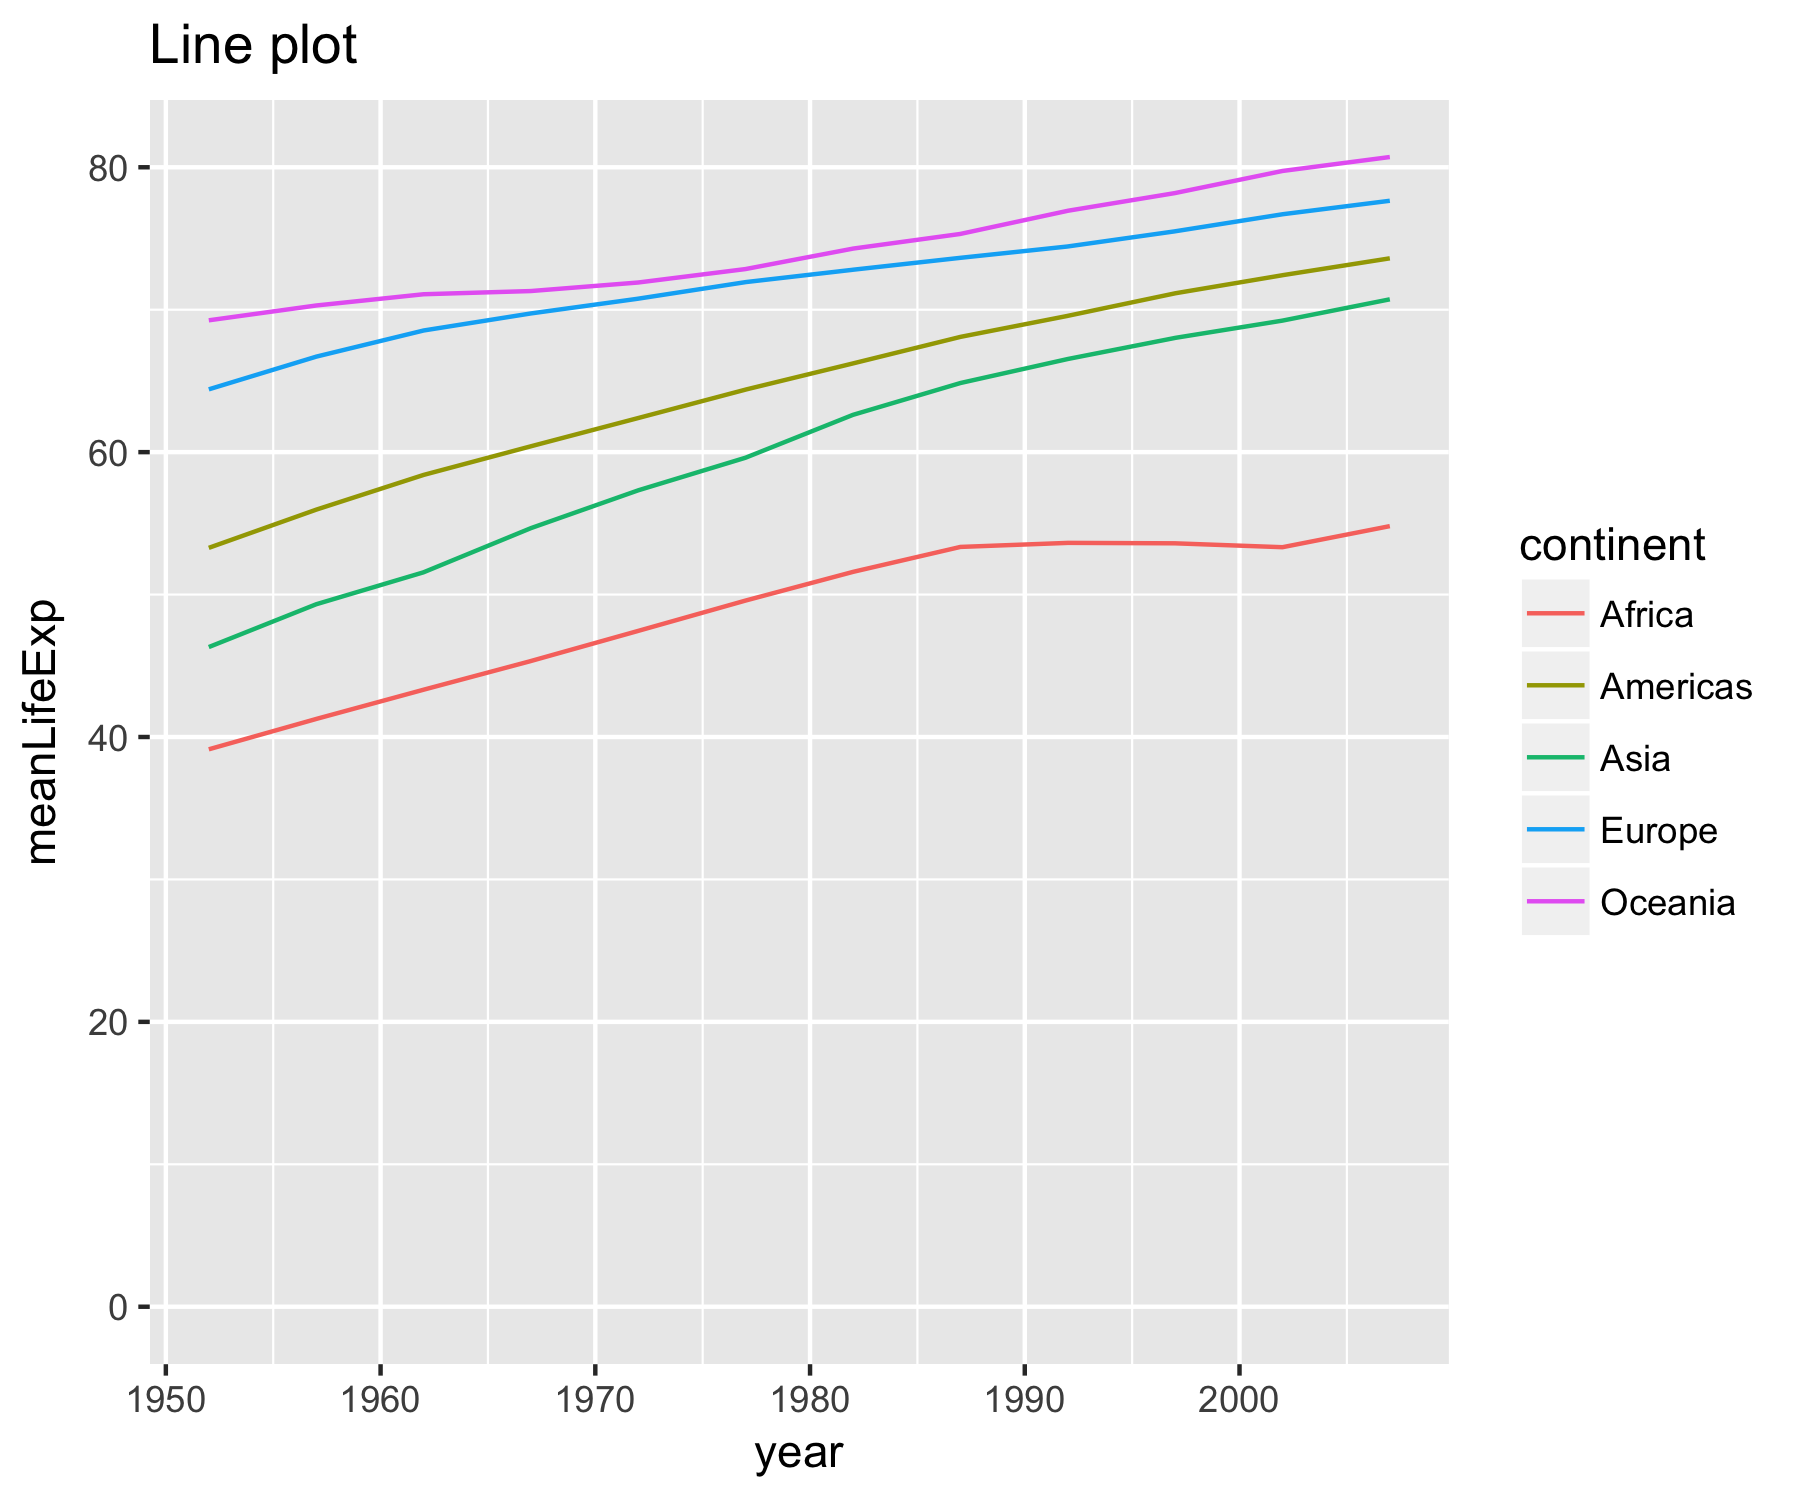
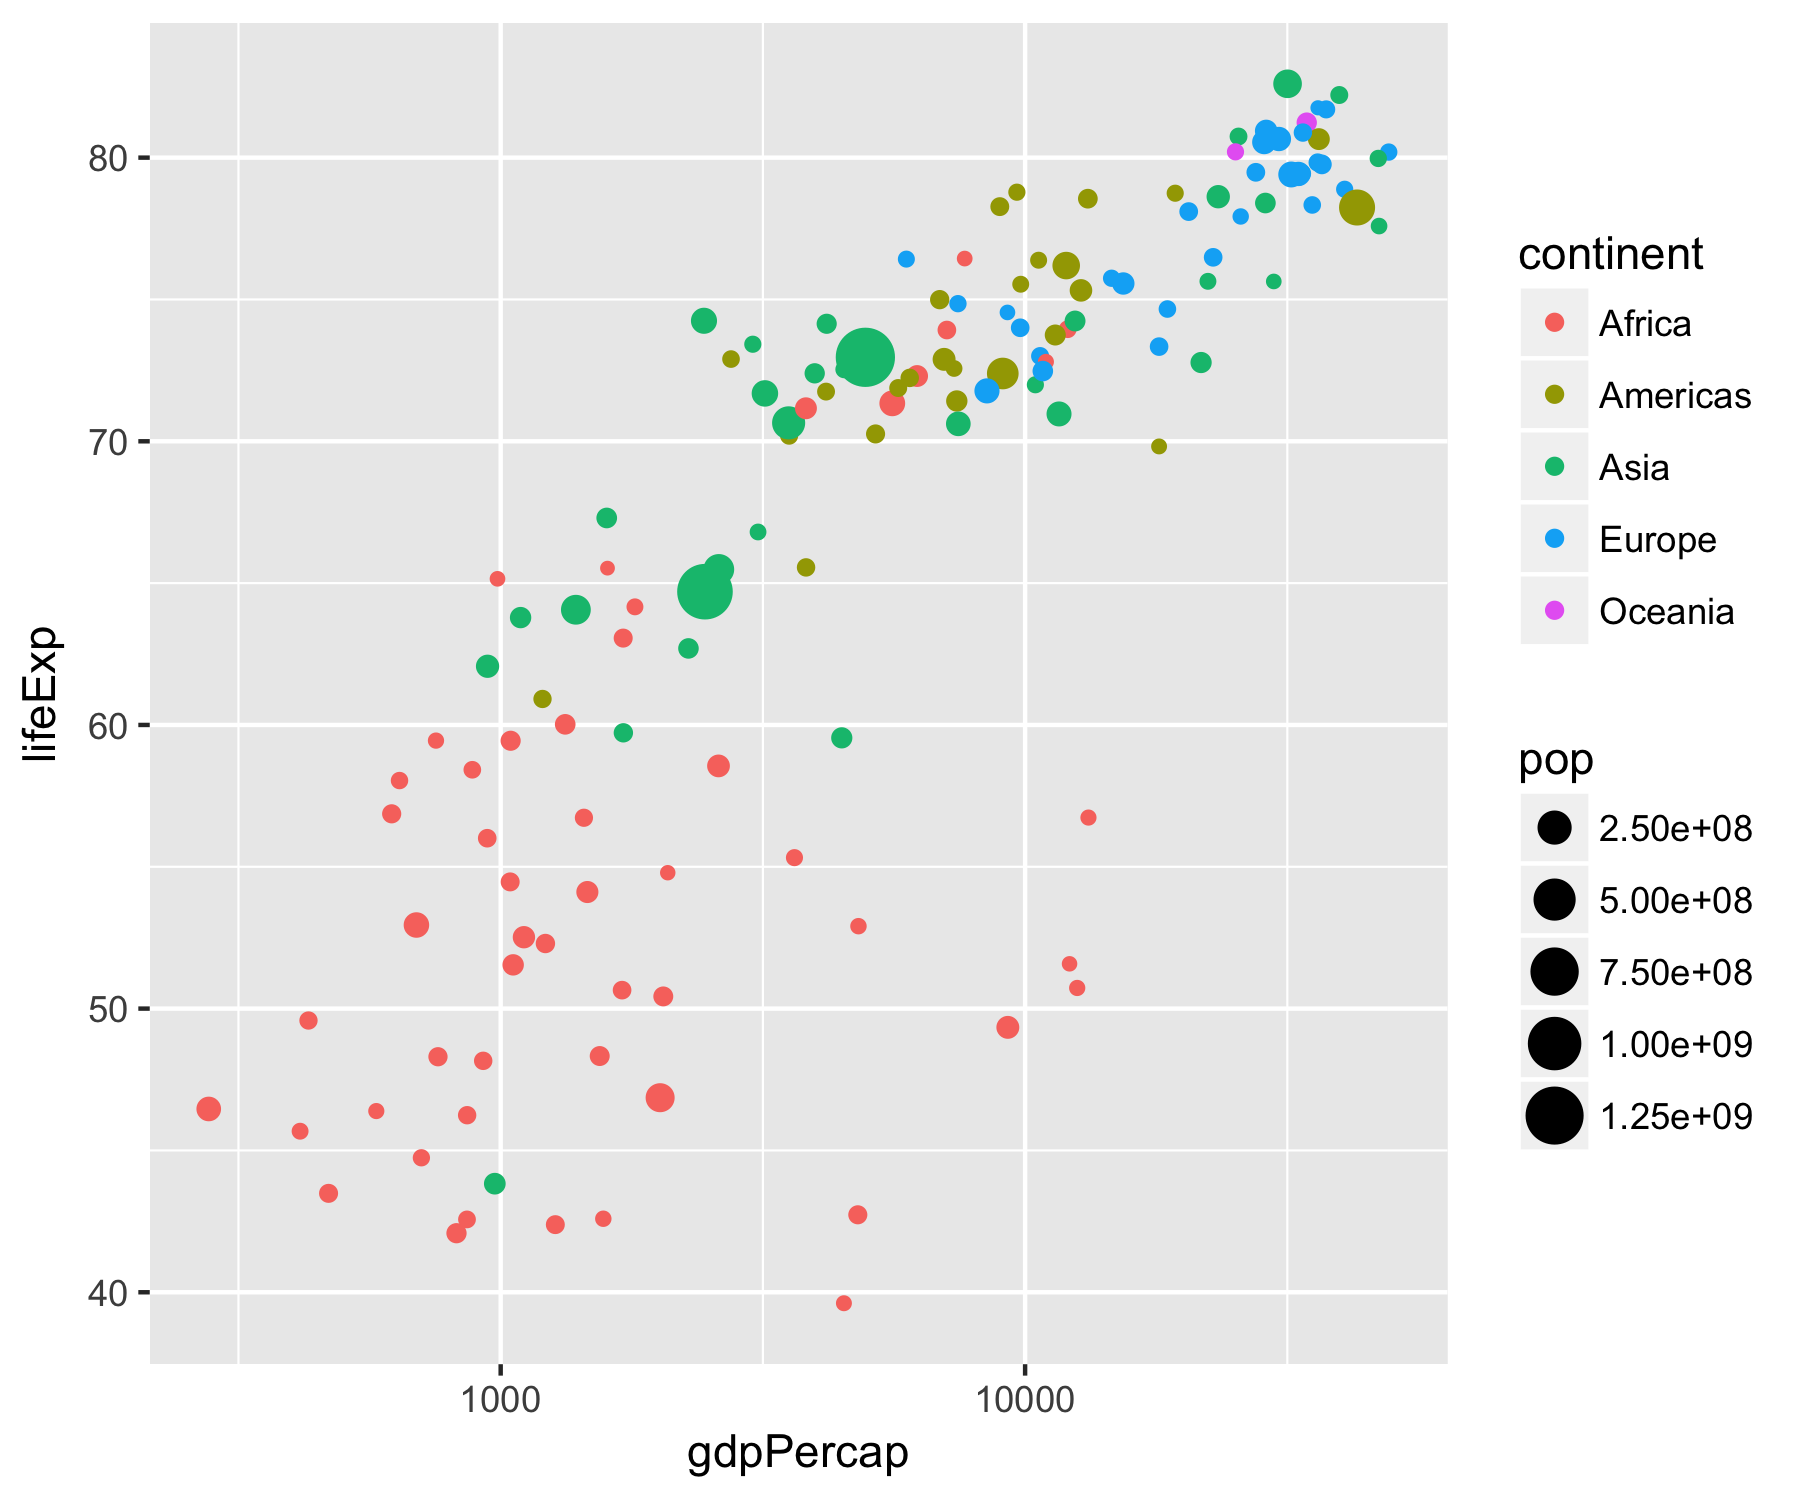
Scatter vs line plot
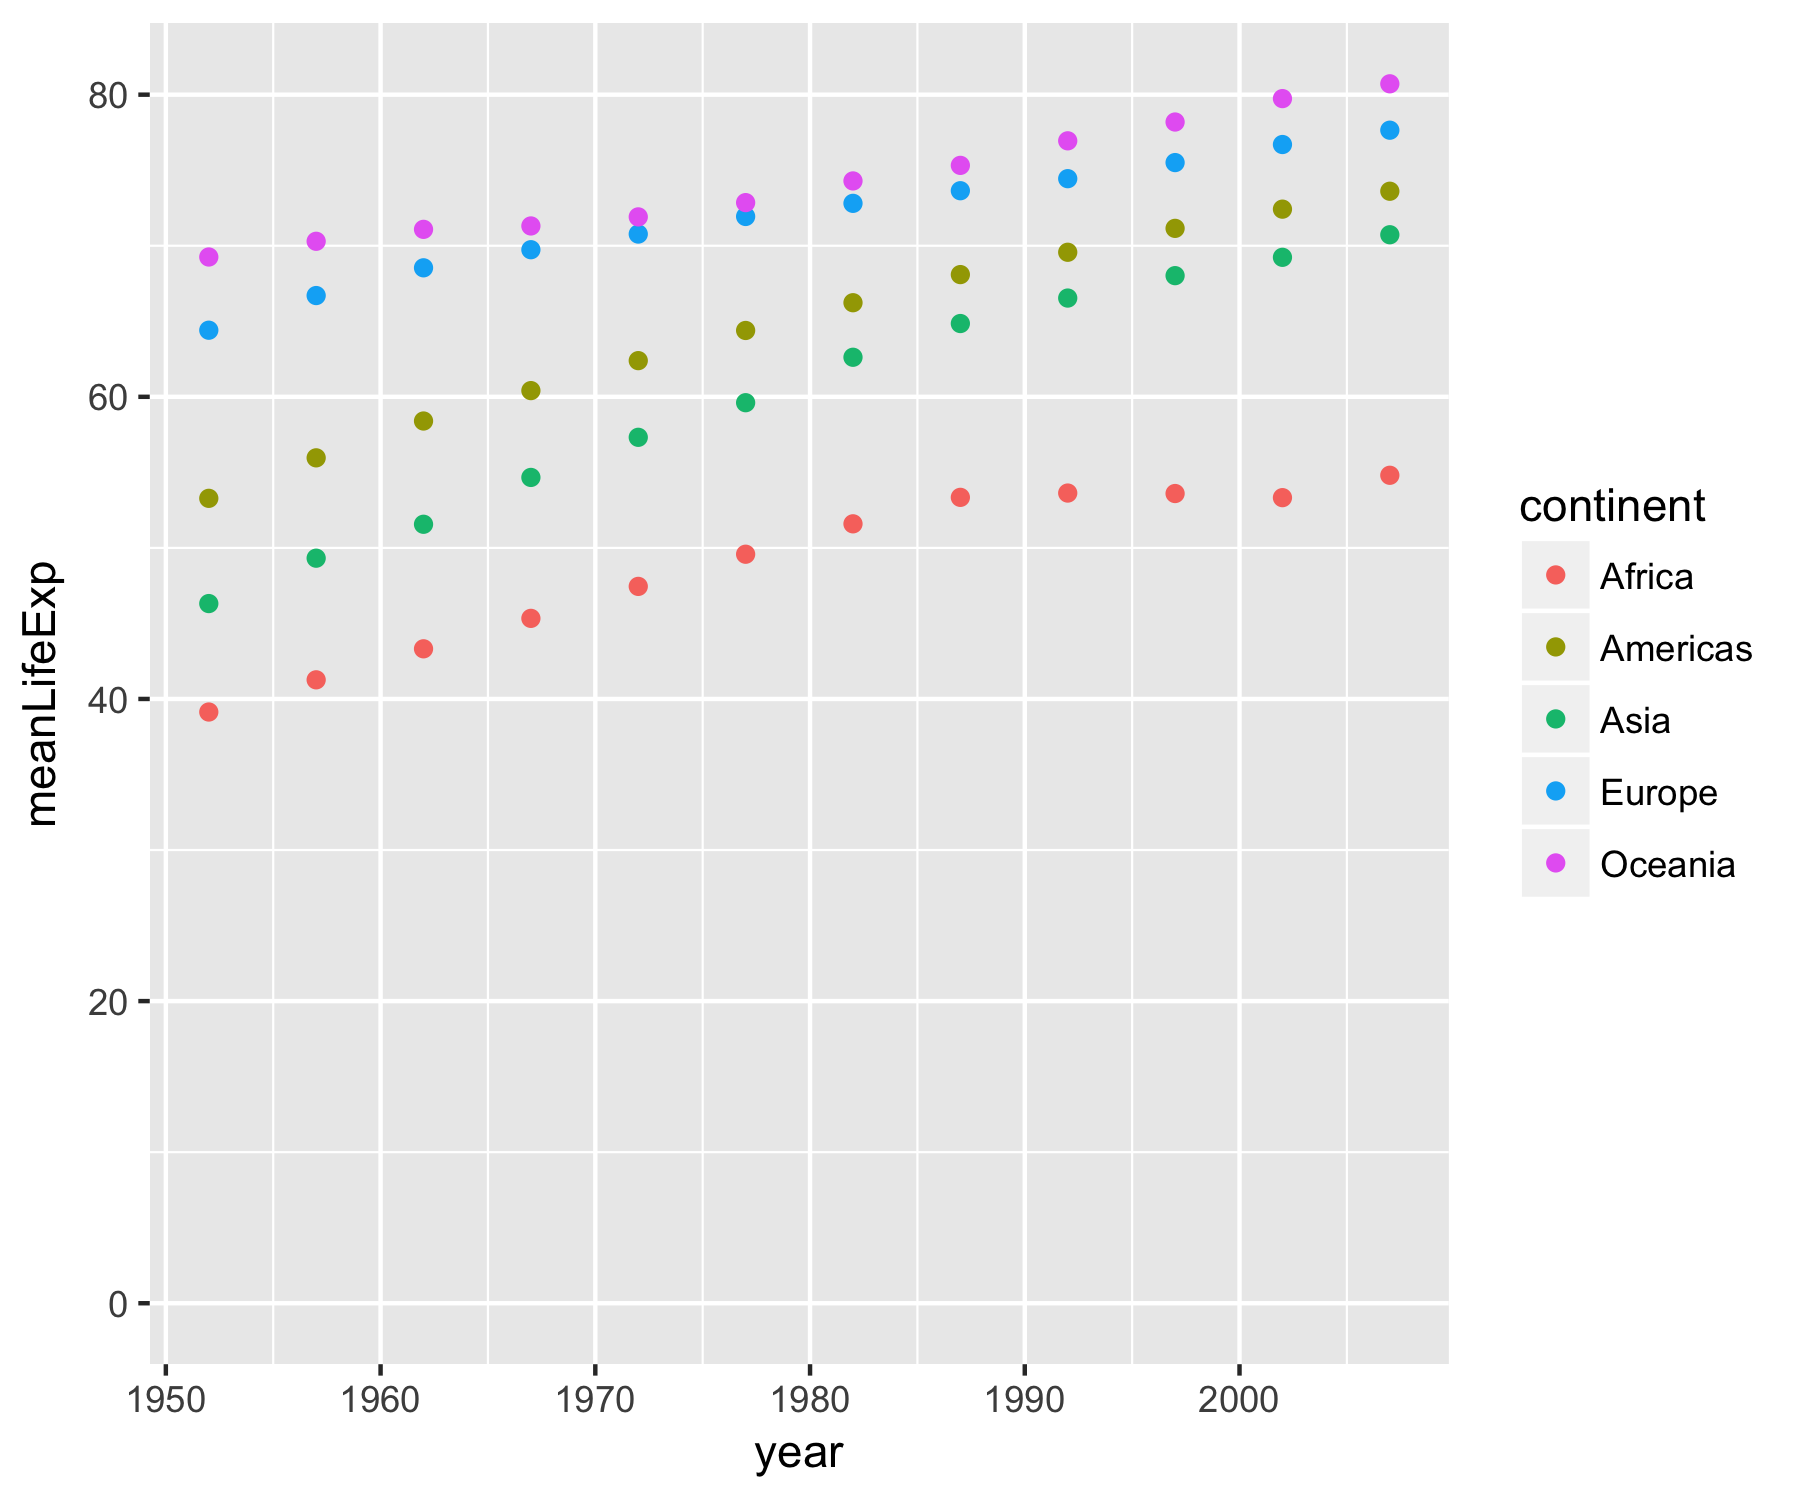
geom_point()
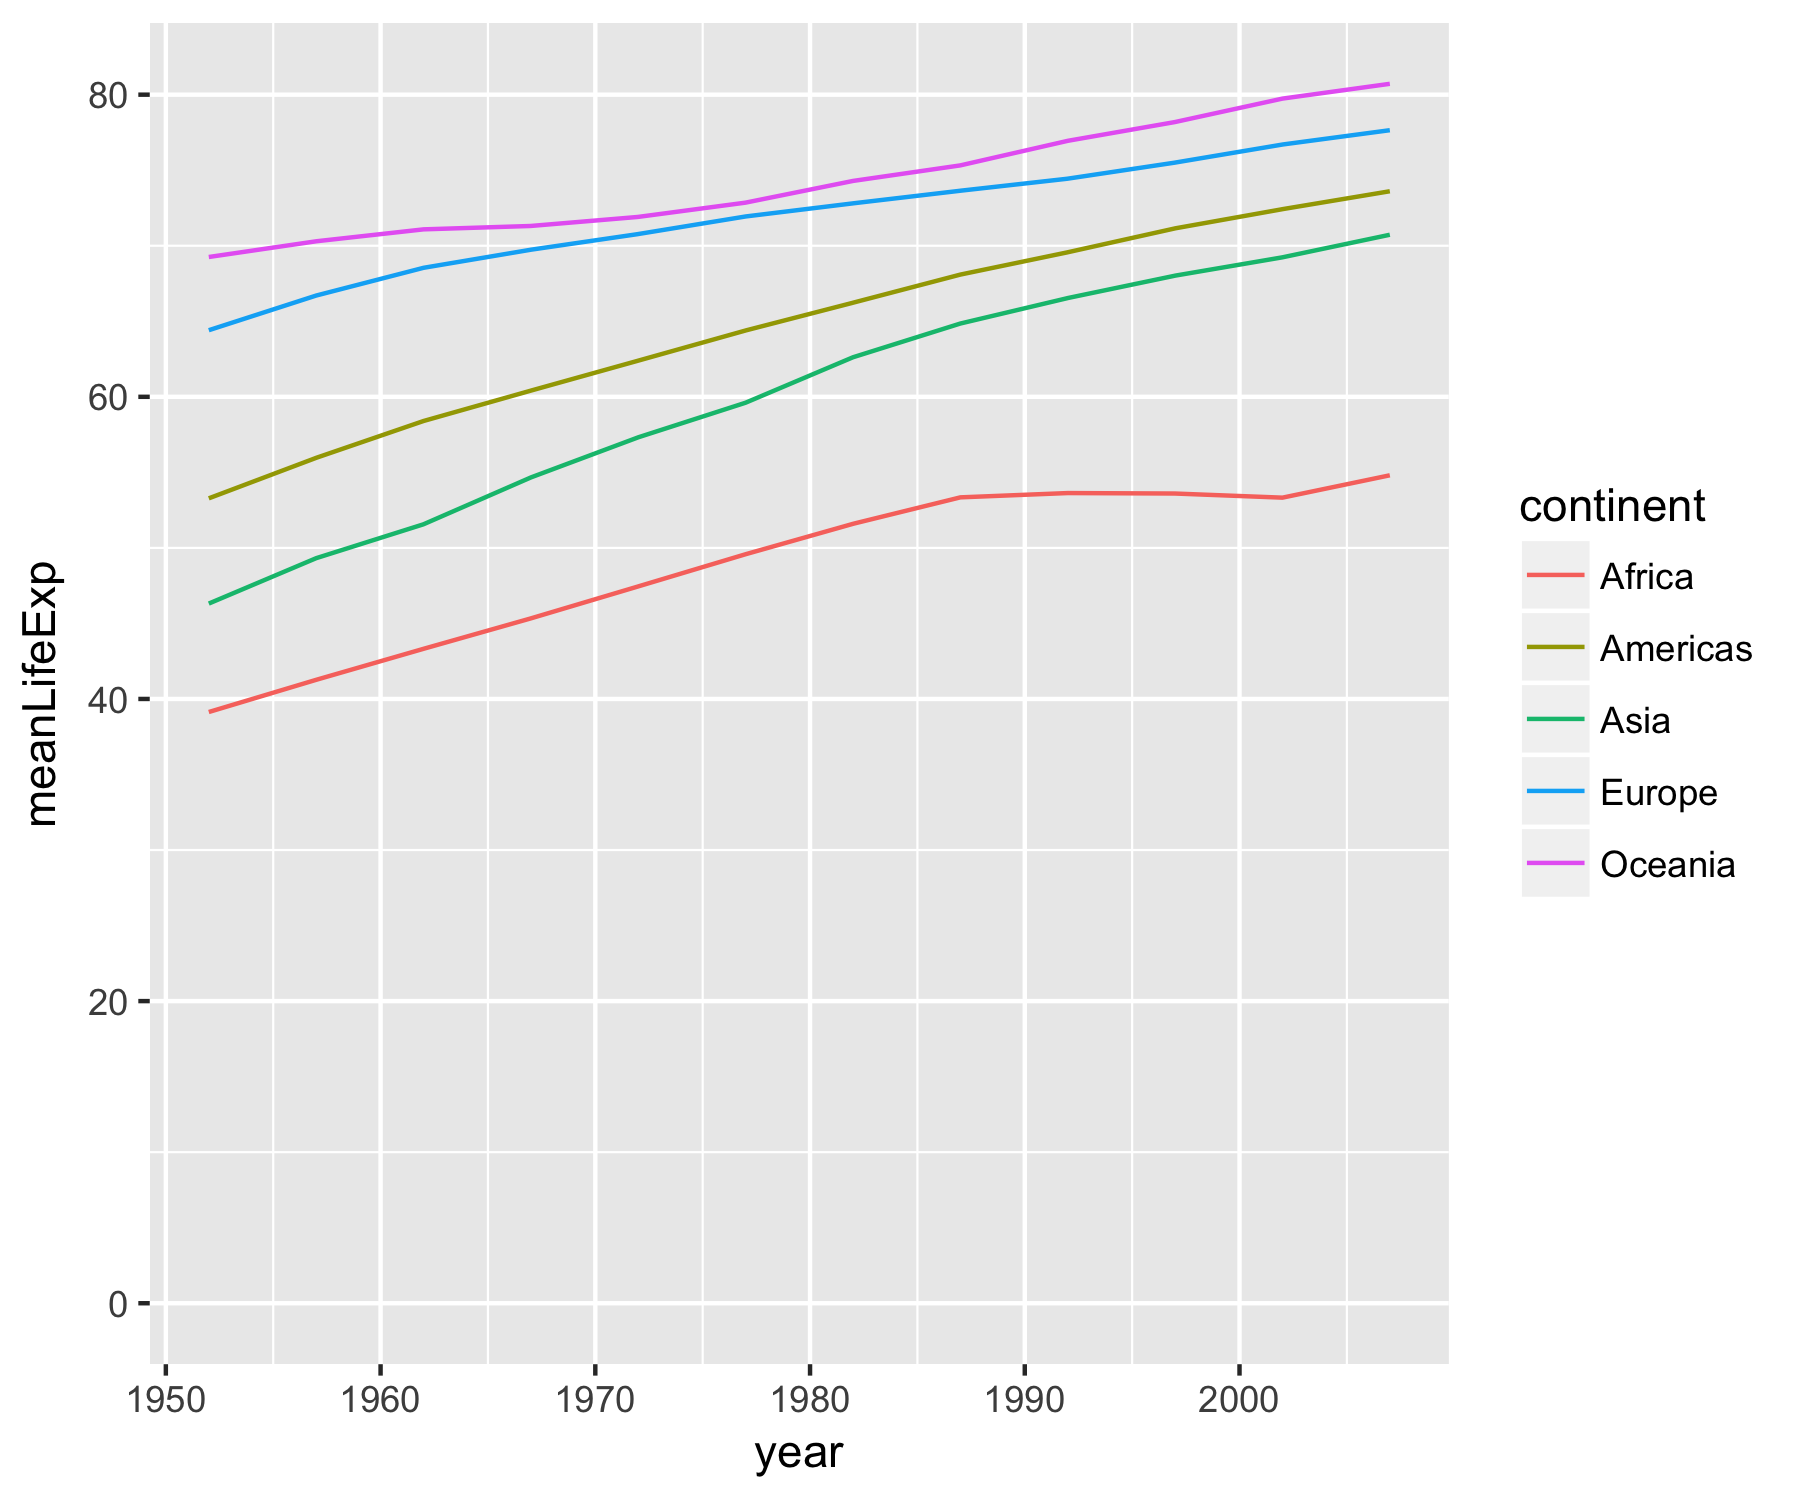
geom_line()
Line plot
ggplot(year_continent, aes(x = year, y = meanLifeExp, color = continent)) +
  geom_line() +
  expand_limits(y = 0)

