Sonuç
Tidyverse’a Giriş

David Robinson
Chief Data Scientist, DataCamp
R ile veriyi dönüştürme ve görselleştirme
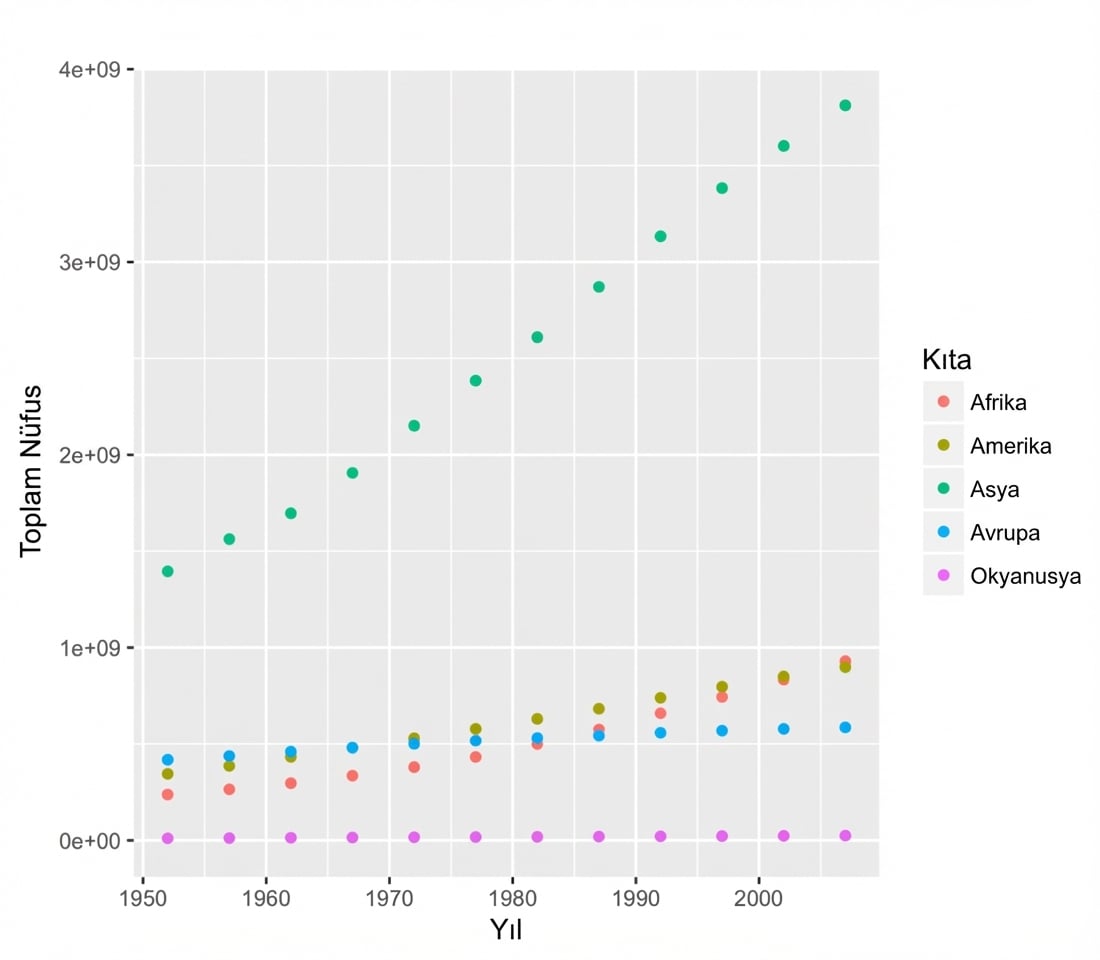
ggplot(by_year_continent, aes(x = year, y = totalPop, color = continent)) +
    geom_point() +
    expand_limits(y = 0)
Tidyverse’a Giriş
David Robinson
Chief Data Scientist, DataCamp
ggplot(by_year_continent, aes(x = year, y = totalPop, color = continent)) +
geom_point() +
expand_limits(y = 0)

