Attenzione alla correlazione
Introduzione alla statistica in R

Maggie Matsui
Content Developer, DataCamp
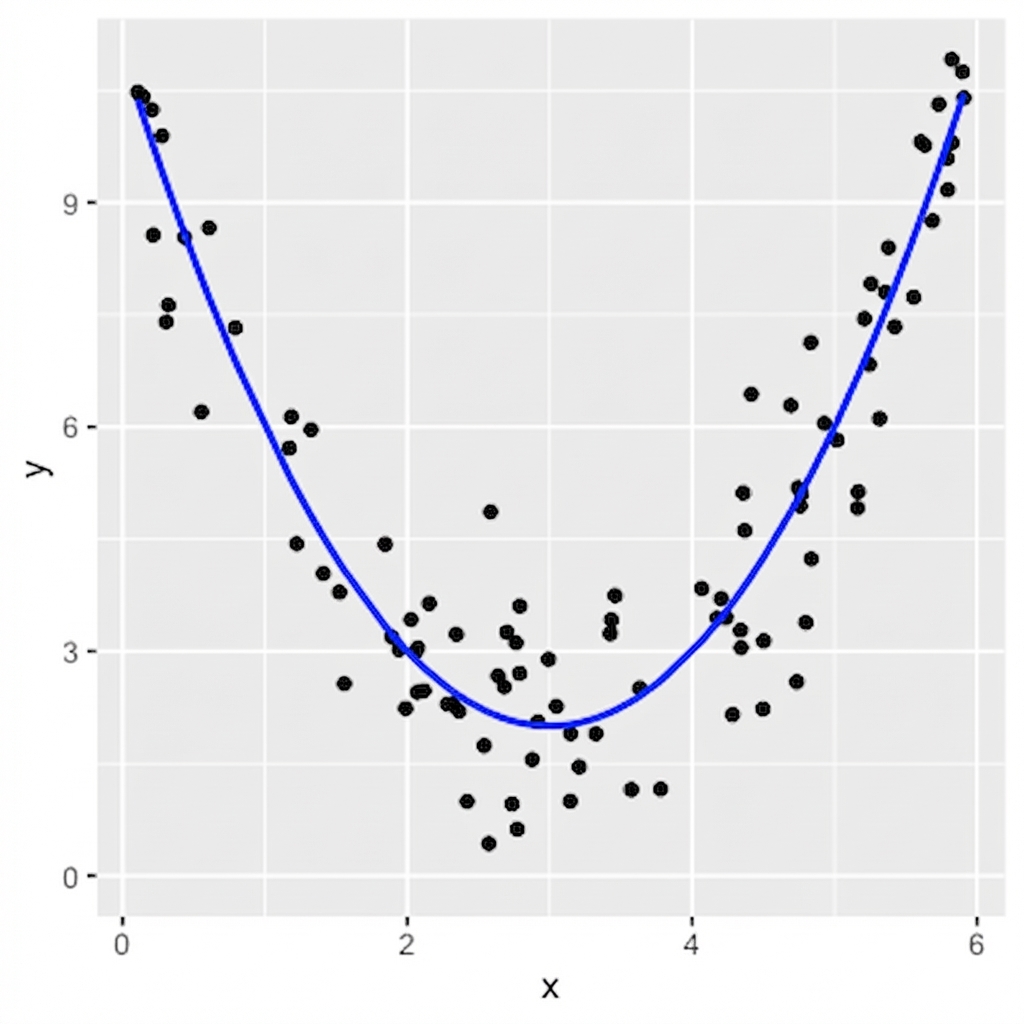
Relazioni non lineari
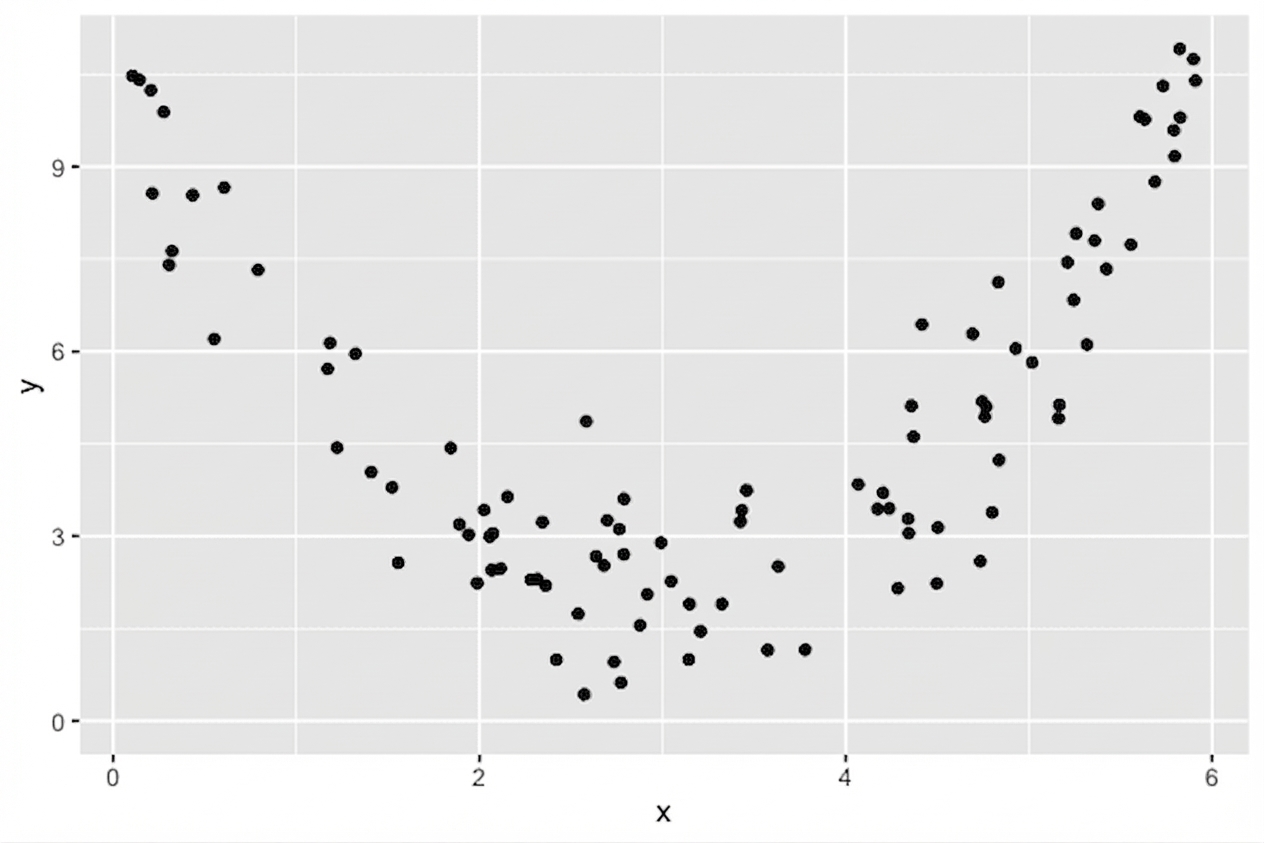
$$r = 0.18$$
Relazioni non lineari
Cosa vediamo:
Cosa vede il coefficiente di correlazione:
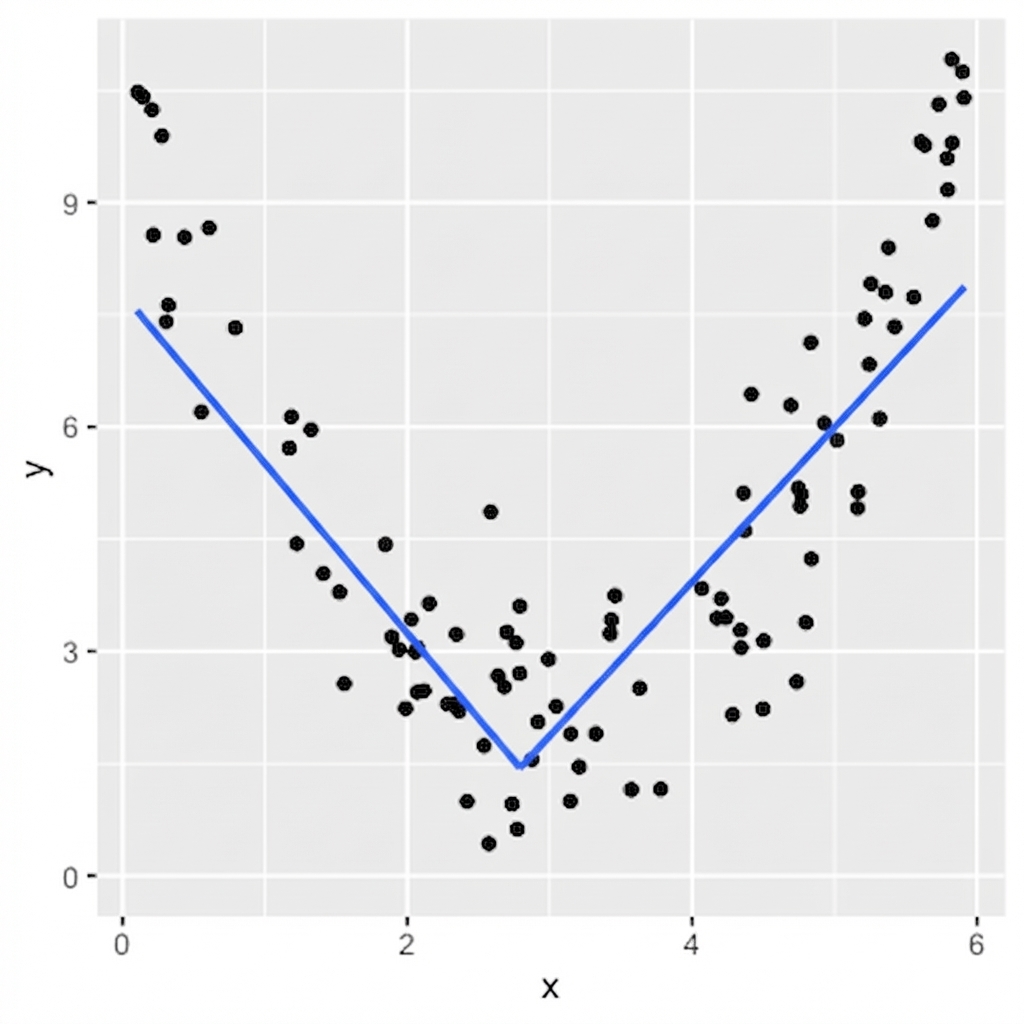
La correlazione coglie solo relazioni lineari
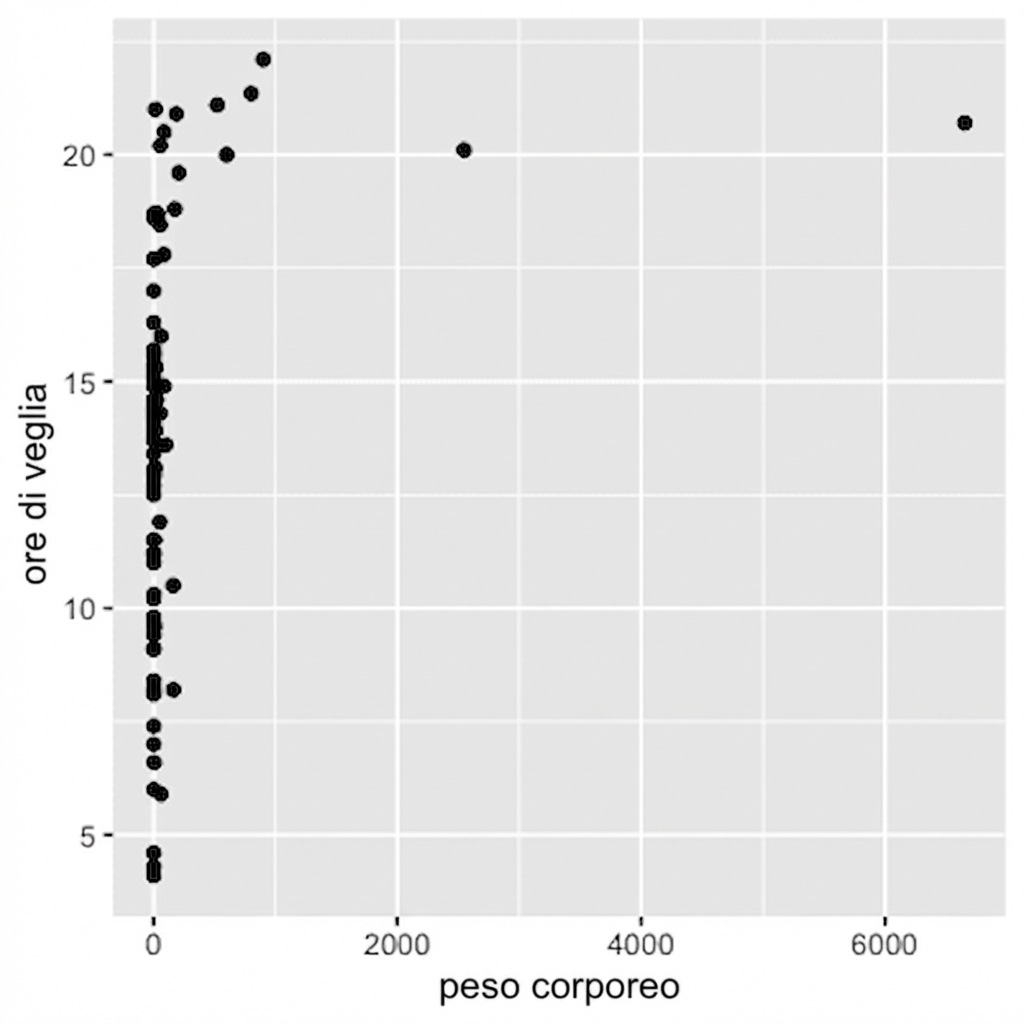
Visualizza sempre i dati
Peso corporeo vs tempo da svegli
Distribuzione del peso corporeo
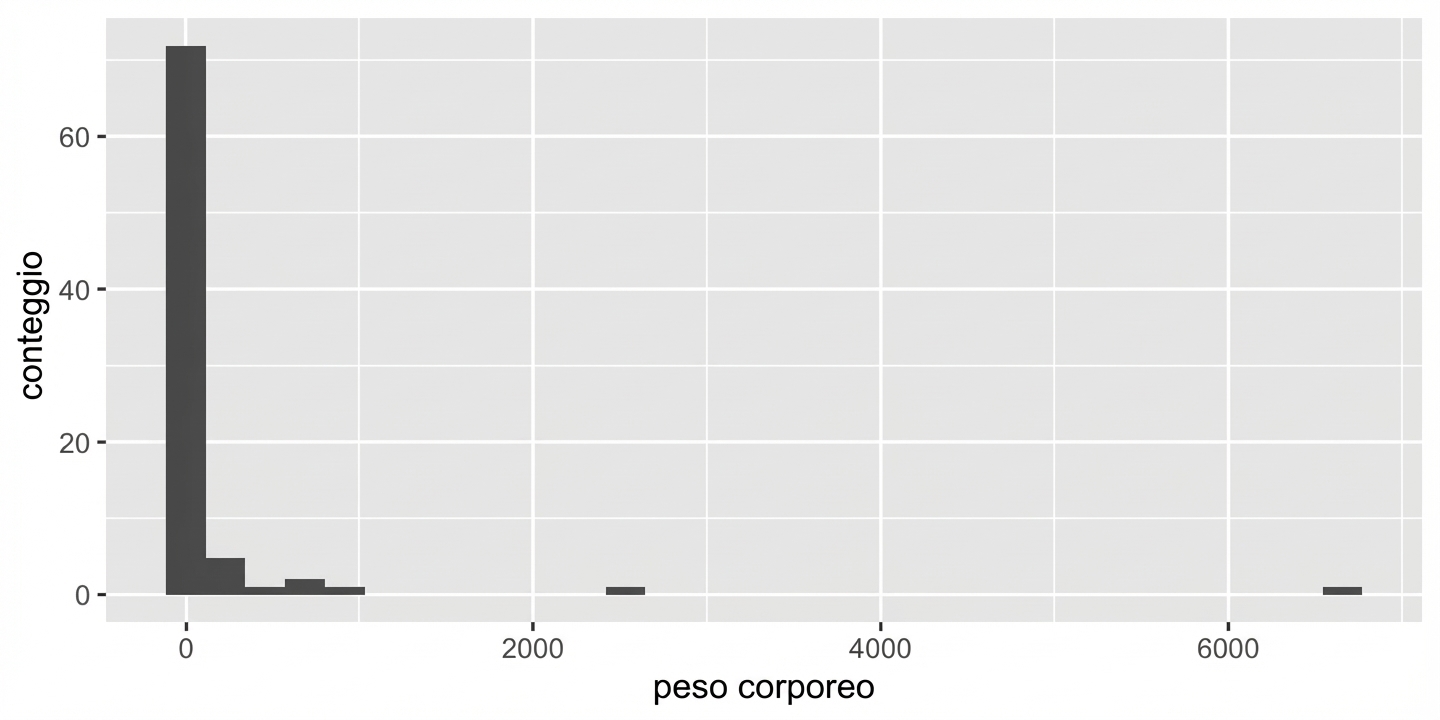
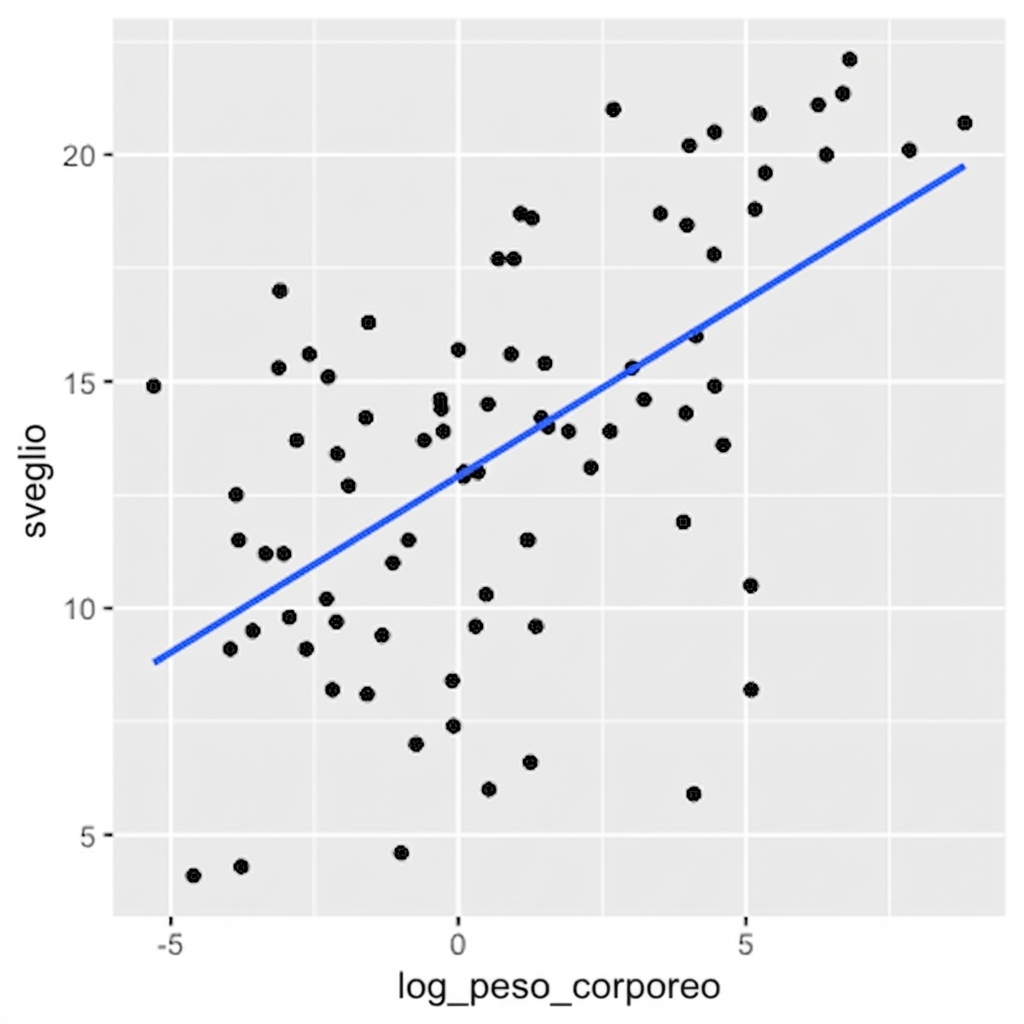
Trasformazione log
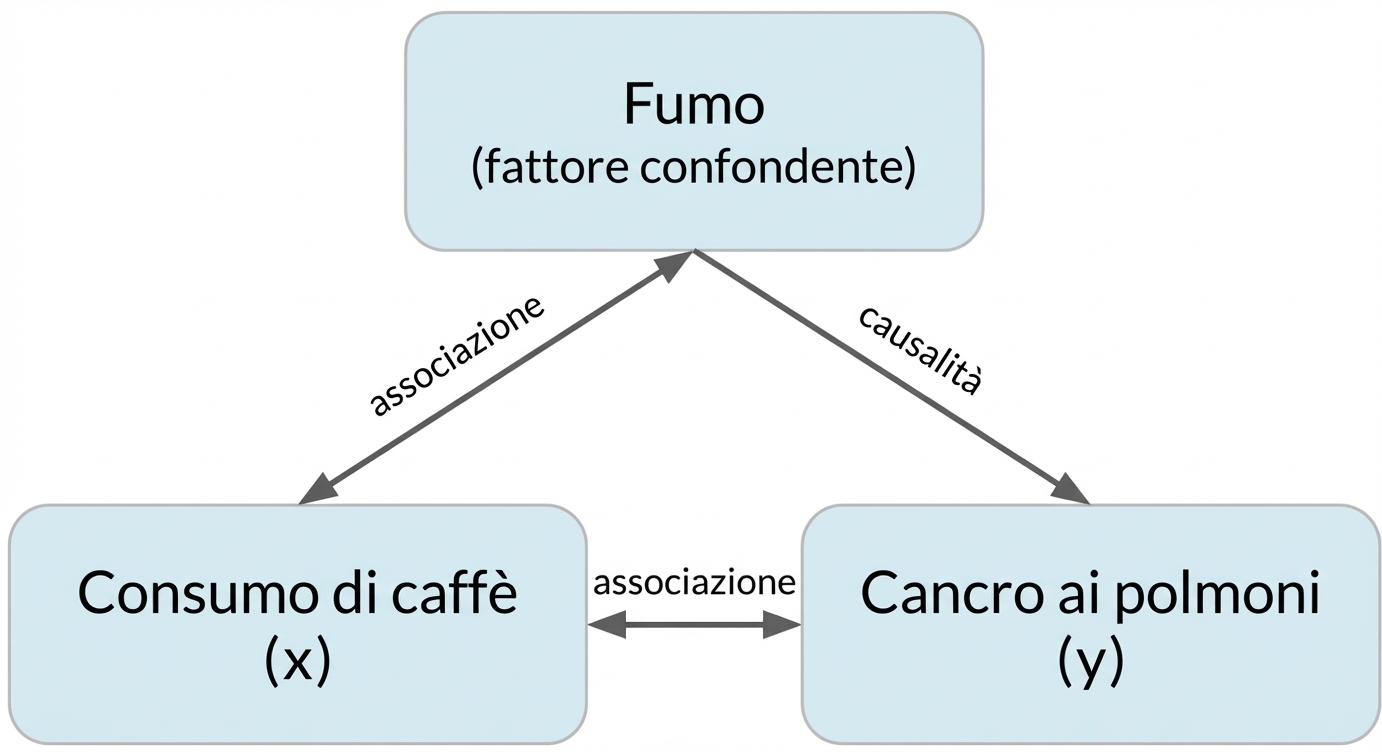
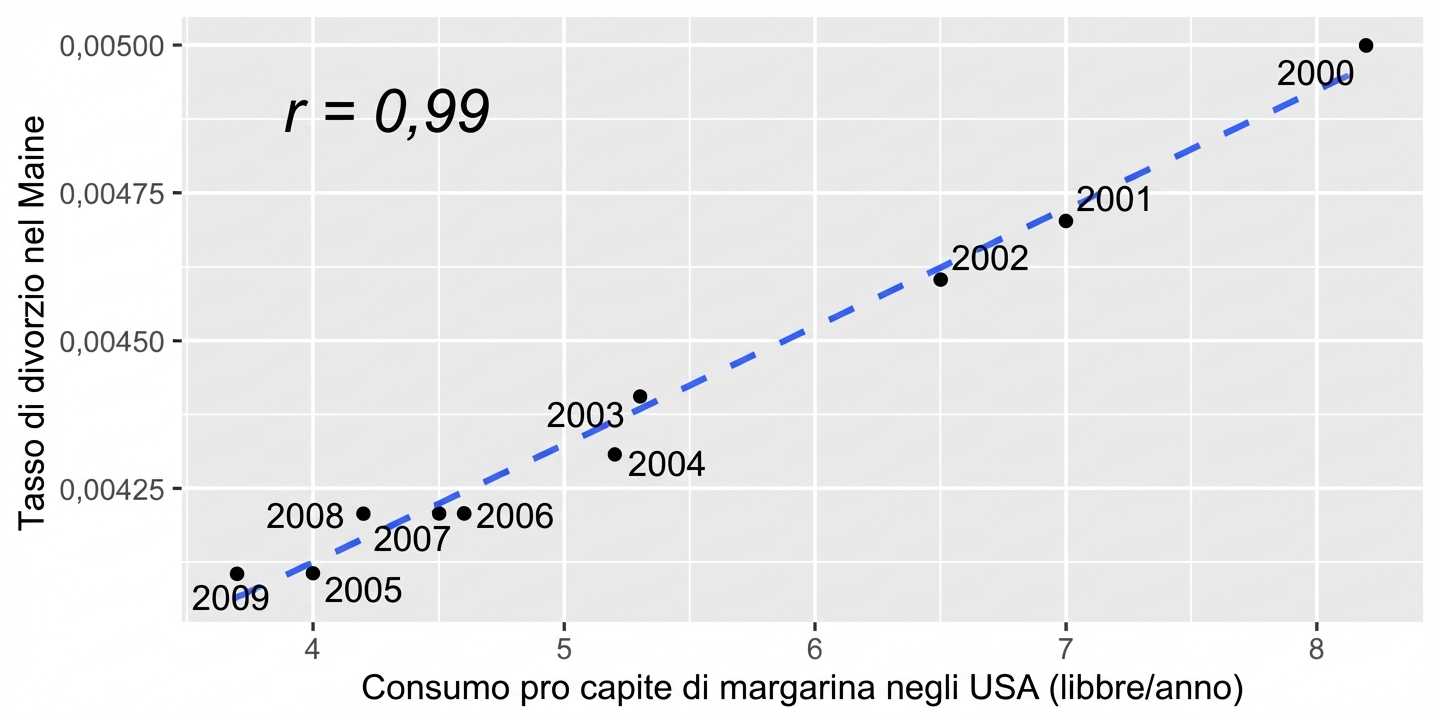
La correlazione non implica causalità
x è correlata a y non significa x causa y
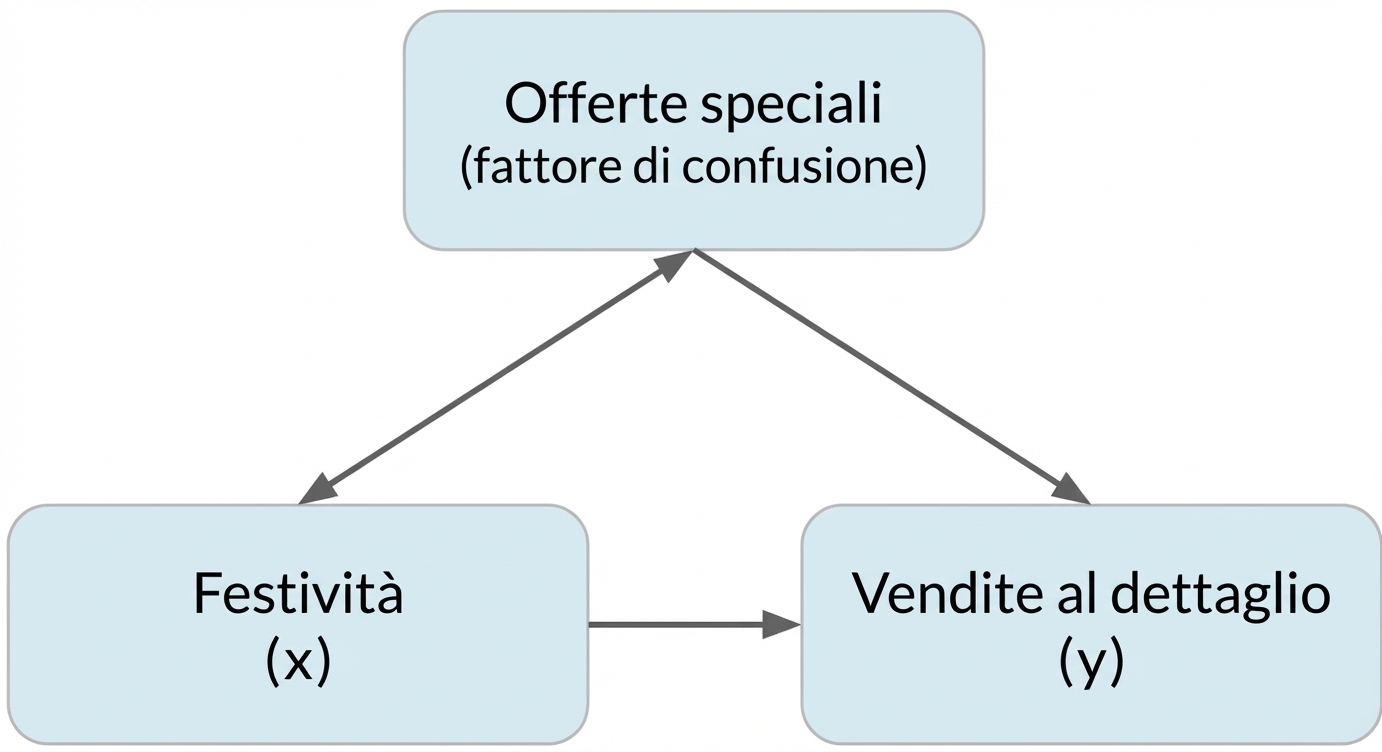
Confondimento
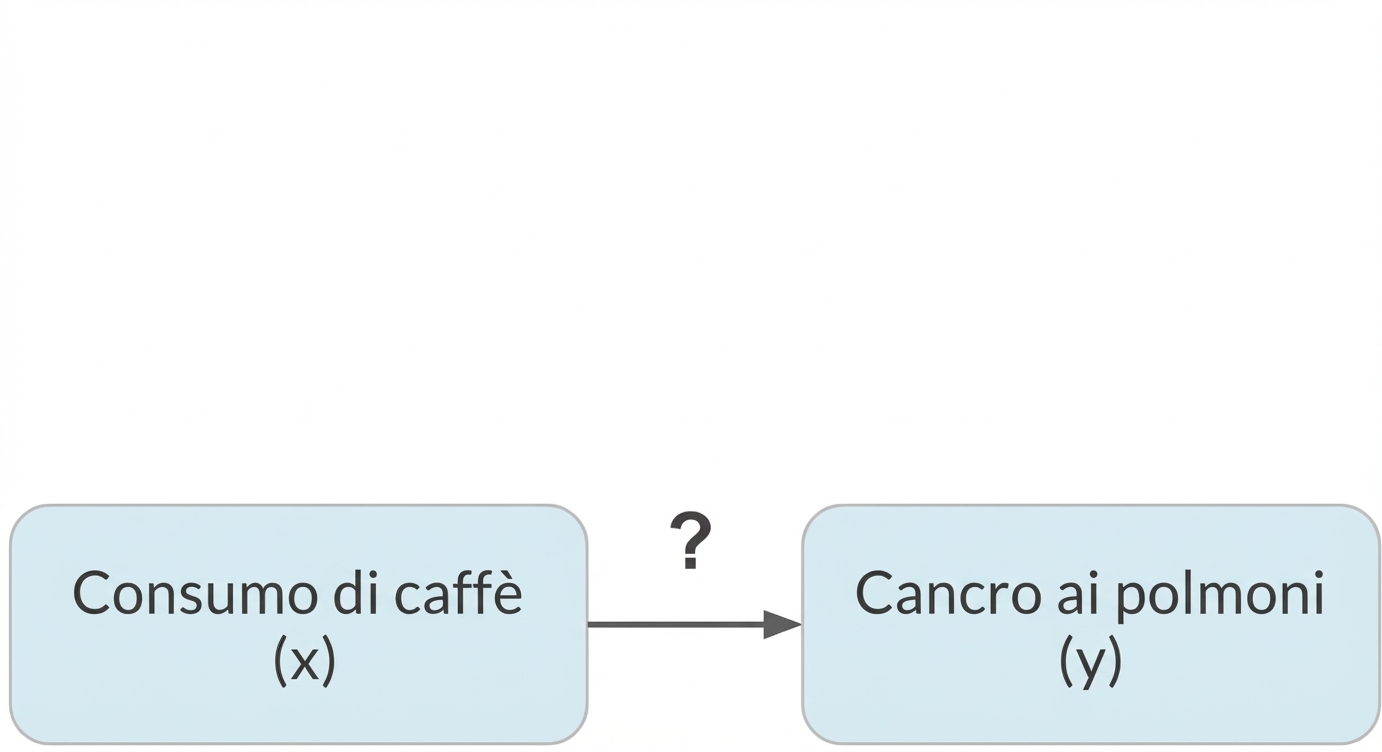
Confondimento
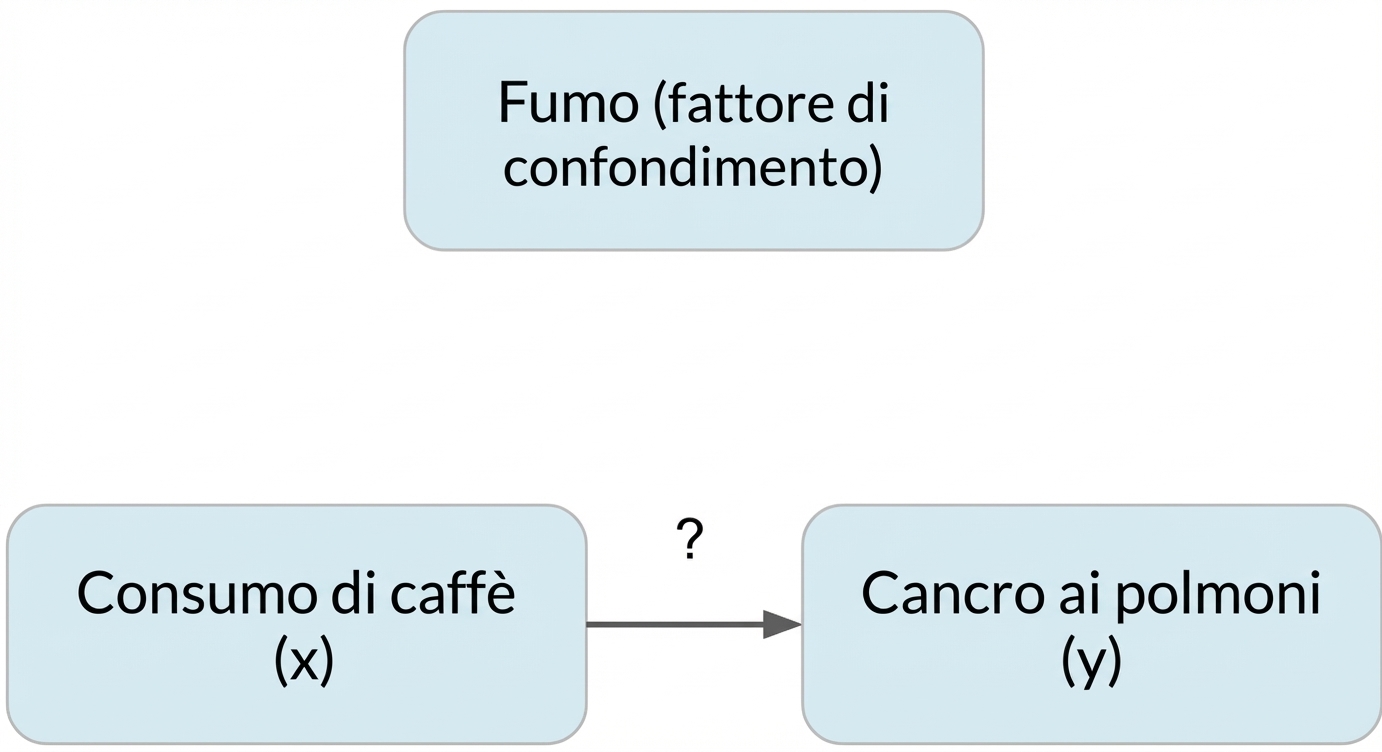
Confondimento
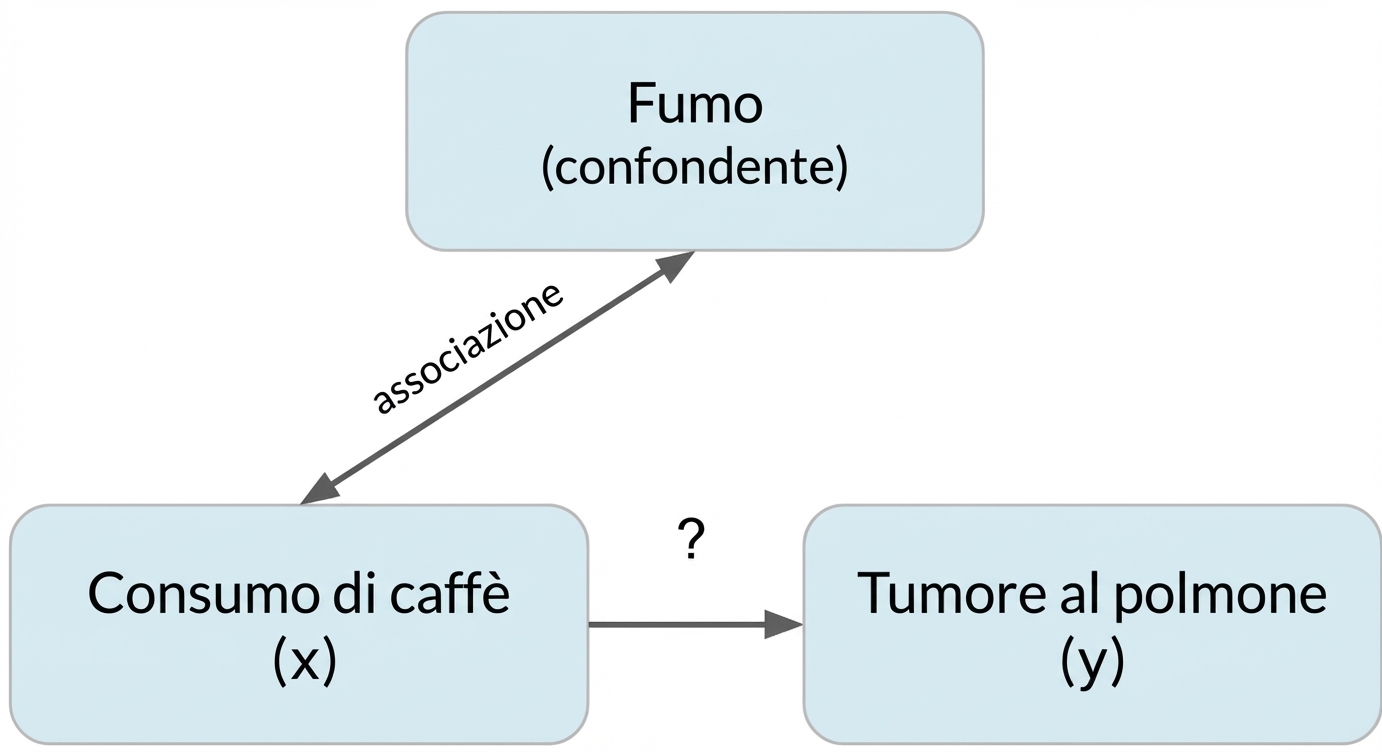
Confondimento
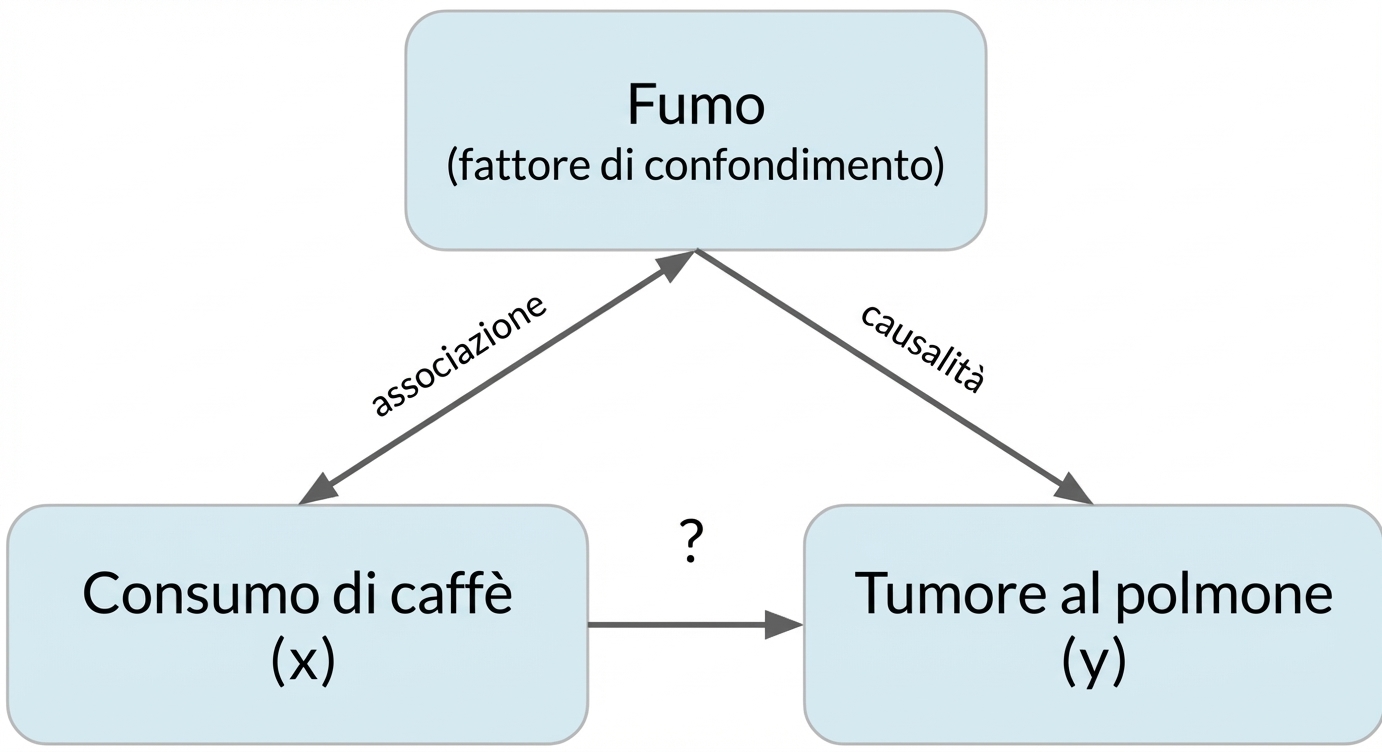
Confondimento