Distribuzioni continue
Introduzione alla statistica in R

Maggie Matsui
Content Developer, DataCamp
Aspettando l'autobus
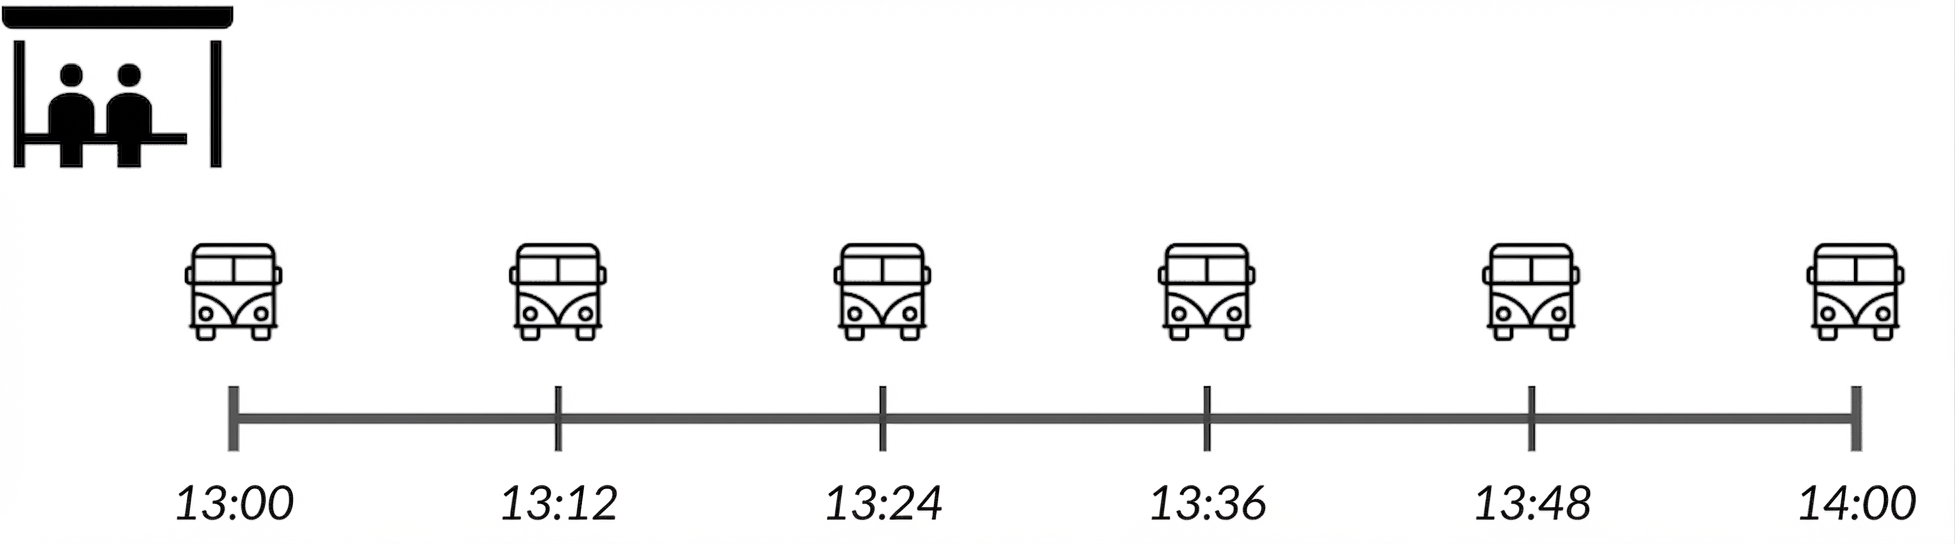
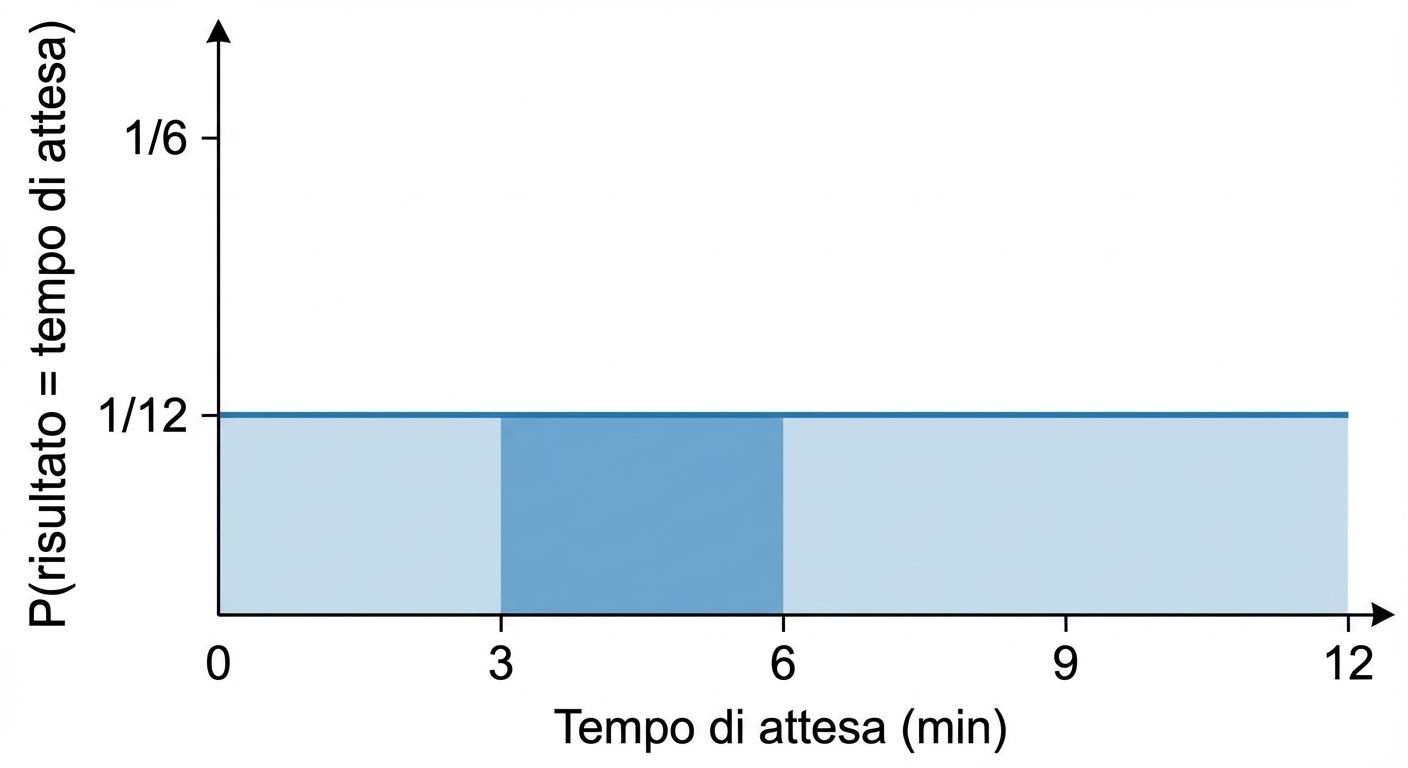
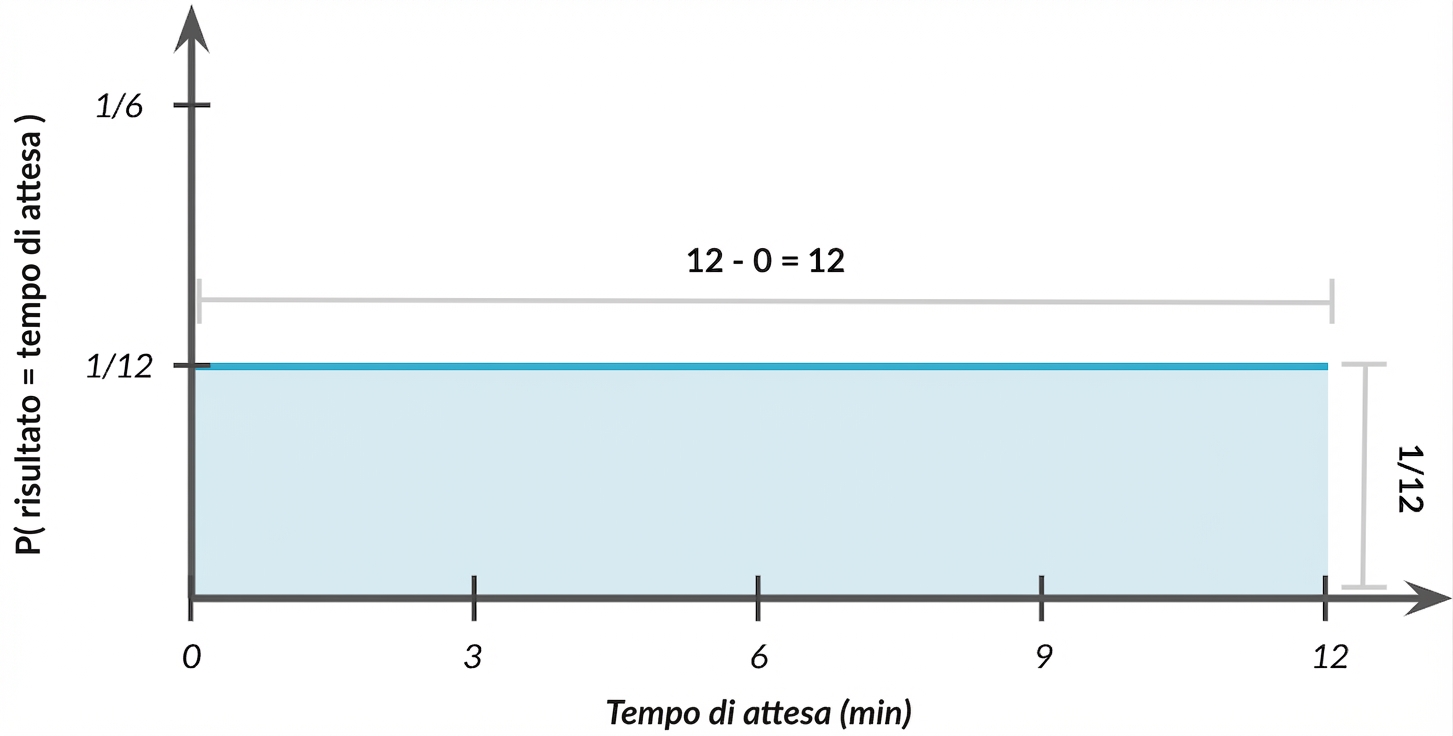
Distribuzione uniforme continua
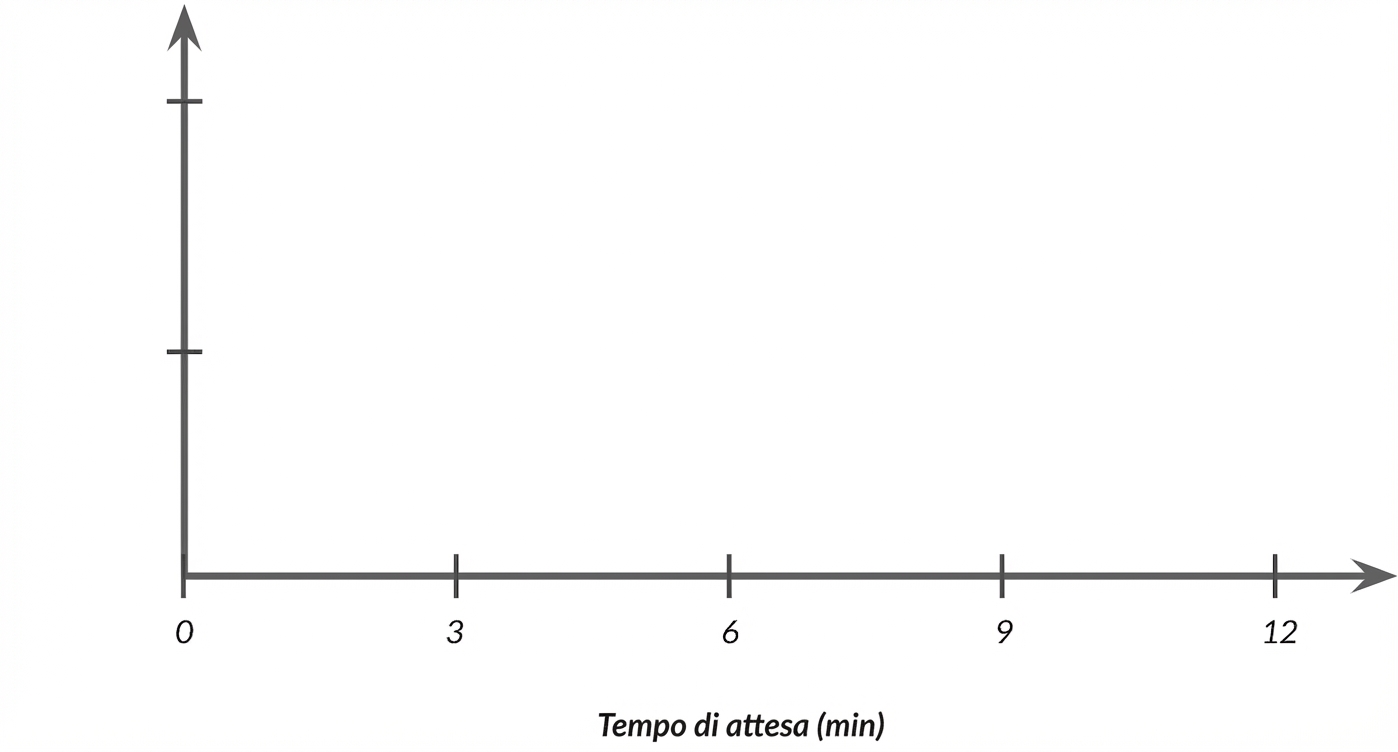
Distribuzione uniforme continua
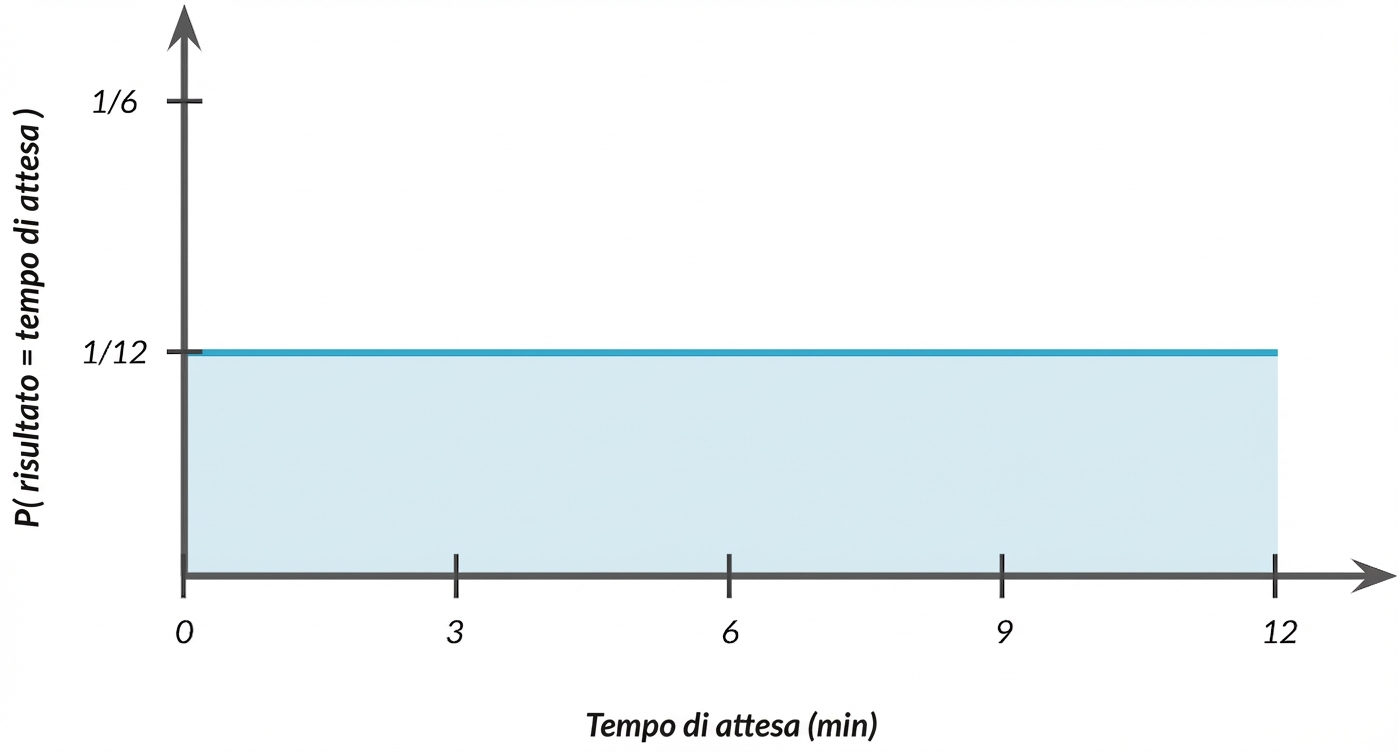
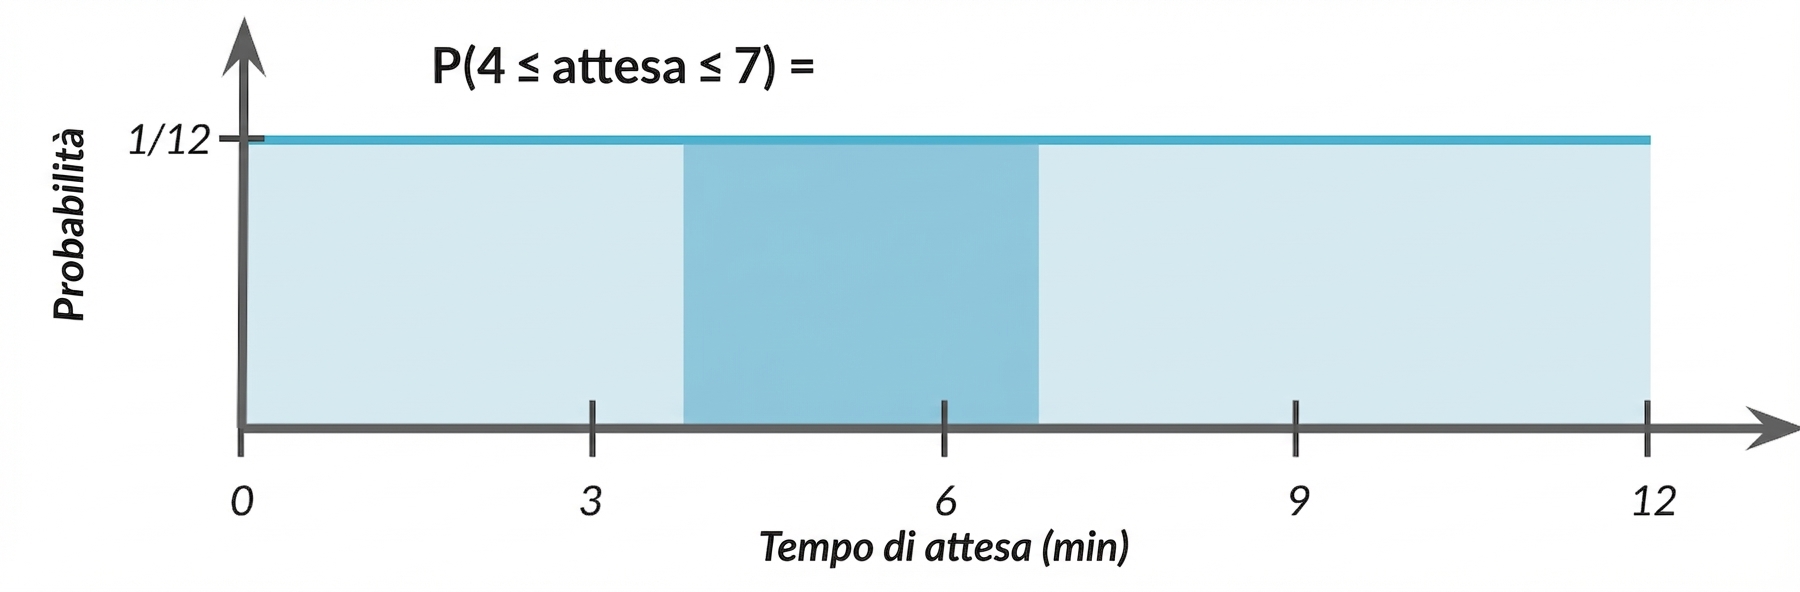
Probabilità = area
$$P(4 \le \text{wait time} \le 7) = ~~ ?$$
Probabilità = area
$$P(4 \le \text{wait time} \le 7) = ~~ ?$$
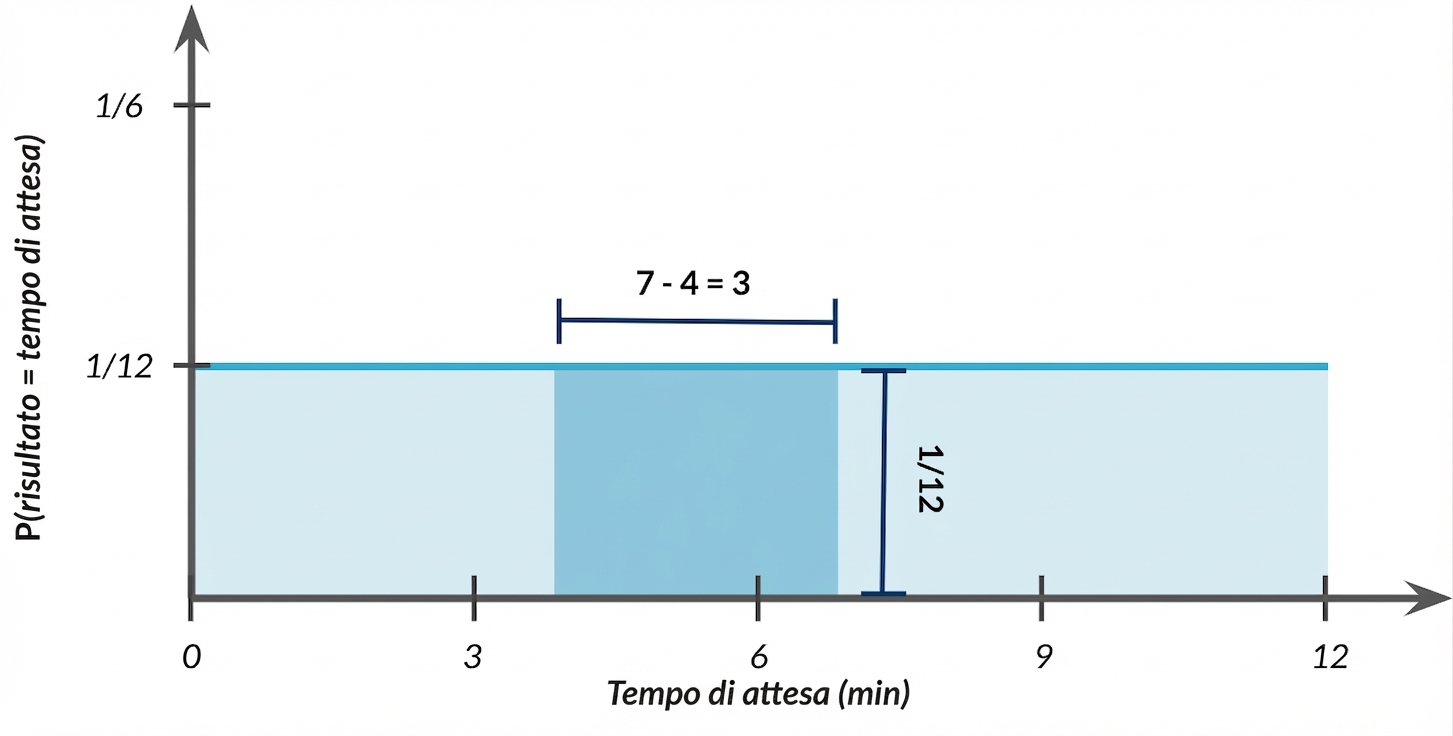
Probabilità = area
$$P(4 \le \text{wait time} \le 7) = 3 \times 1/12 = 3/12$$
Distribuzione uniforme in R
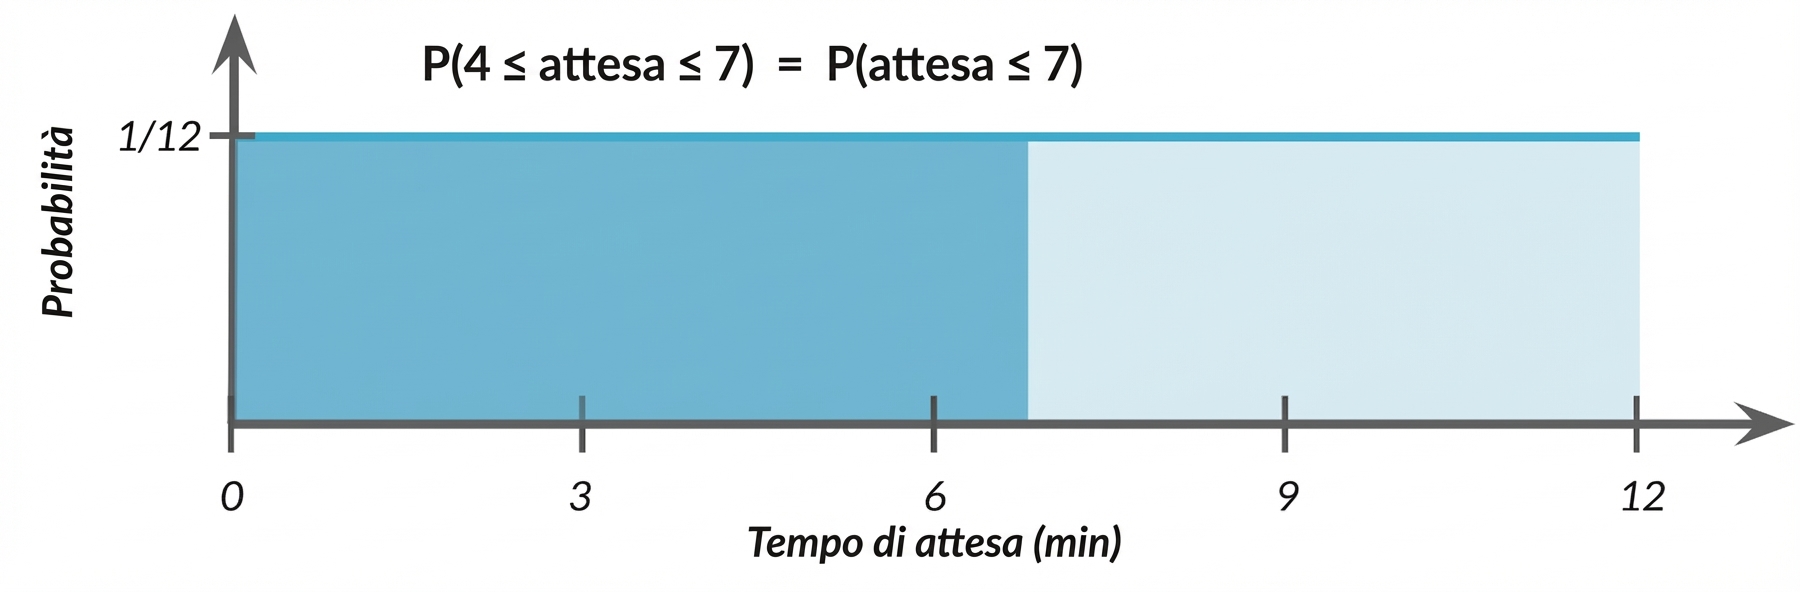
$$ P(\text{wait time} \le 7)$$
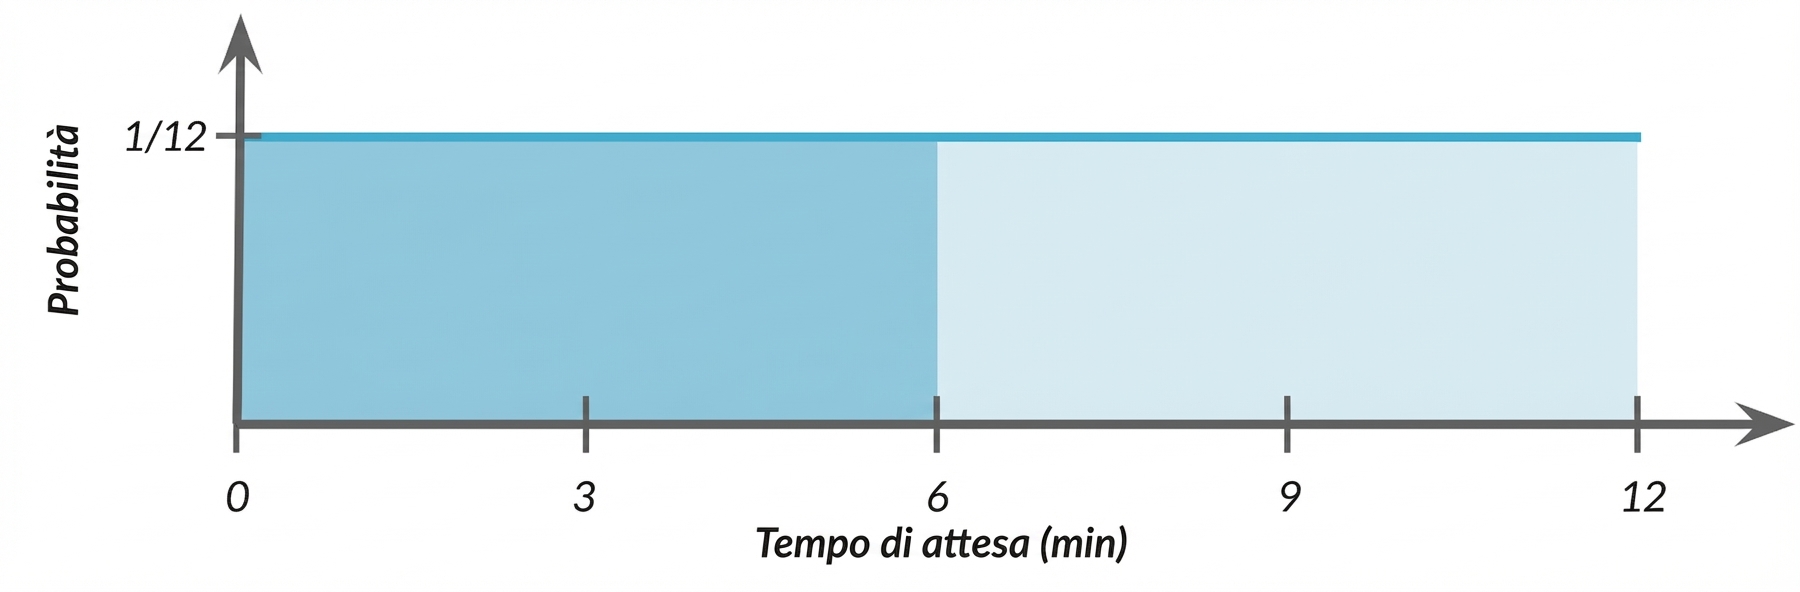
punif(7, min = 0, max = 12)
0.5833333
lower.tail
$$ P(\text{wait time} \ge 7)$$
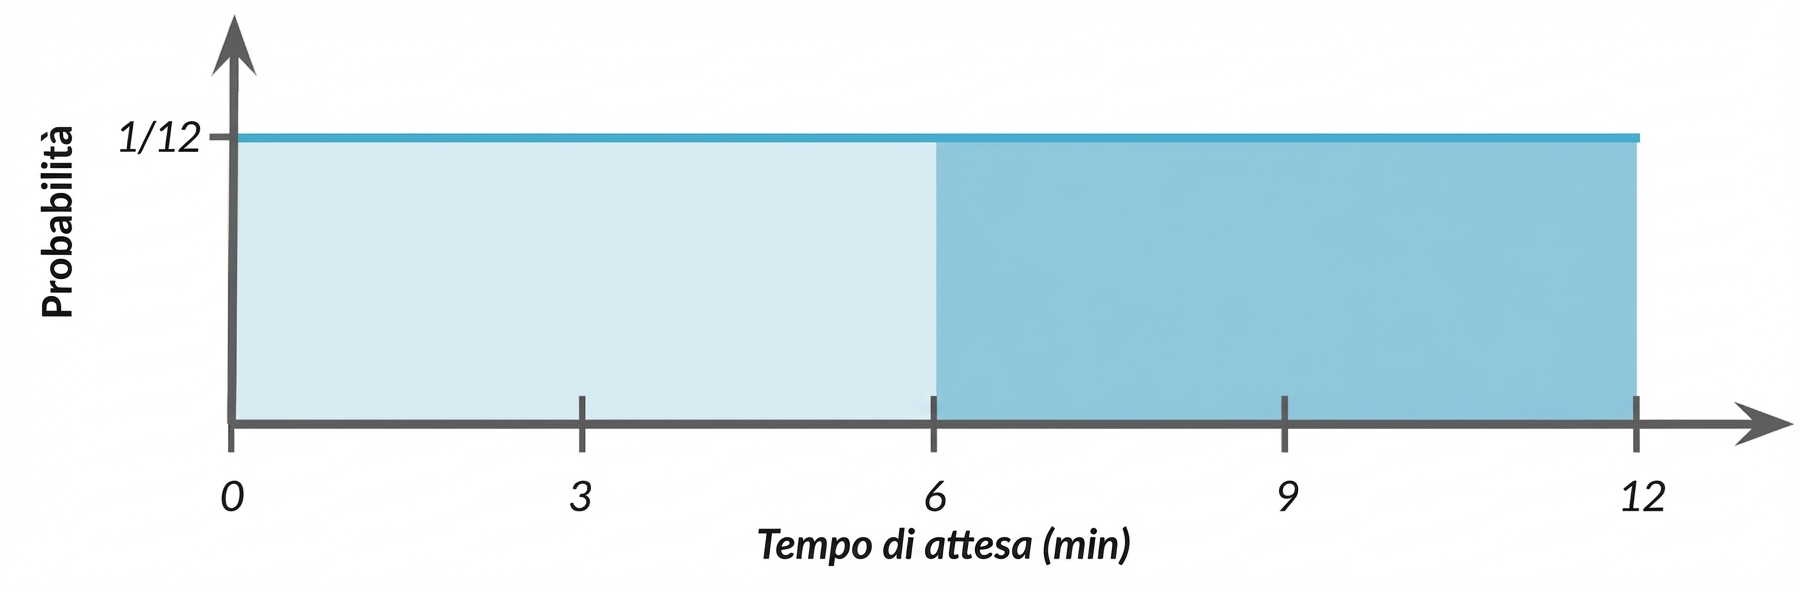
punif(7, min = 0, max = 12, lower.tail = FALSE)
0.4166667
$$ P(4 \le \text{wait time} \le 7)$$
$$ P(4 \le \text{wait time} \le 7)$$
$$ P(4 \le \text{wait time} \le 7)$$
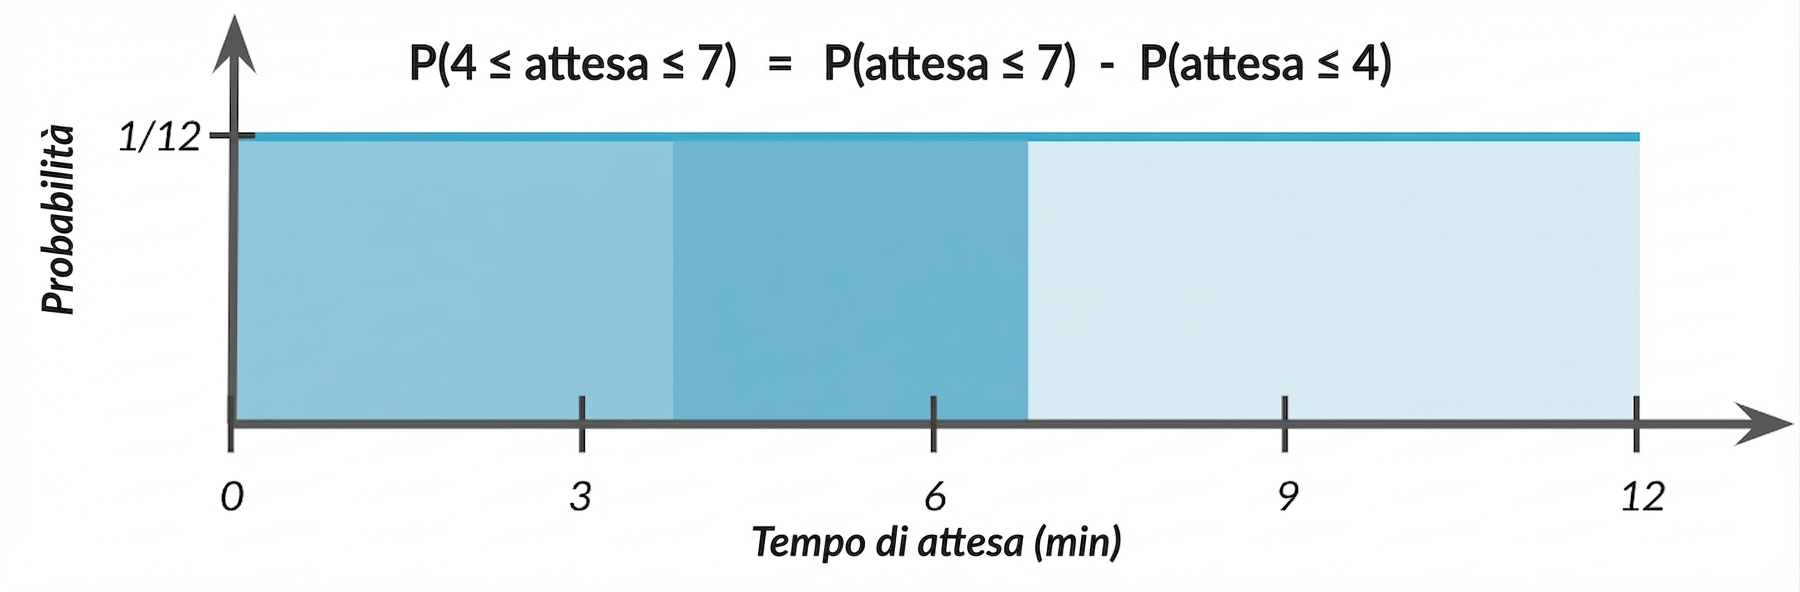
punif(7, min = 0, max = 12) - punif(4, min = 0, max = 12)
0.25
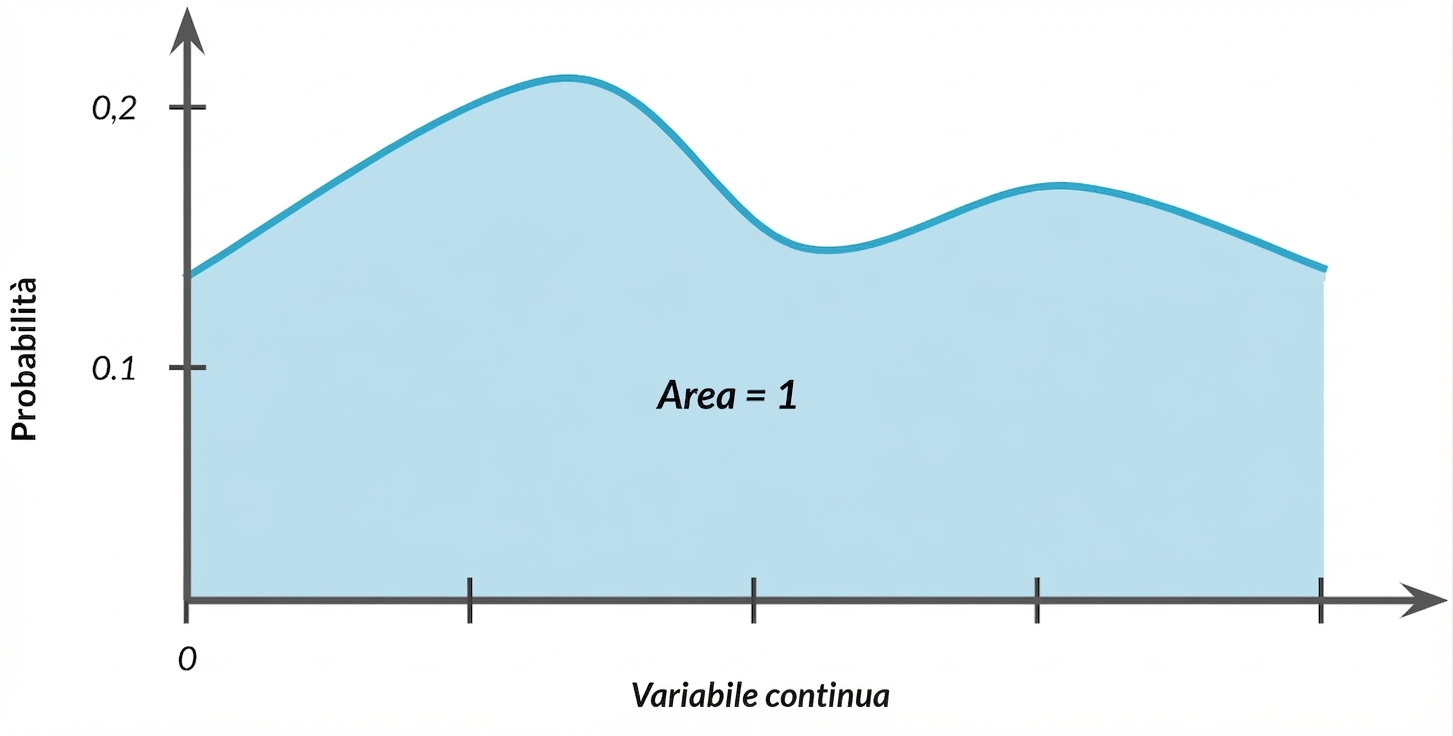
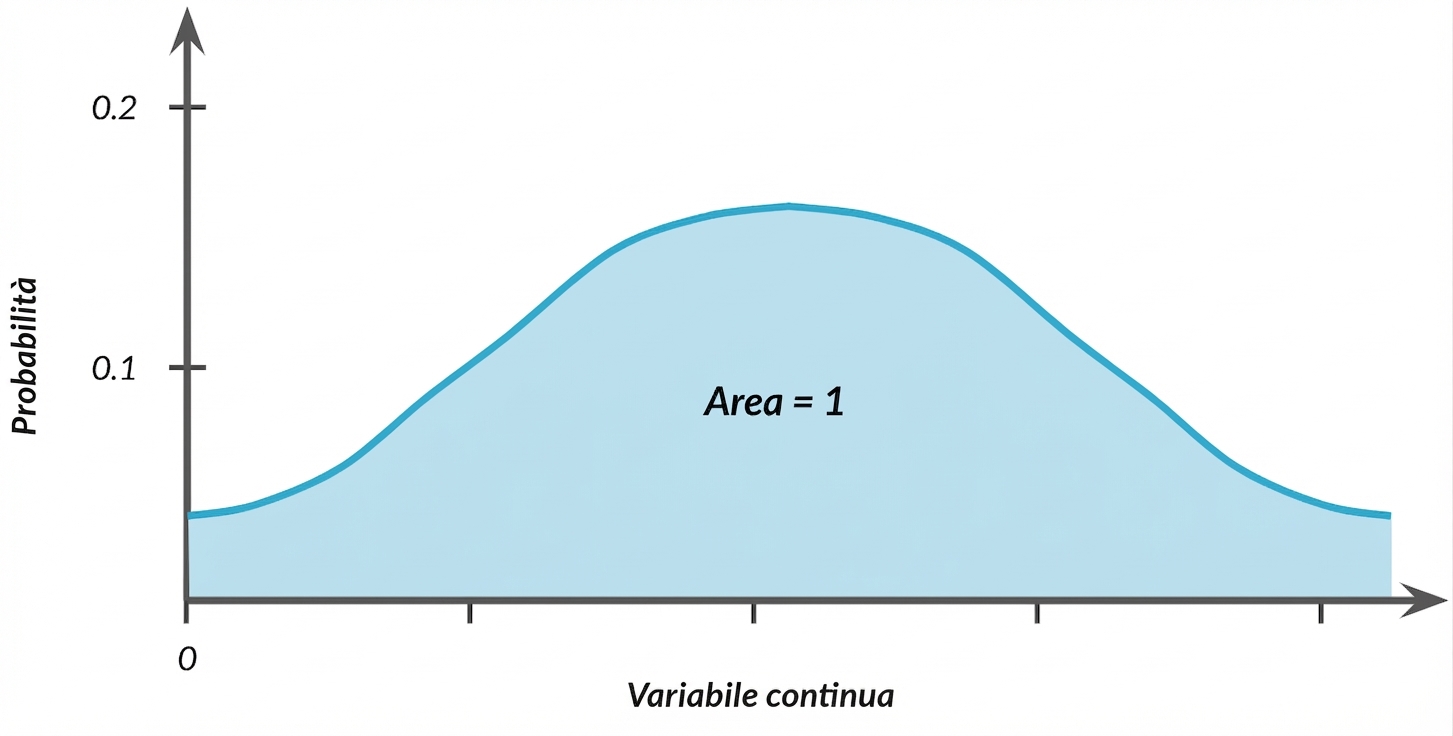
Area totale = 1
$$P(0 \le \text{wait time} \le 12) = ~~ ?$$
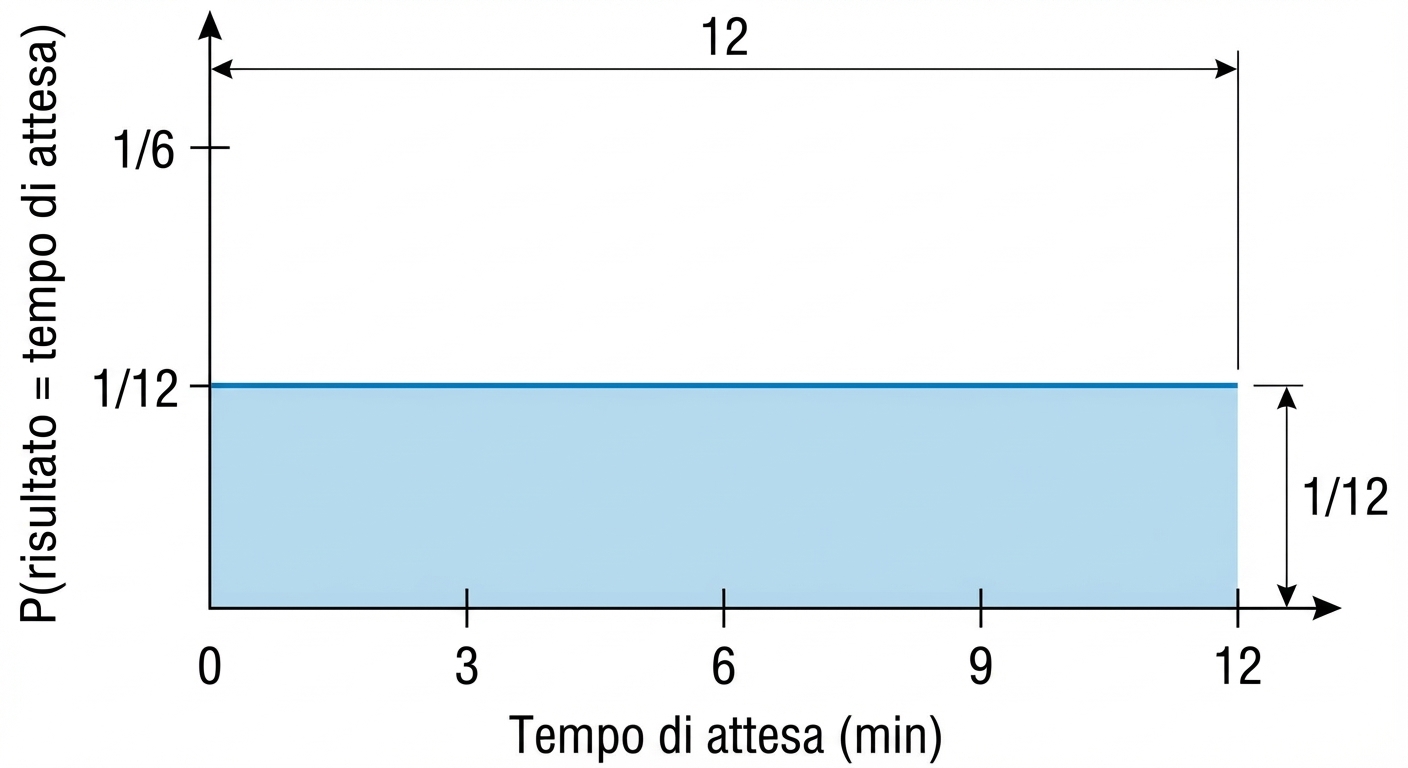
Area totale = 1
$$P(0 \le \text{outcome} \le 12) = 12 \times 1/12 = 1$$
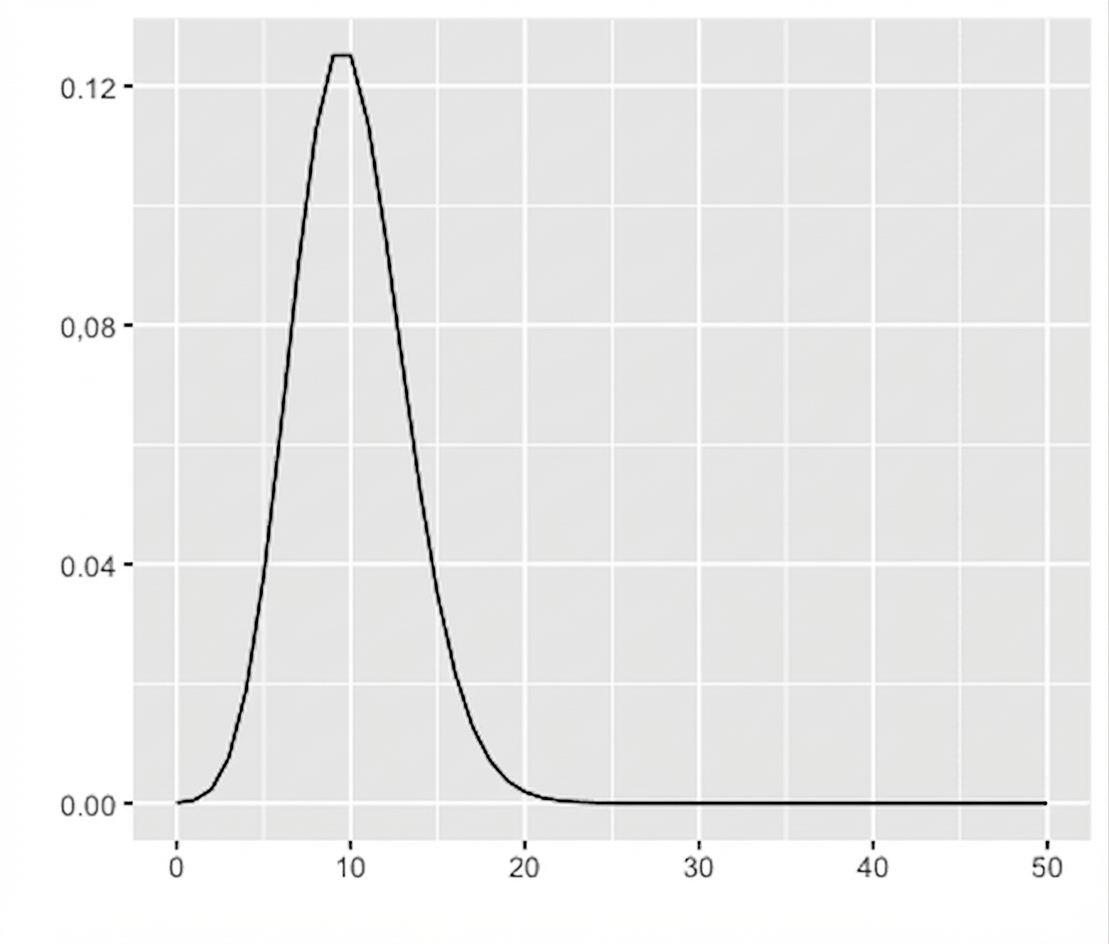
Altre distribuzioni continue
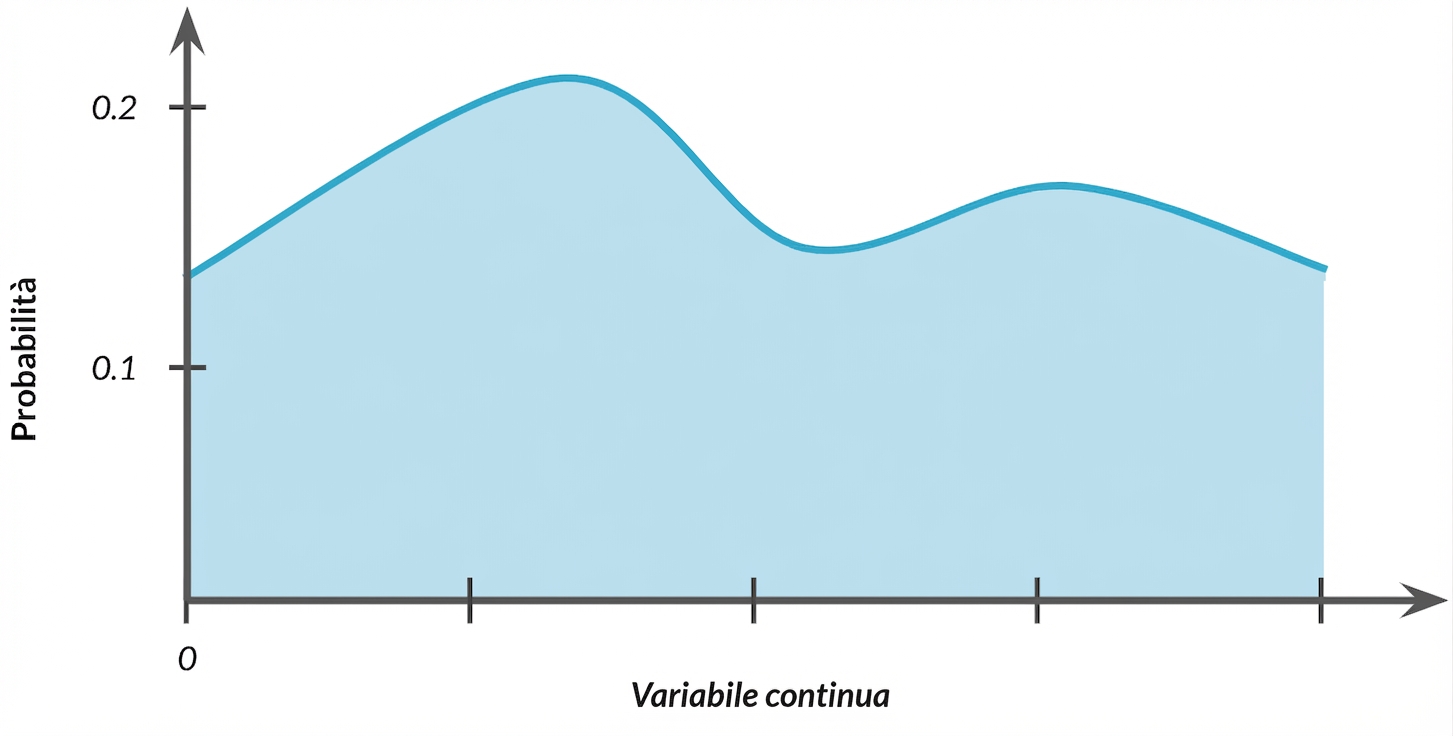
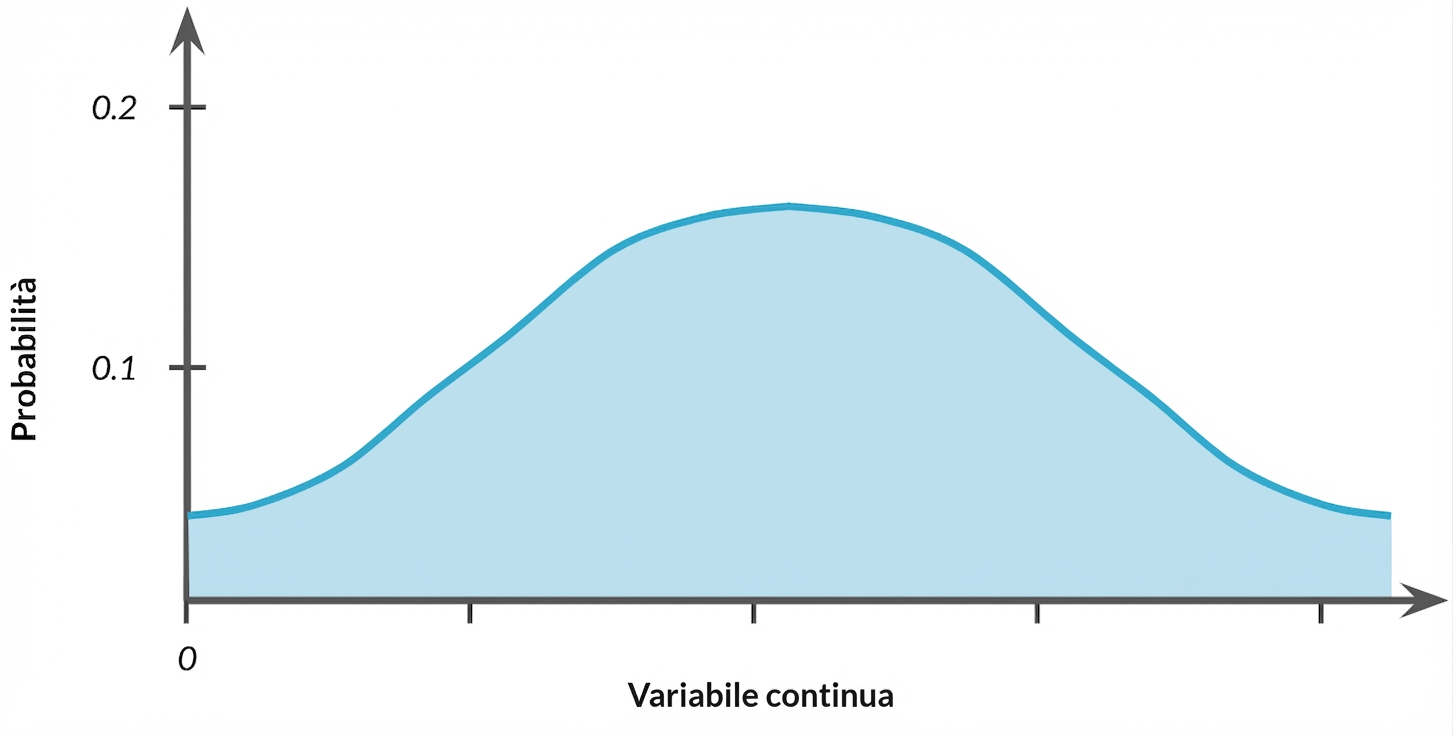
Altre distribuzioni continue
Altri tipi speciali di distribuzioni
Distribuzione normale
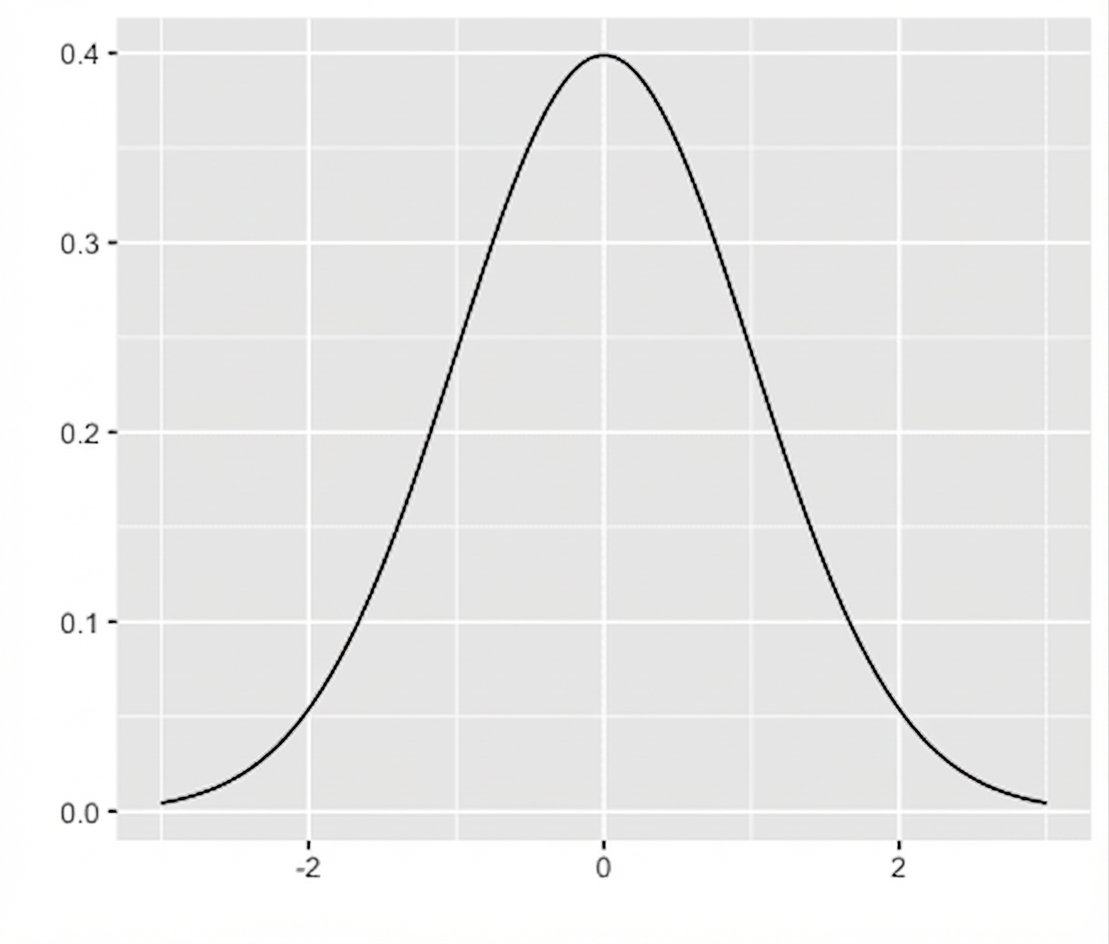
Distribuzione di Poisson