Introduction to Aggregating and Pivoting
Data Manipulation in KNIME

Philipp Kowalski
Certified KNIME Trainer
Introduction to Aggregation and Pivoting
Introduction to Aggregation and Pivoting

Introduction to Aggregation and Pivoting
Introduction to Aggregation and Pivoting

Introduction to Aggregation and Pivoting
Introductions to Aggregation and Pivoting
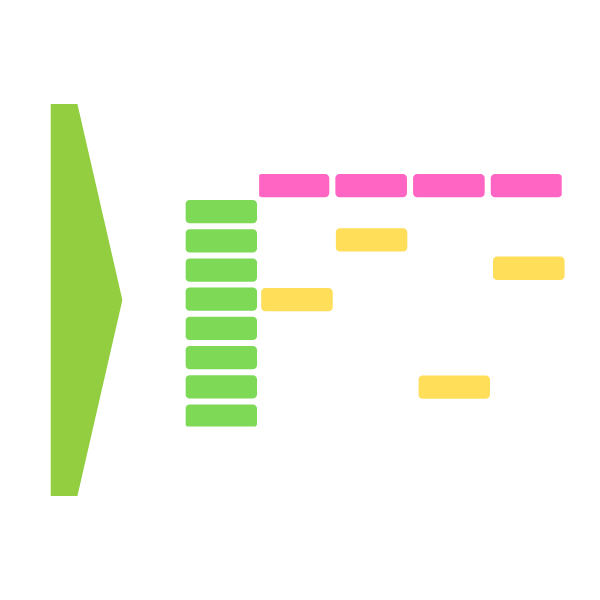
Simple aggregations with the Row Aggregator
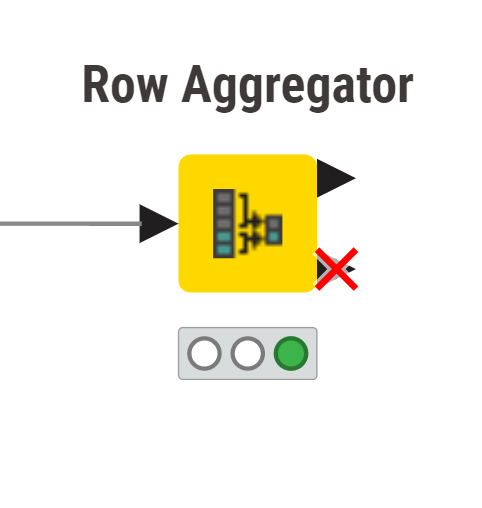
Simple aggregations with the Row Aggregator
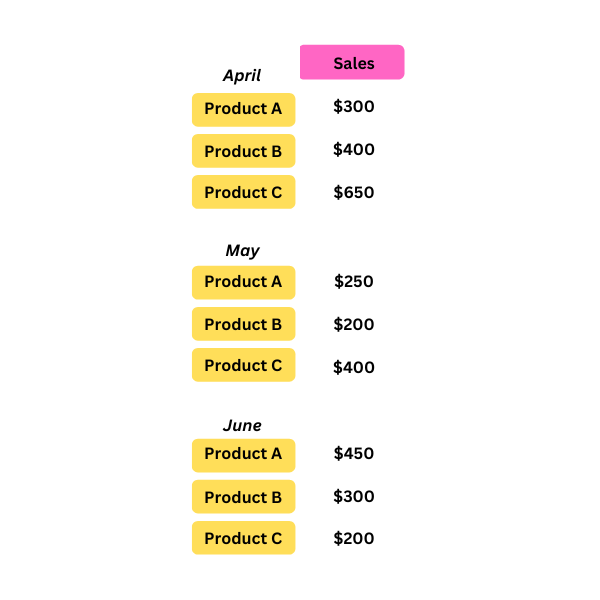
Simple aggregations with the Row Aggregator
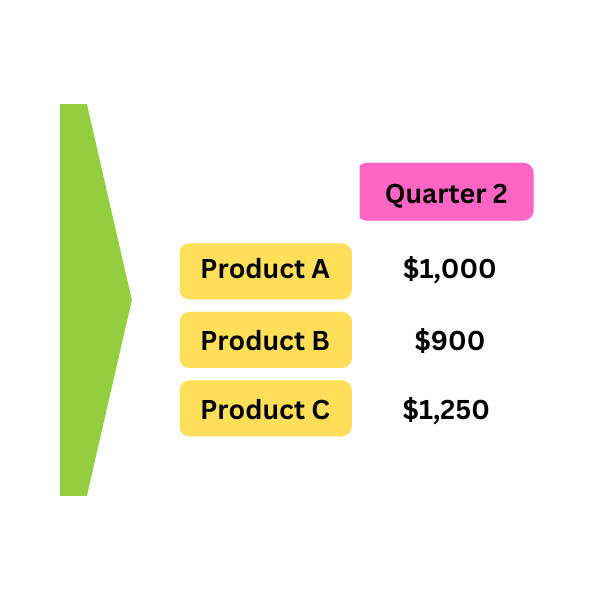
Simple aggregations with the Row Aggregator
Simple aggregations with the Row Aggregator
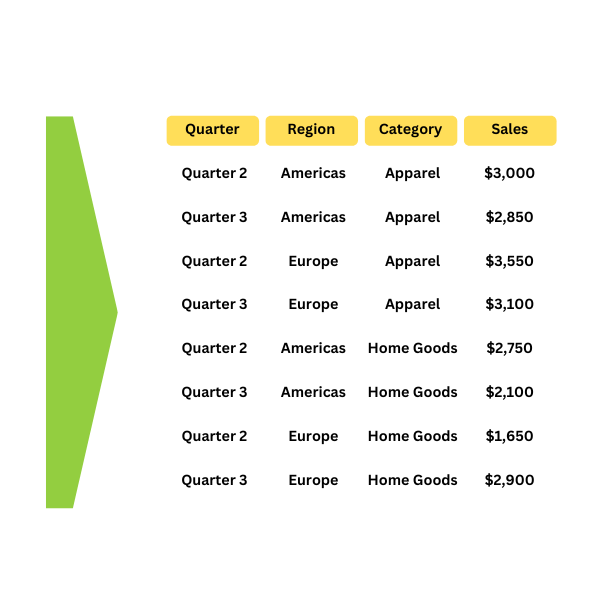
Multi-level aggregations with GroupBy
Multi-level aggregations with GroupBy
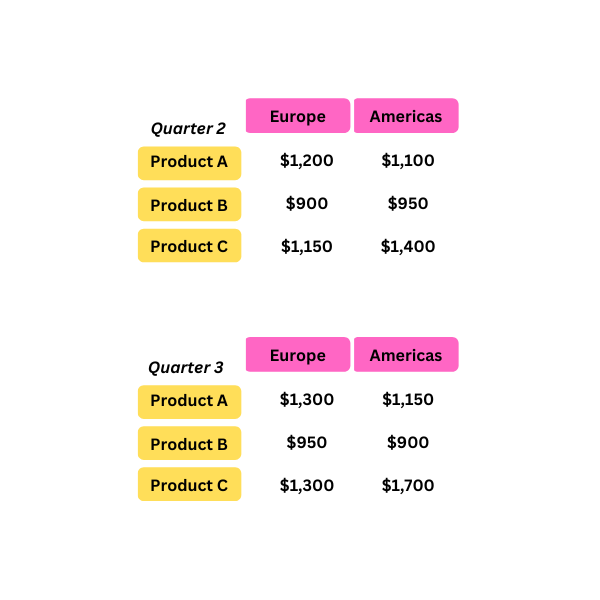
Multi-level aggregations with GroupBy
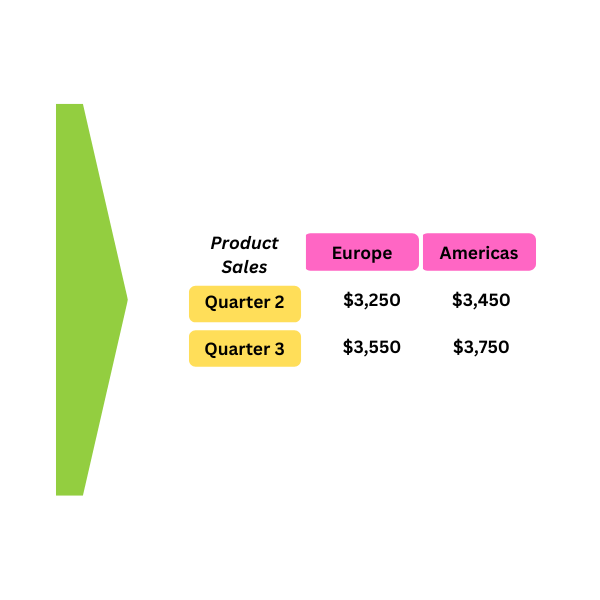
Multi-level aggregations with GroupBy
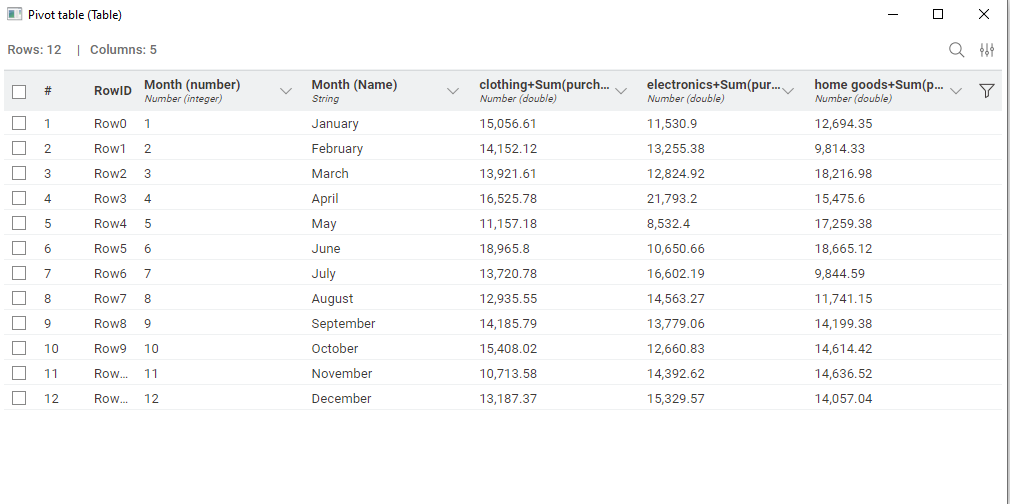
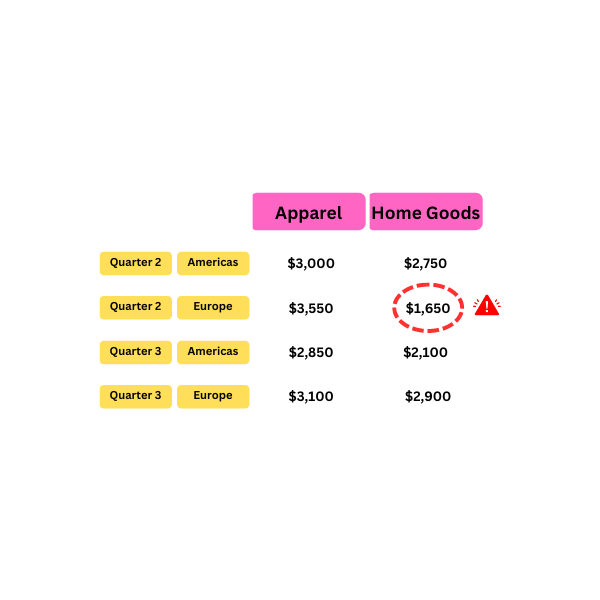
Complex aggregations with the Pivot node
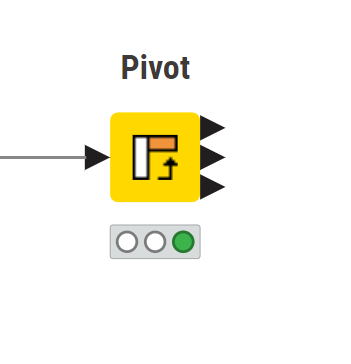
Complex aggregations with the Pivot node
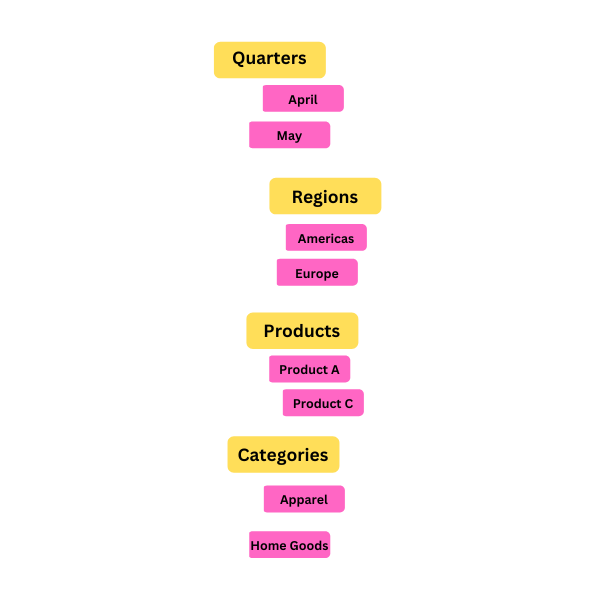
Complex aggregations with the Pivot node
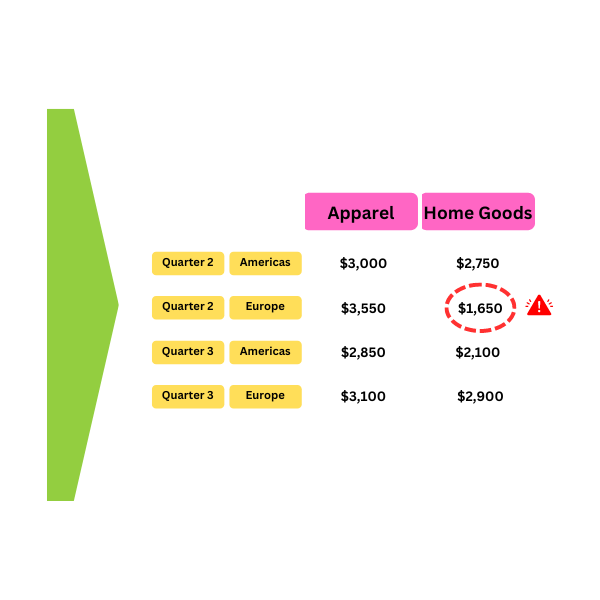
Complex aggregations with the Pivot node
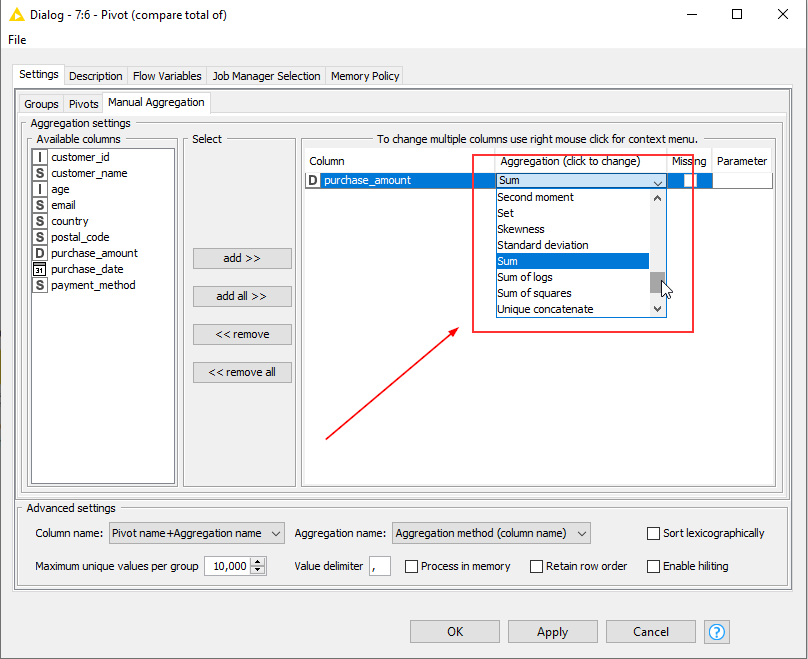
Complex aggregations with the Pivot node
Unpivoting data
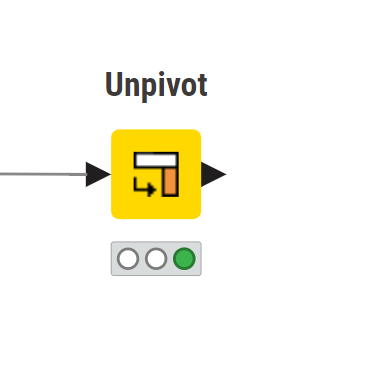
Unpivoting data
Unpivoting data