Visualizing your data
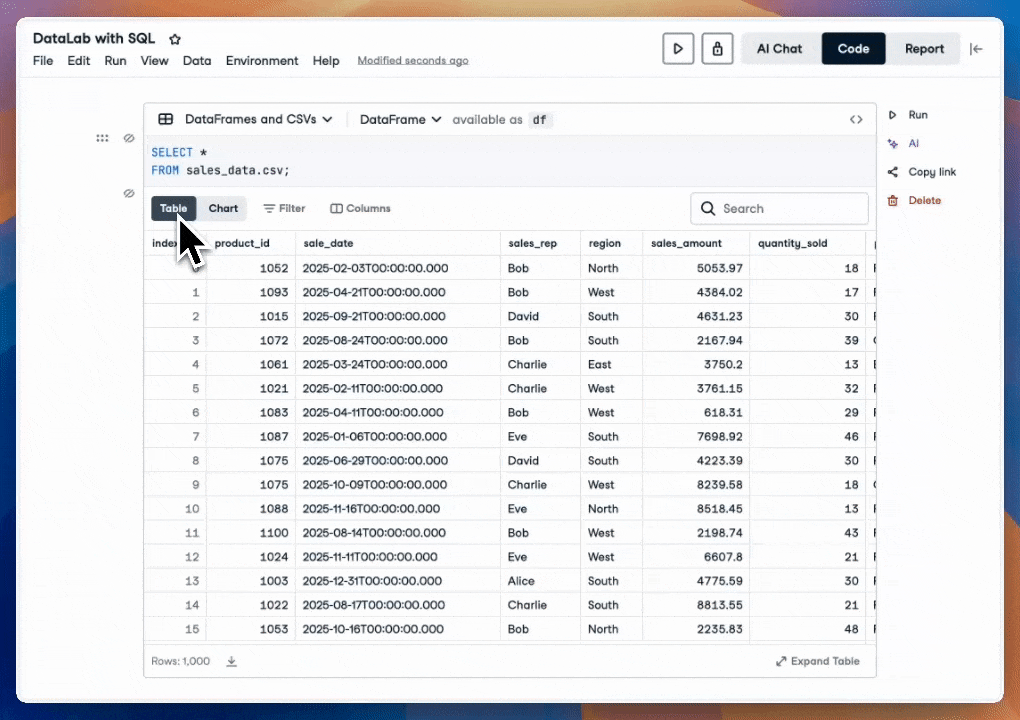
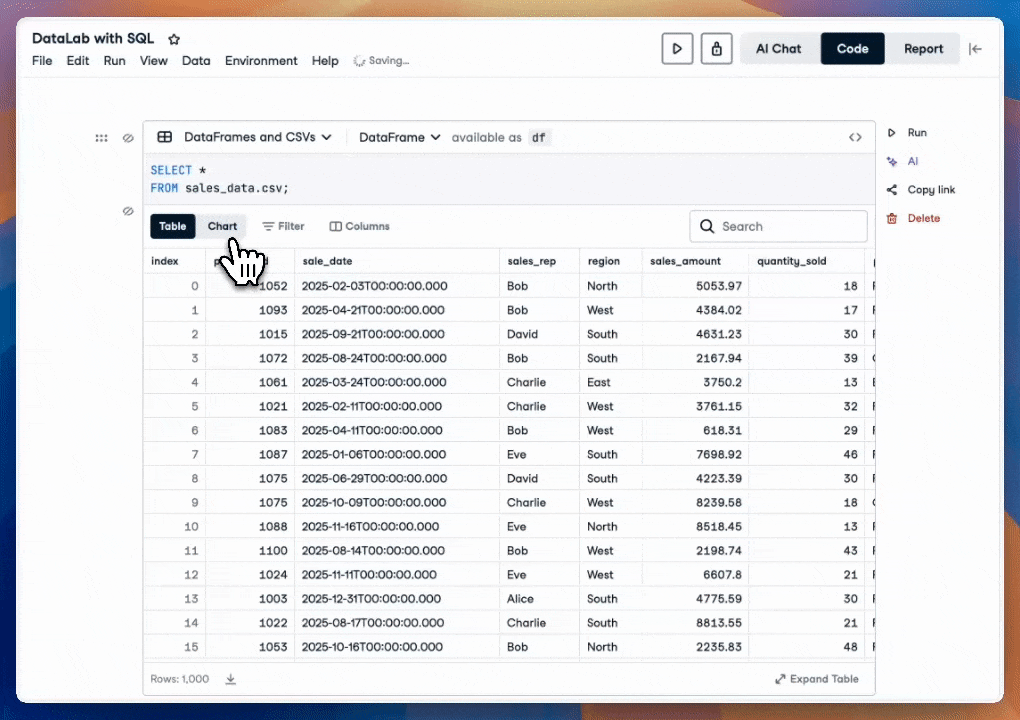
DataLab with SQL

Jasmin Ludolf
Senior Data Science and AI Content Developer, DataCamp
Automated features
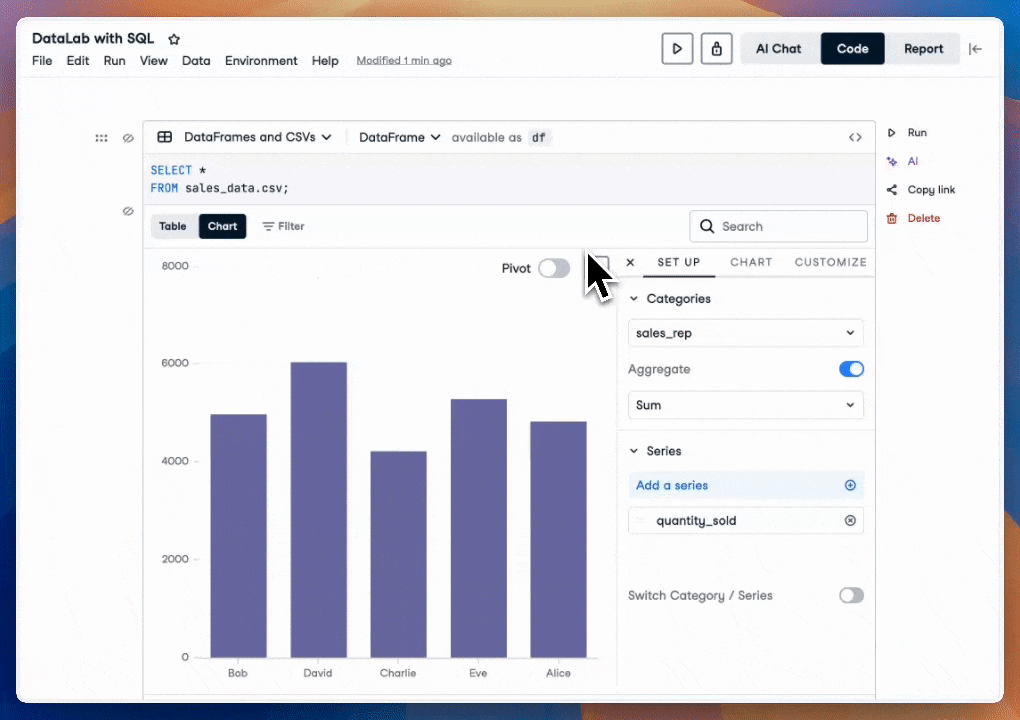
Visualizations
Charts
Set up: categories
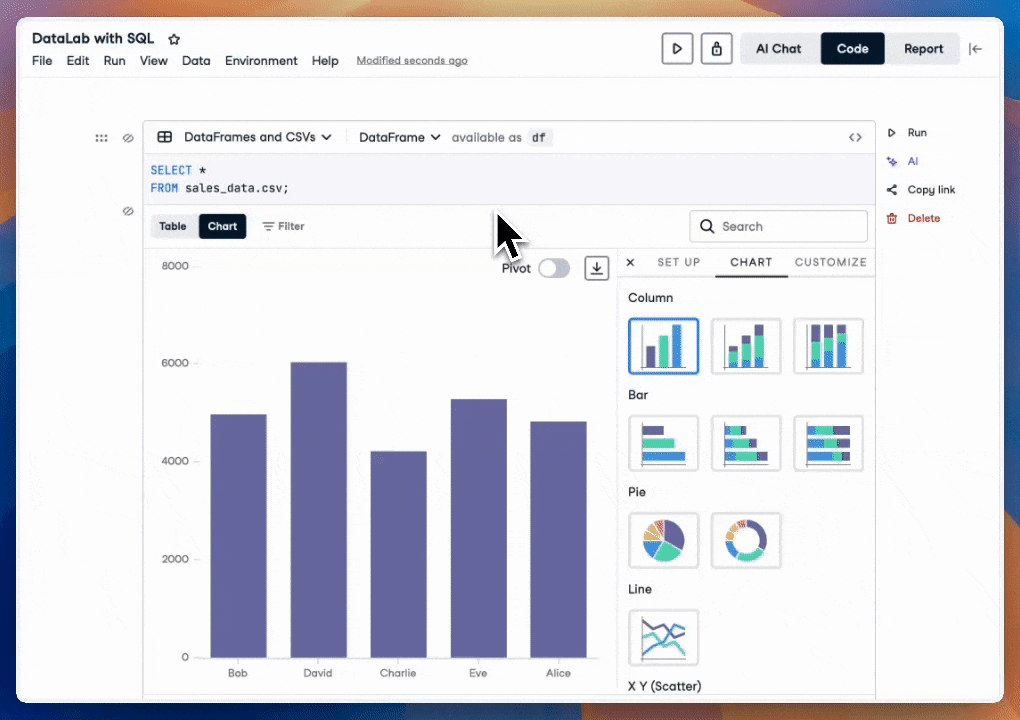
Set up: series
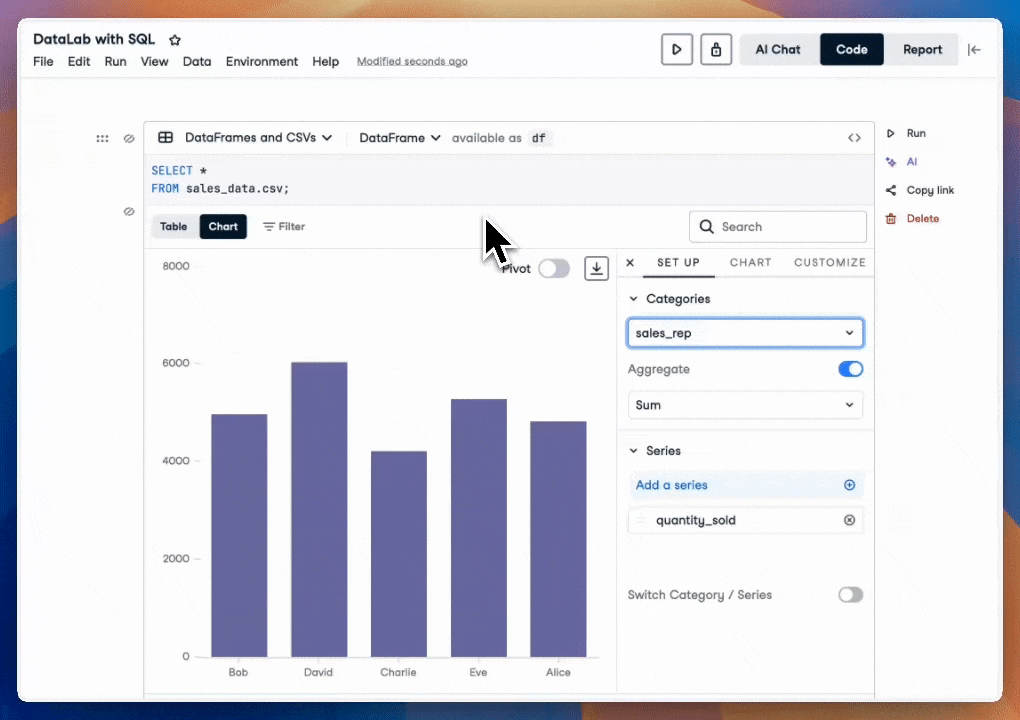
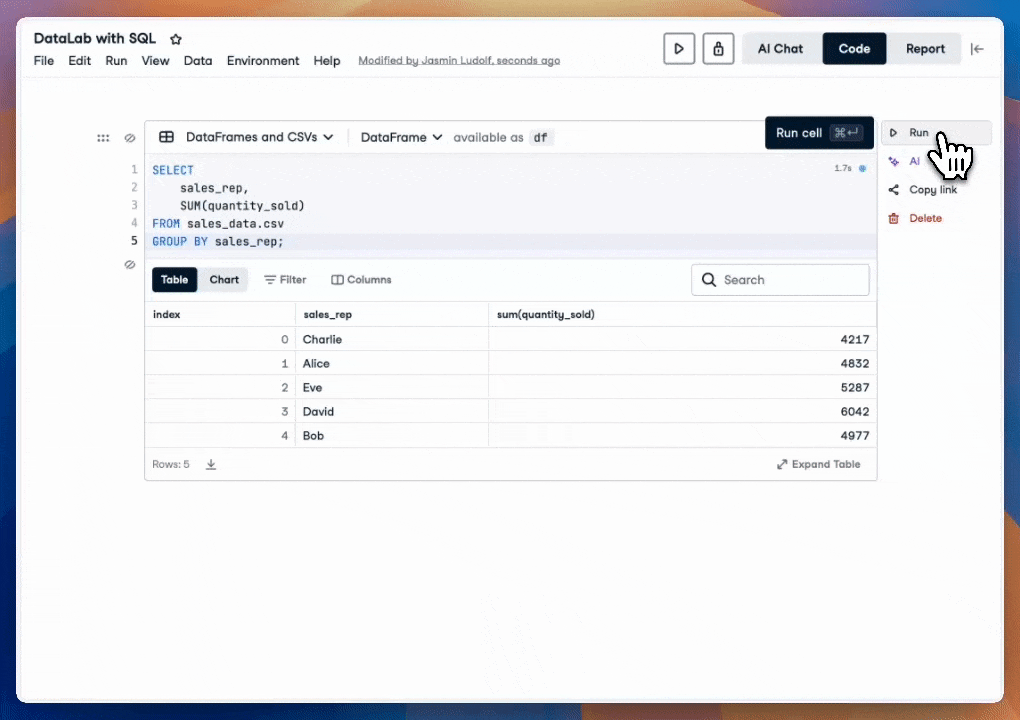
Set up: aggregations
AI assistant

AI assistant
1 https://datalab-docs.datacamp.com/work/chart-cell/pivot-charts

