Pivot tables and charts in Sigma

Introduction to Sigma

Katrina Menne

Sigma Alliance Lead at Aimpoint Digital

Oakmark Bank fraudulent transactions

Oakmark_Bank_Fraud_detection.png

Introduction to Sigma

Fraudulent transaction trends
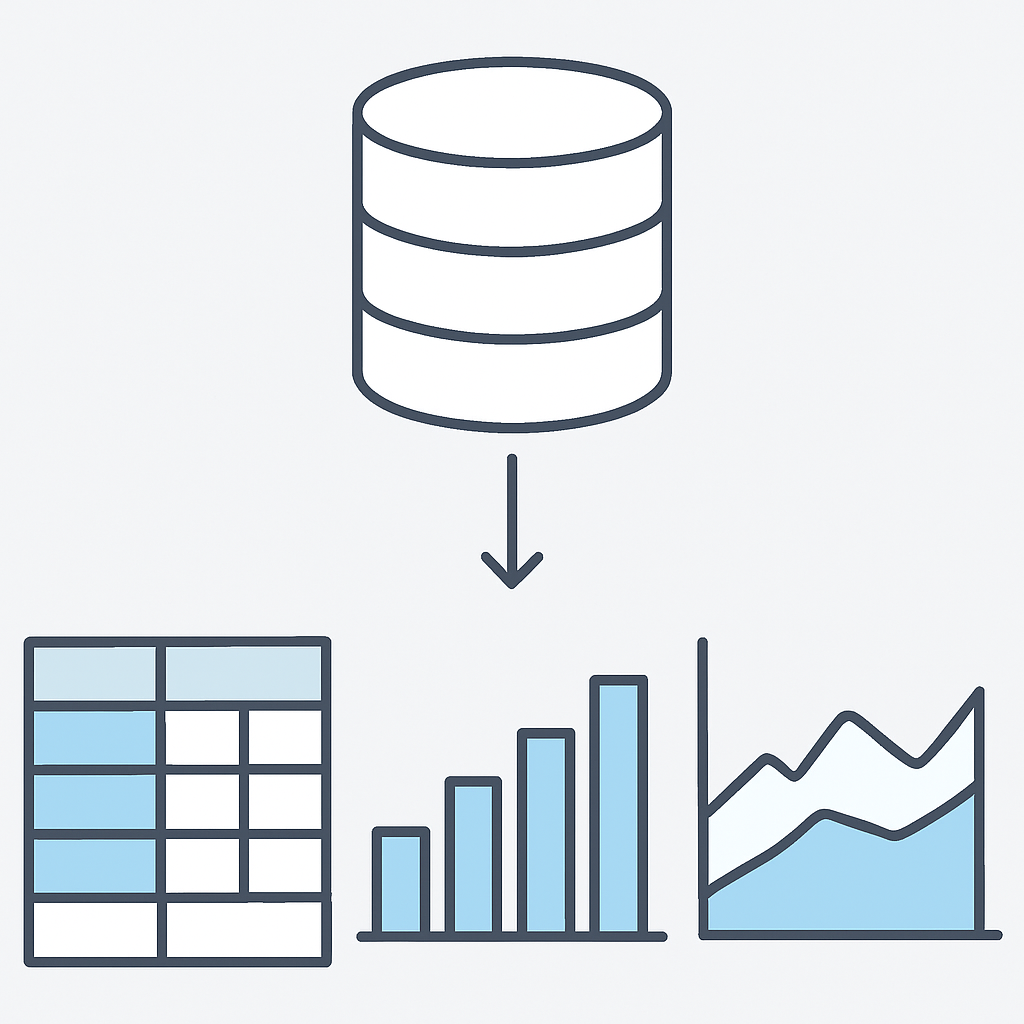
 

  • Executives need quick insights into fraud trends:
    • Is fraud increasing or decreasing overall?
    • Are certain merchants more vulnerable?
    • Are new customers at higher risk than long-term ones?


Pivot tables and charts help answer these questions quickly.


charts.gif

Introduction to Sigma

Pivot tables


pivtable.png


  • Summarize key variables
  • Filter data
  • Expand/collapse data
  • Present results clearly
  • Easy to use
Introduction to Sigma

Charts


Different charts.jpg


  • Quickly reveal trends, patterns, and outliers
  • Offer a high-level overview of the data
  • Use charts for summary; use tables for deep dives
  • Sigma supports a range of charts, from bar and line to KPI and scatter plots
Introduction to Sigma

Live data


  • Pivot tables and charts are child elements built on existing data
  • They stay updated through live connections to parent tables
  • Parent-child links support interactive filtering

Live_data.png

Introduction to Sigma

Let's practice!

Introduction to Sigma

Preparing Video For Download...