Tracking focal points
User-Oriented Design in Power BI

Maarten Van den Broeck
Content Developer at DataCamp
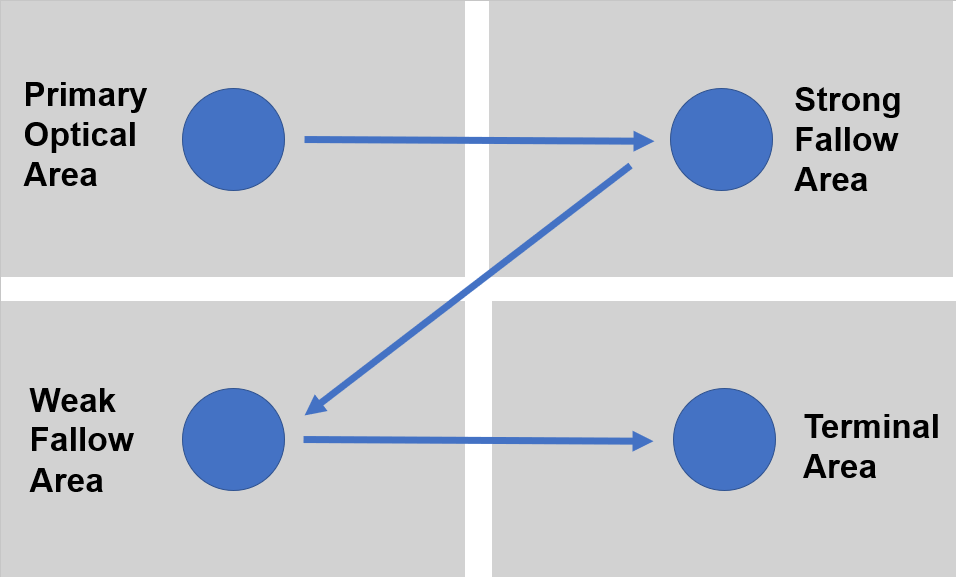
The Gutenberg layout
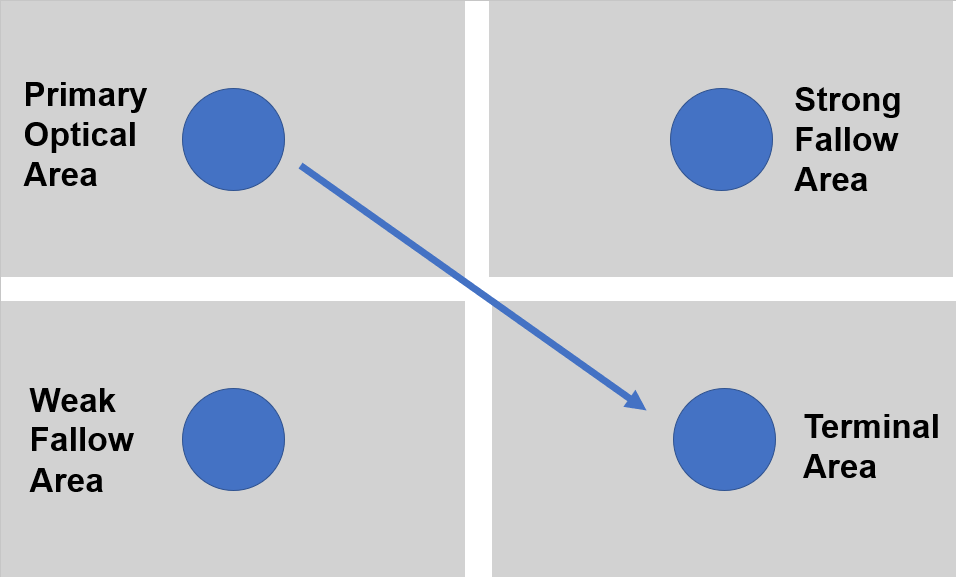
The Z layout
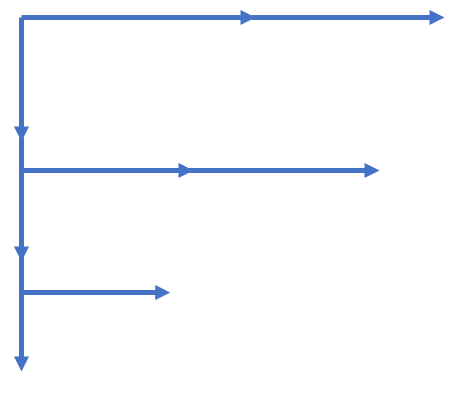
The F layout
Focal points

The rule of thirds

User-Oriented Design in Power BI
Maarten Van den Broeck
Content Developer at DataCamp

