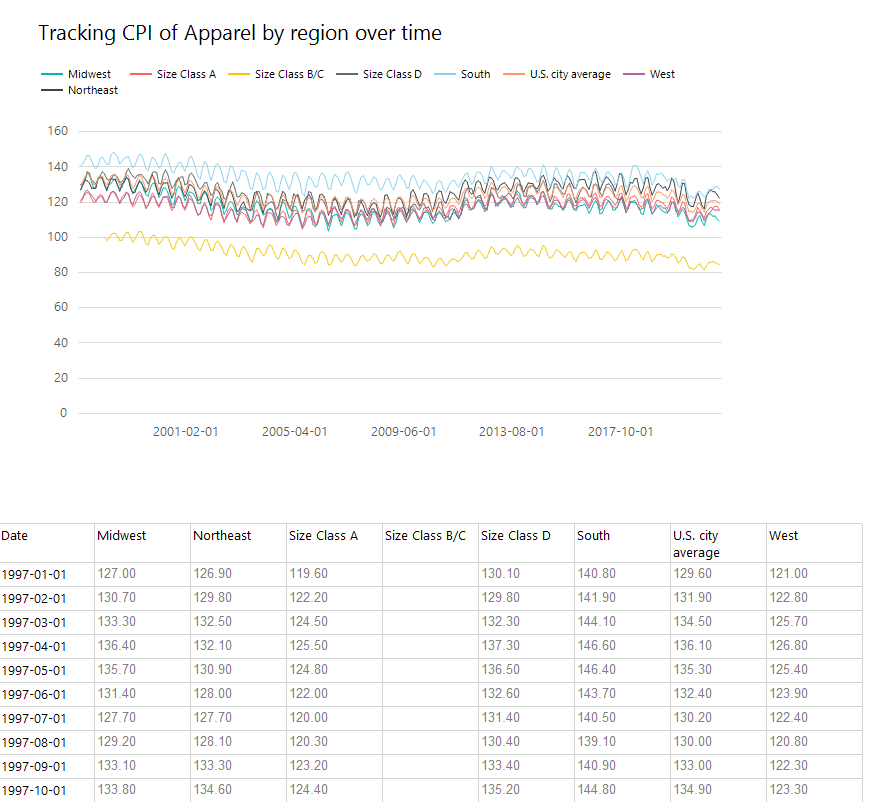
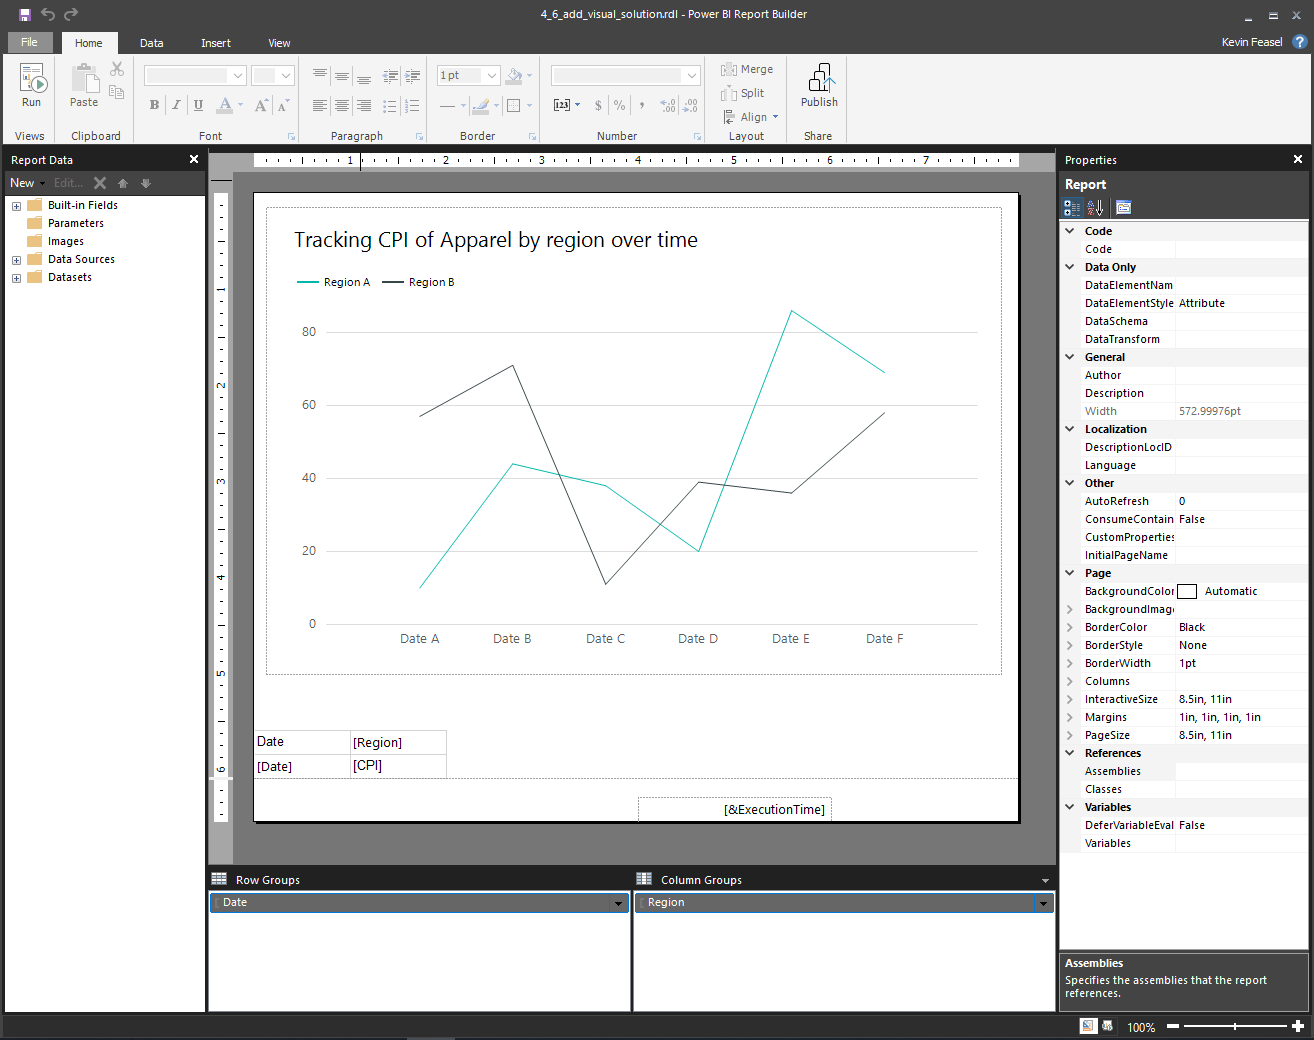
Paginated reports

User-Oriented Design in Power BI

Maarten Van den Broeck

Content Developer at DataCamp

What are paginated reports?

  • "Pixel-perfect" report intended for the written page
  • Created in the Power BI Report Builder

An example of a paginated report in Power BI.

User-Oriented Design in Power BI

The origin of paginated reports

  • SQL Server Reporting Services (SSRS)
  • SSRS Report Builder
  • Power BI Report Builder

The Power BI Report Builder

User-Oriented Design in Power BI

Comparing against dashboards

Power BI paginated reports

  • Easily print out tables over multiple pages
  • Dozens of visuals, including many classics (line chart, bar/column chart, scatter plot, box plot, radar chart, pie chart)
  • No cross-filtering or slicing on reports--more for read-only

Power BI dashboard reports

  • Limited print capabilities
  • Dozens of visuals, but incomplete overlap!
  • Cross-filtering and active slicing
User-Oriented Design in Power BI

Important limitations

  • Viewing a report requires a Pro license, but saving a report requires Premium capacity
  • No sharing data sources or datasets between paginated reports
  • No drillthrough or click-through capabilities or linked reports
  • Limited in-app interaction, but you can export it to Word, Excel, CSV, or PDF format.
User-Oriented Design in Power BI

Let's practice!

User-Oriented Design in Power BI

Preparing Video For Download...