Designing for accessibility
User-Oriented Design in Power BI

Maarten Van den Broeck
Content Developer at DataCamp
CVD in action
Typical vision
Tritanopia
Protanopia
Deuteranopia
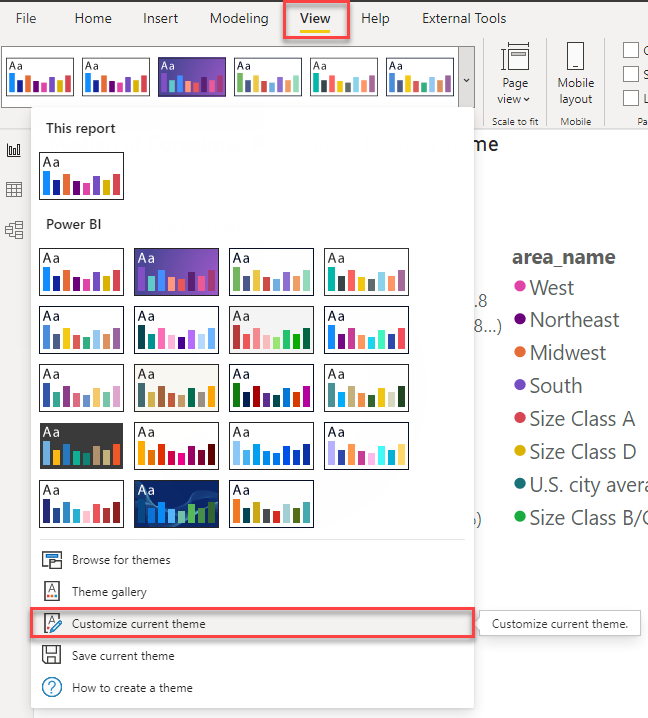
Tips for better color usage
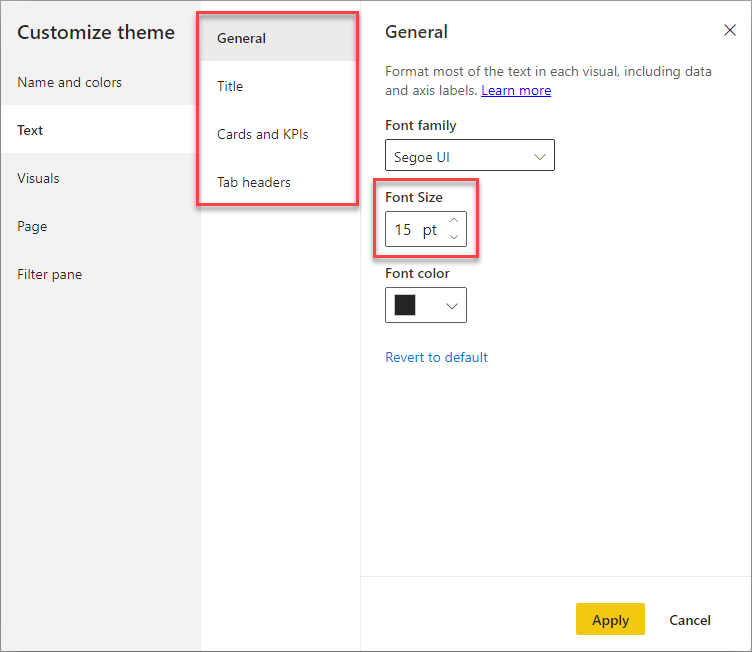
Font Sizes
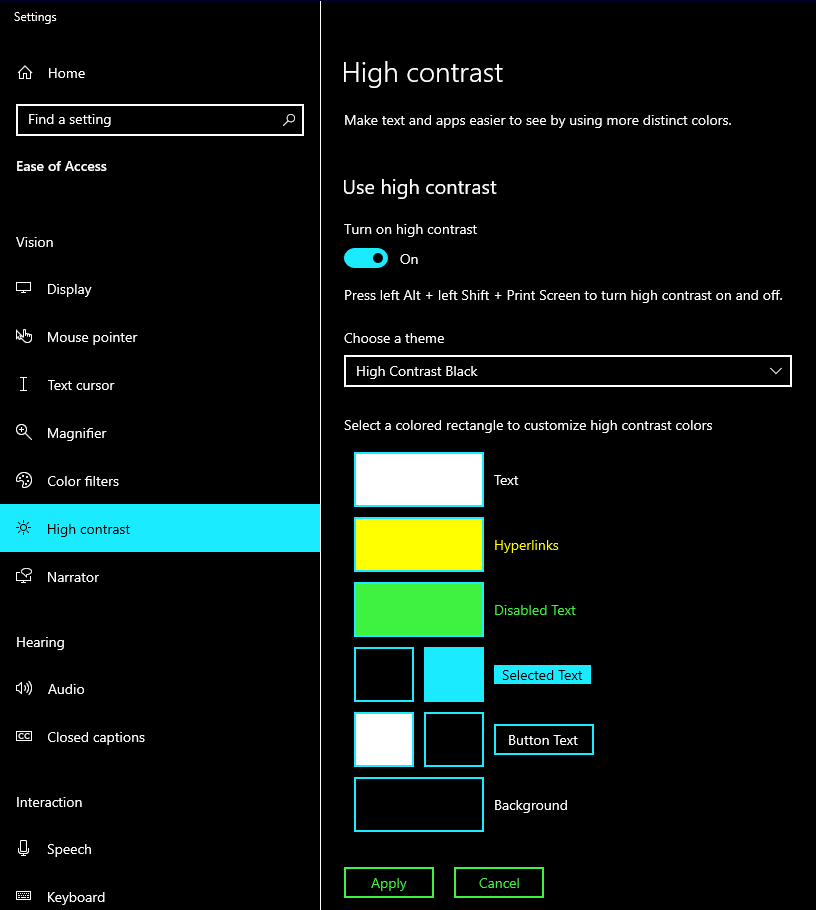
High Contrast Mode
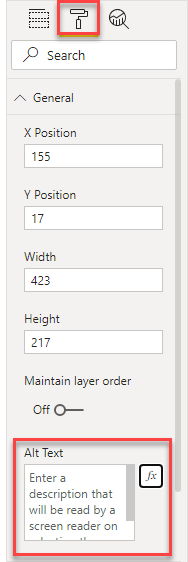
Screen readers
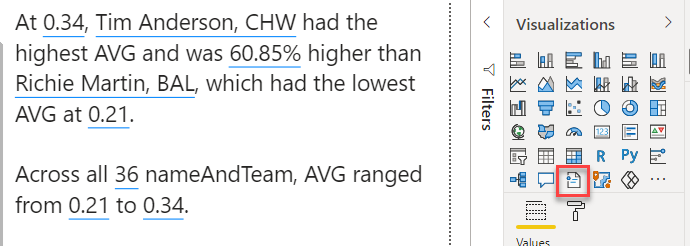
Smart narratives