Build a market-cap weighted index
Manipulating Time Series Data in Python

Stefan Jansen
Founder & Lead Data Scientist at Applied Artificial Intelligence
Build your value-weighted index
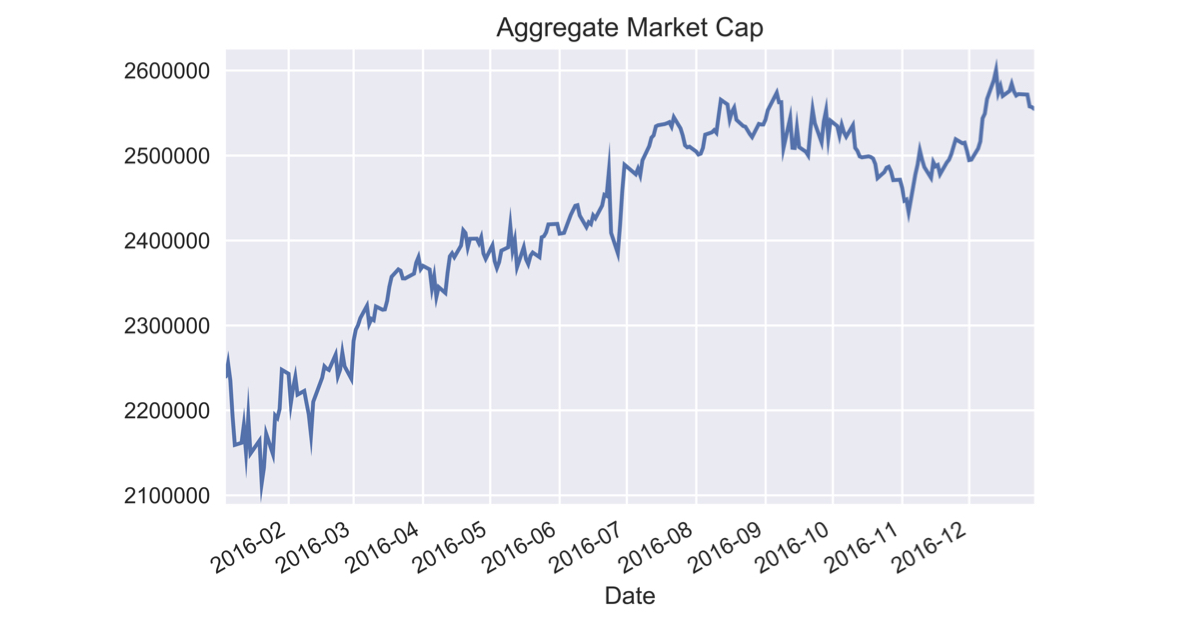
Aggregate market value per period
agg_mcap = market_cap_series.sum(axis=1) # Total market capagg_mcap(title='Aggregate Market Cap')
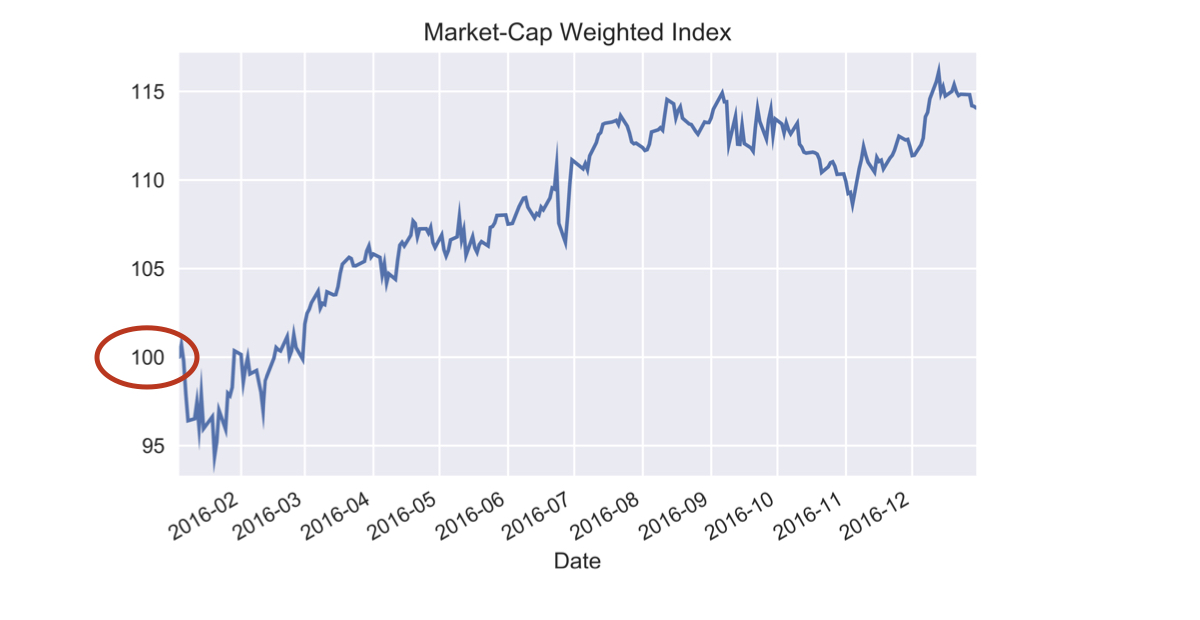
Value-based index
index = agg_mcap.div(agg_mcap.iloc[0]).mul(100) # Divide by 1st valueindex.plot(title='Market-Cap Weighted Index')