Compare time series growth rates
Manipulating Time Series Data in Python

Stefan Jansen
Founder & Lead Data Scientist at Applied Artificial Intelligence
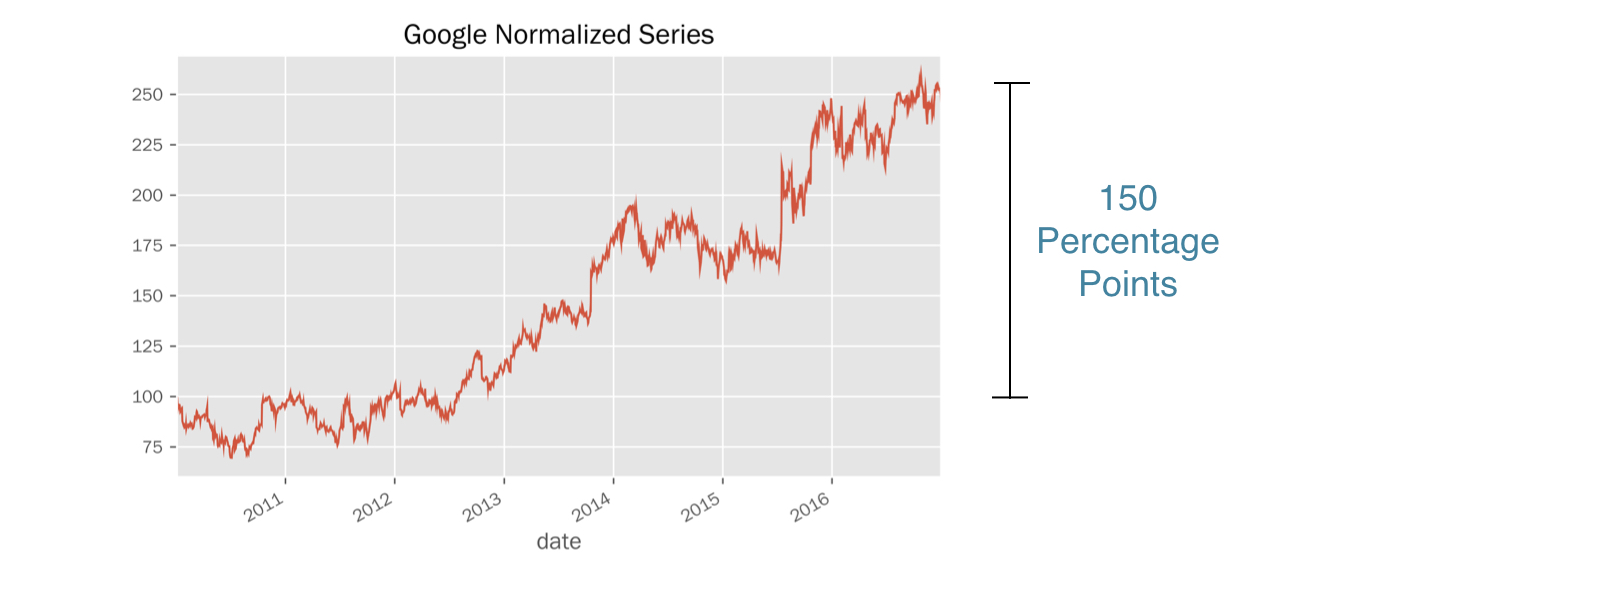
Normalizing a single series (2)
normalized = google.price.div(first_price).mul(100)normalized.plot(title='Google Normalized Series')
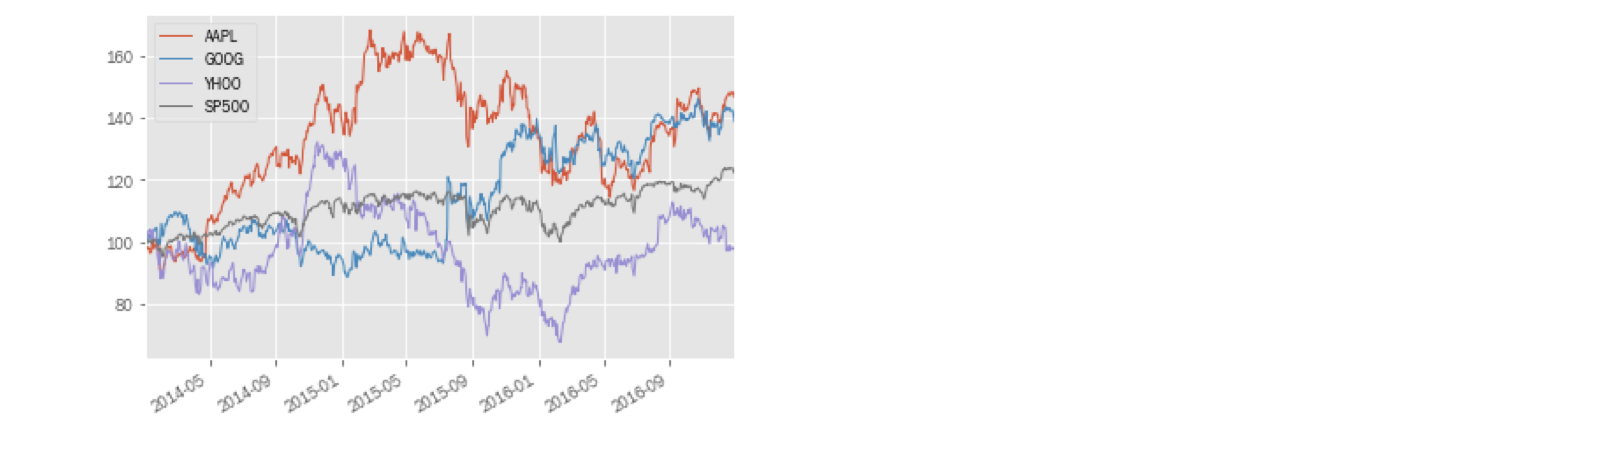
Comparing with a benchmark (2)
prices.head(1)
             AAPL    GOOG   YHOO    SP500
2010-01-04  30.57  313.06  17.10  1132.99
normalized = prices.div(prices.iloc[0]).mul(100)normalized.plot()
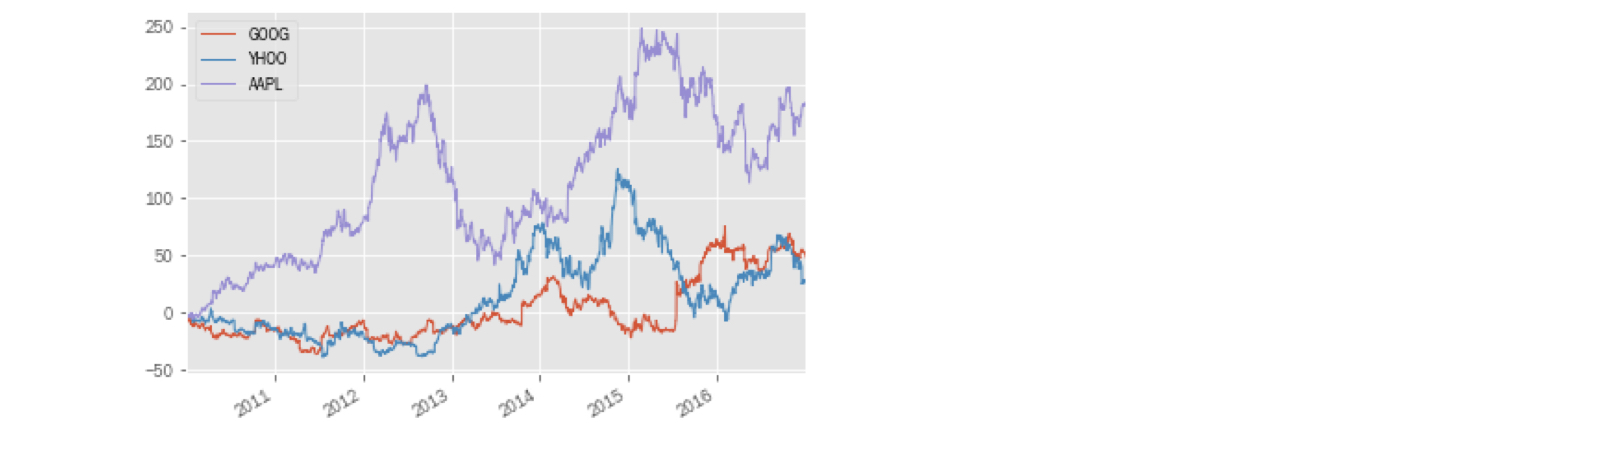
Plotting performance difference
diff.plot()