Özelleştirme
Orta Seviye Python

Hugo Bowne-Anderson
Data Scientist at DataCamp
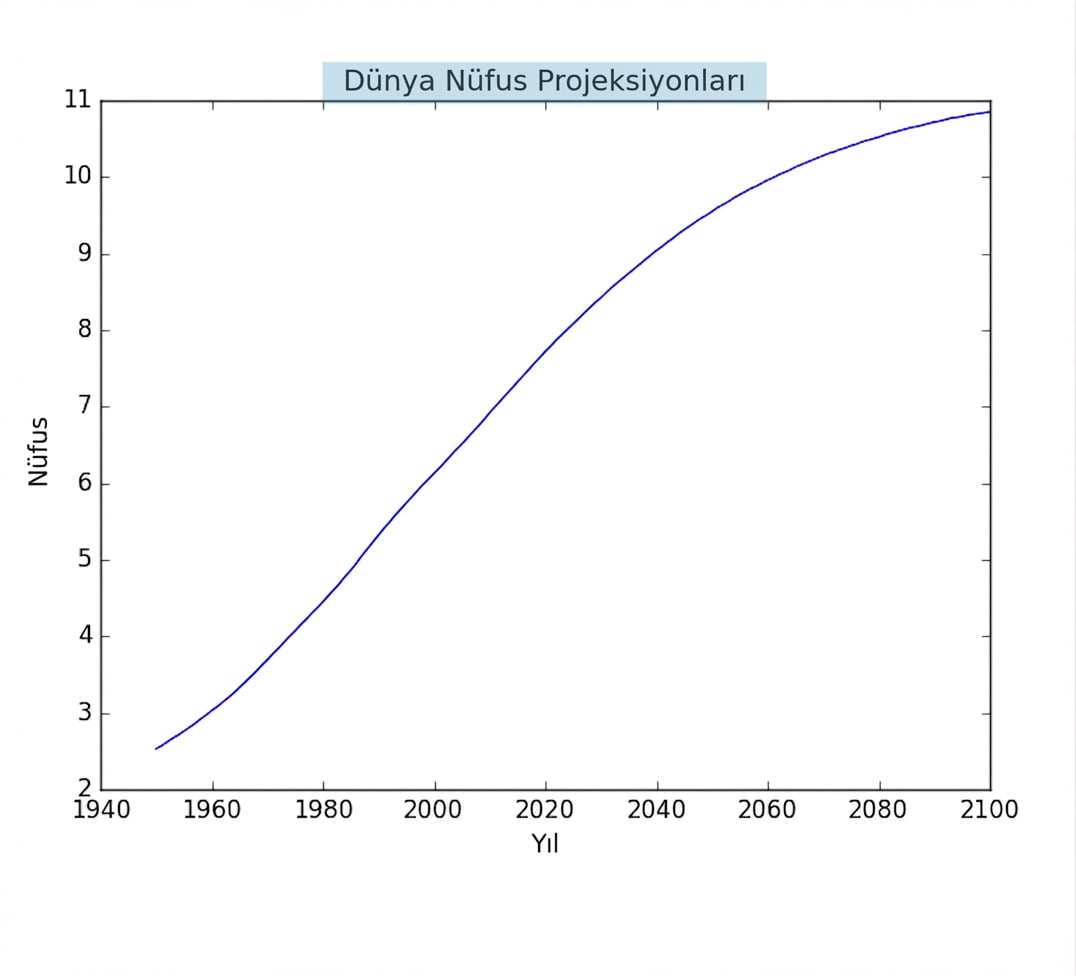
Temel grafik
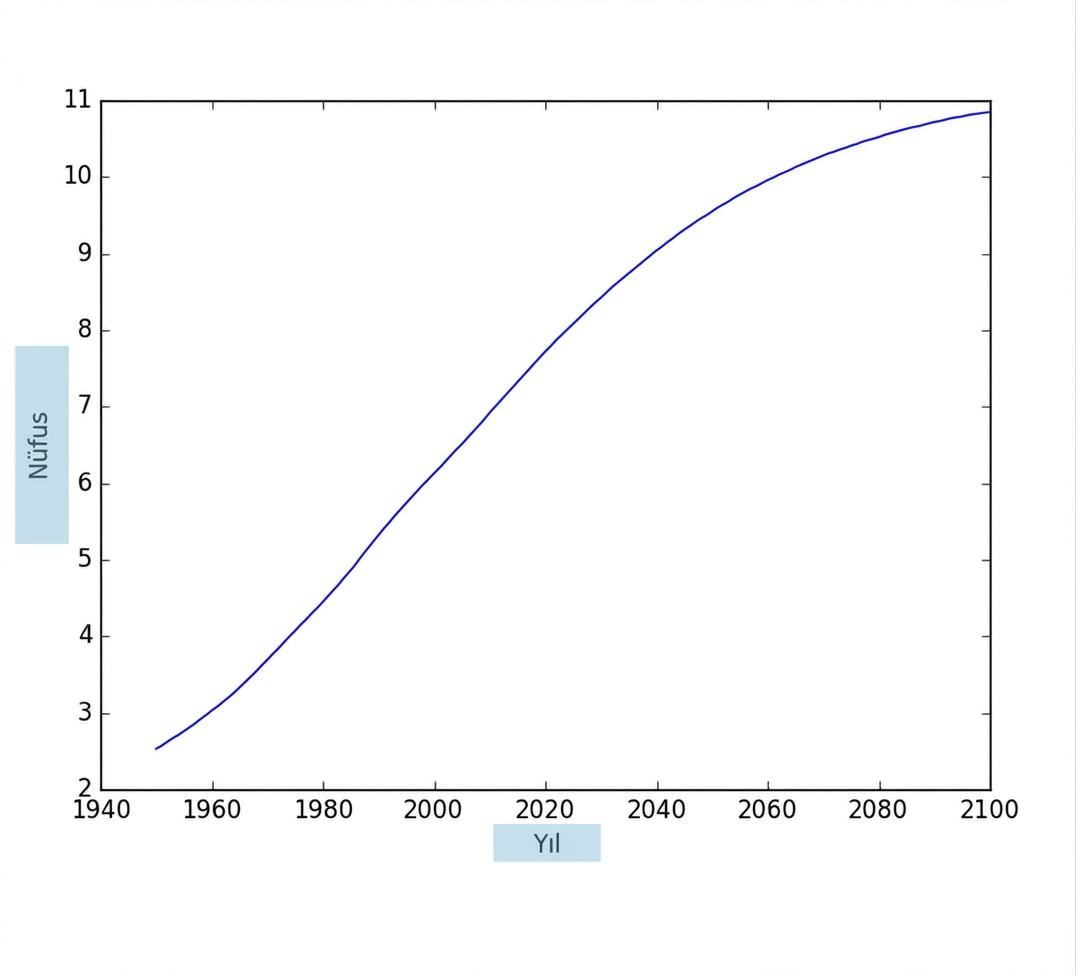
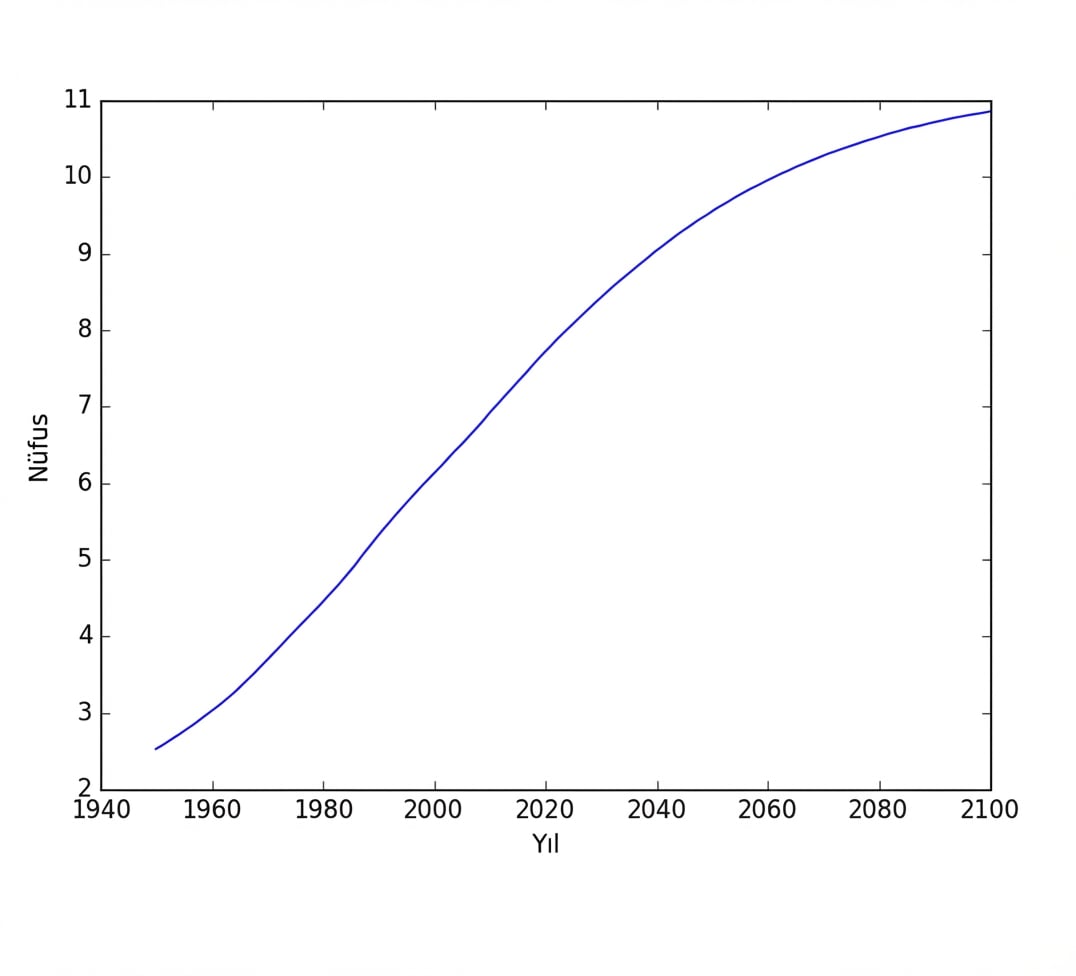
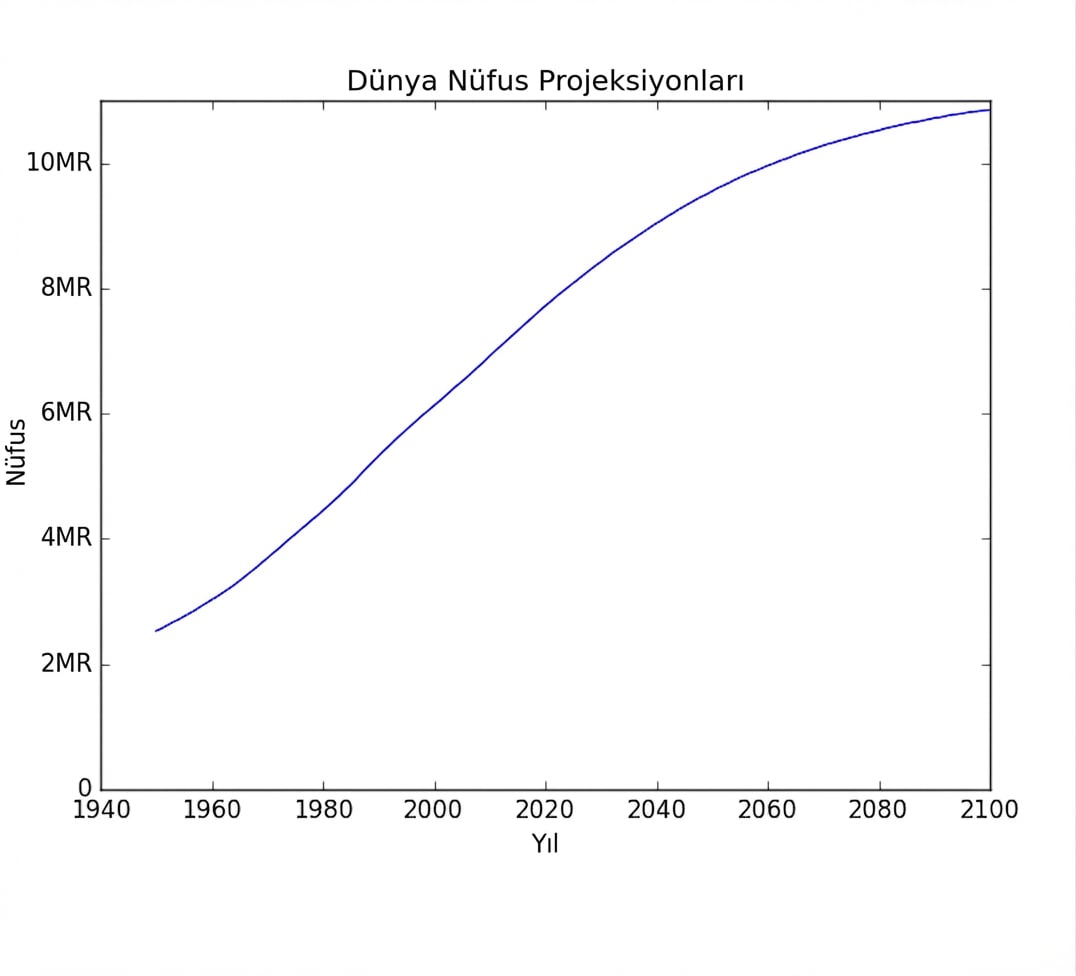
Eksen etiketleri
Eksen etiketleri
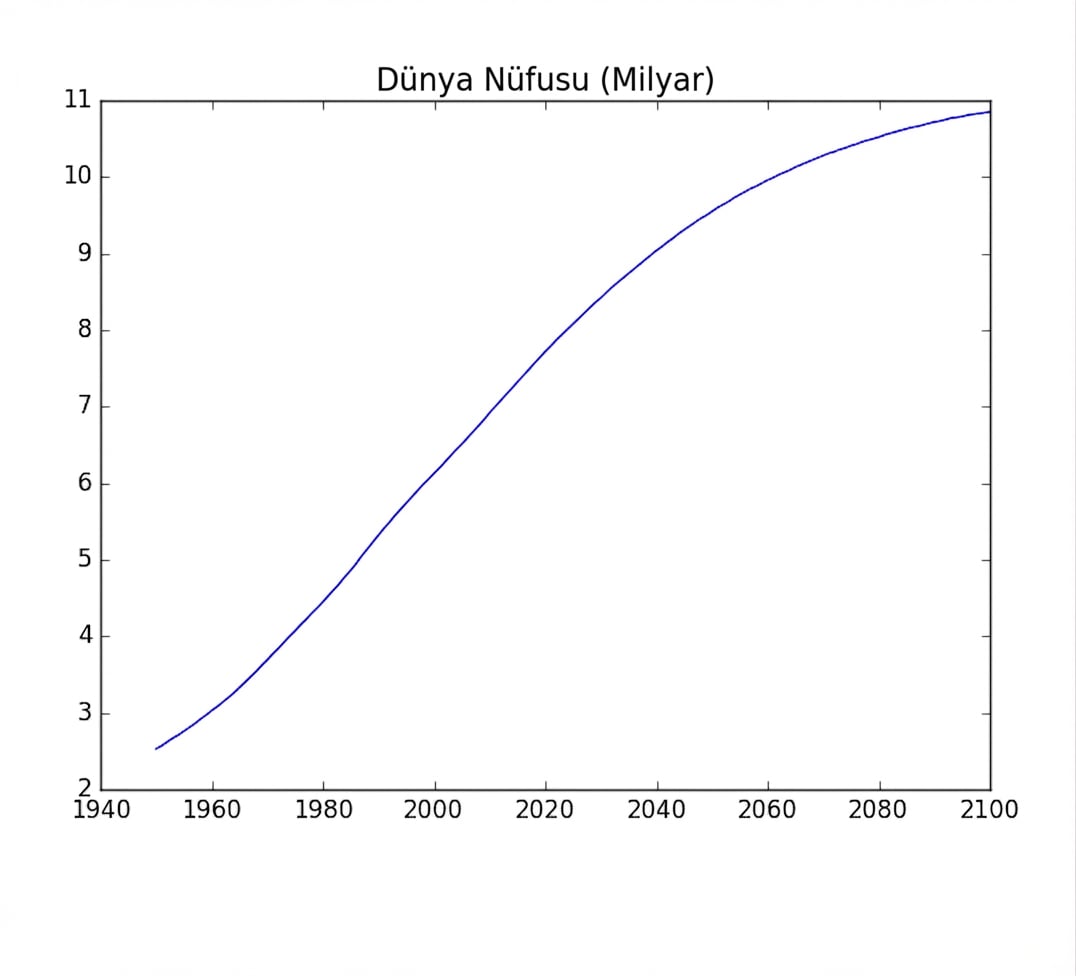
Başlık
Başlık
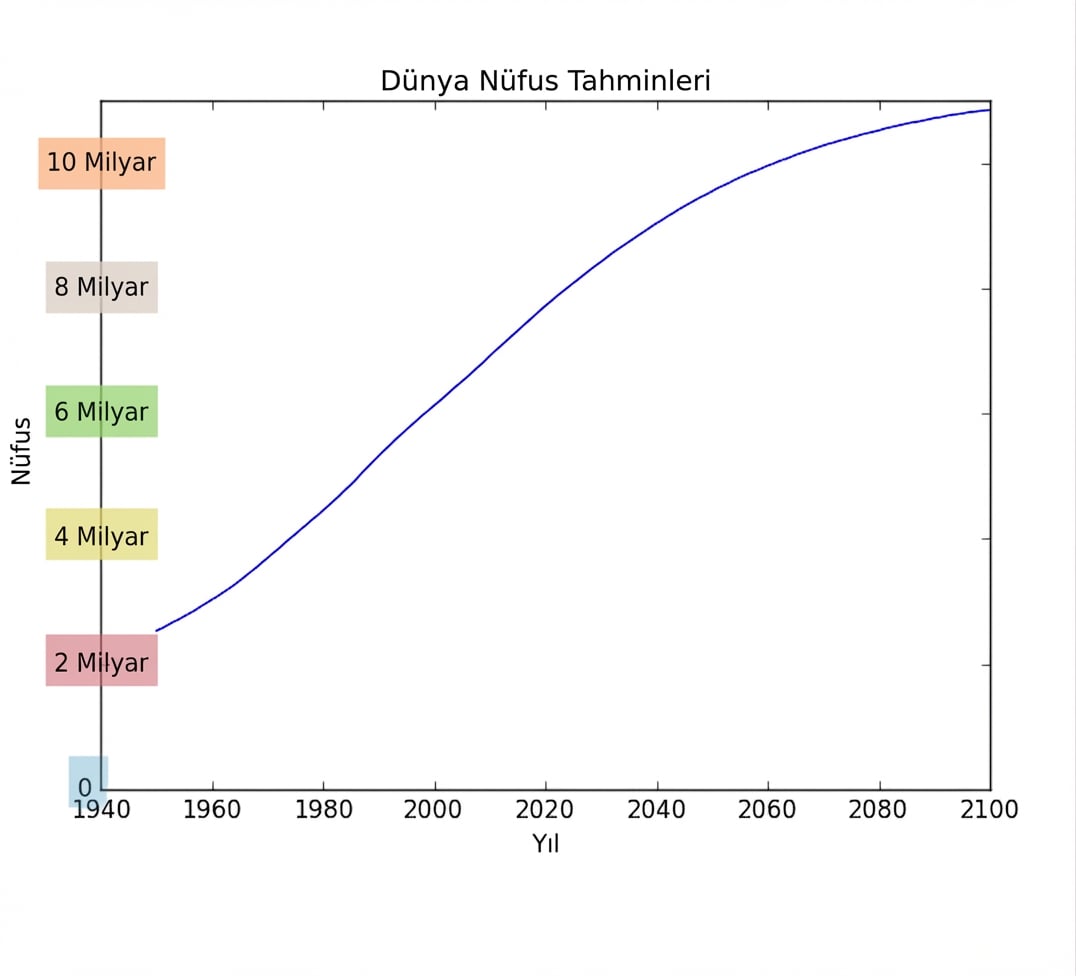
İşaretler
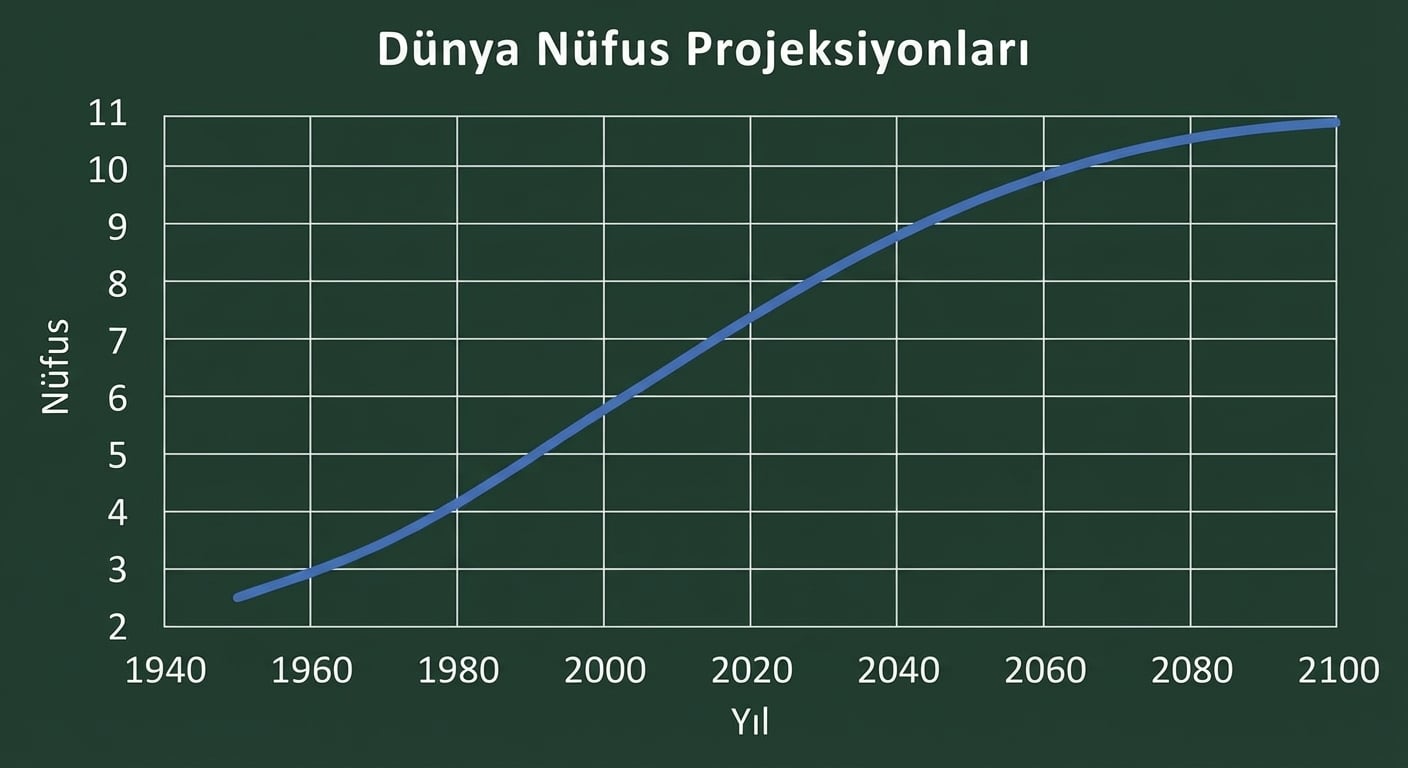
İşaretler
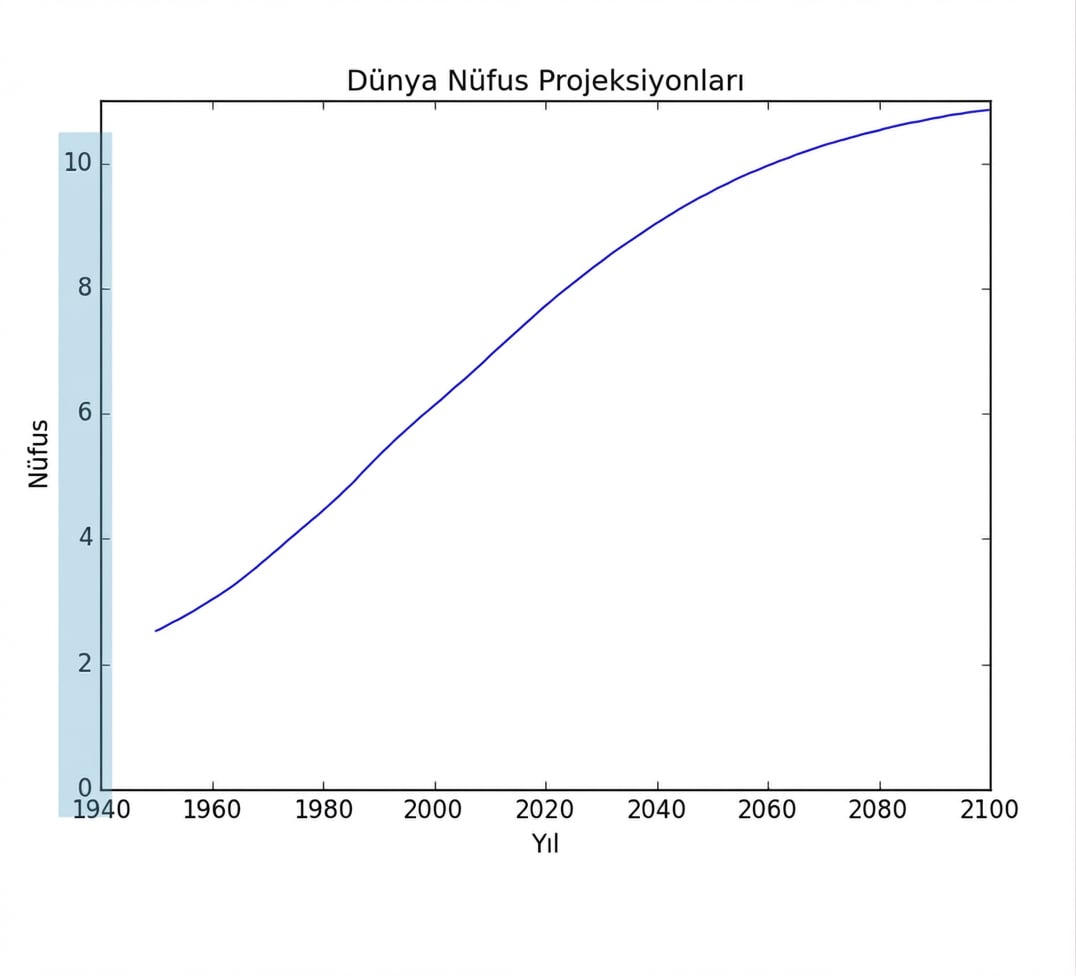
İşaretler (2)
İşaretler (2)
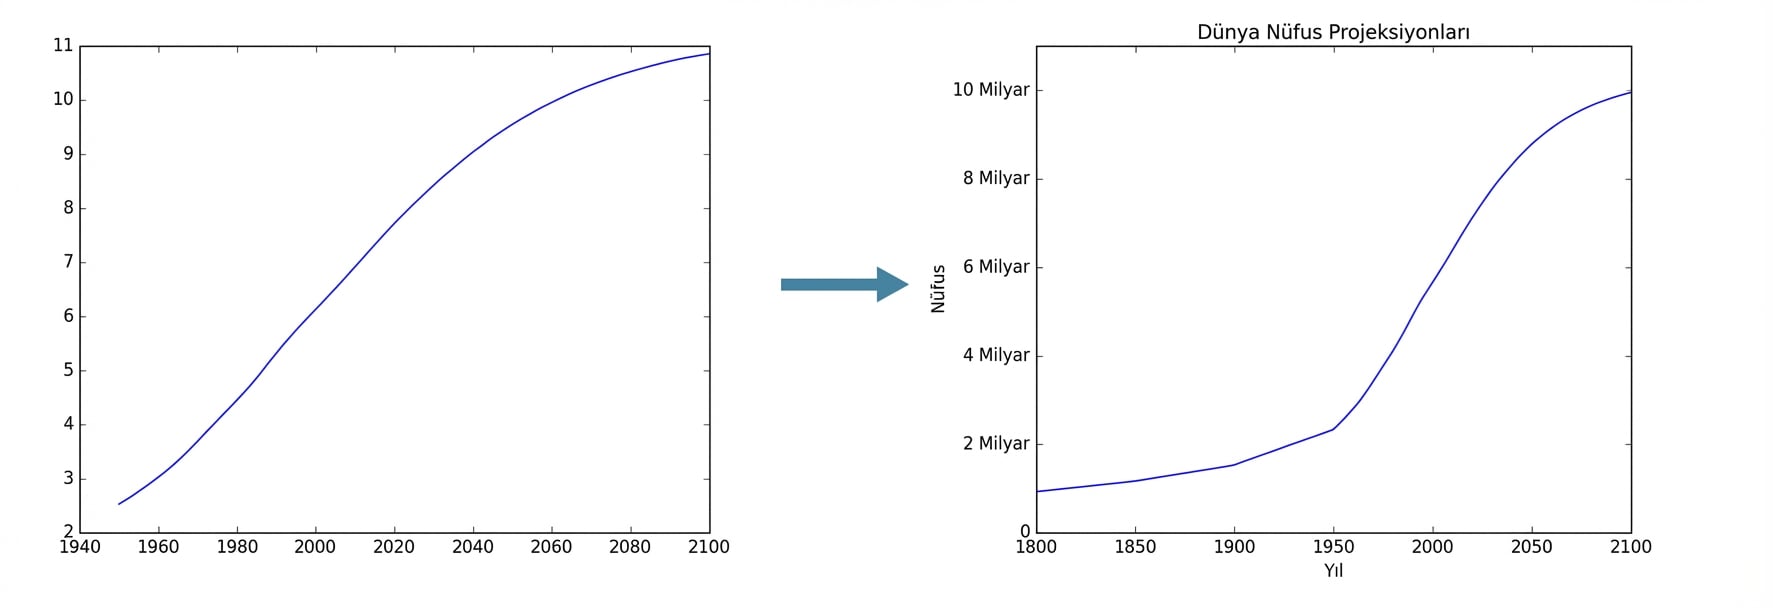
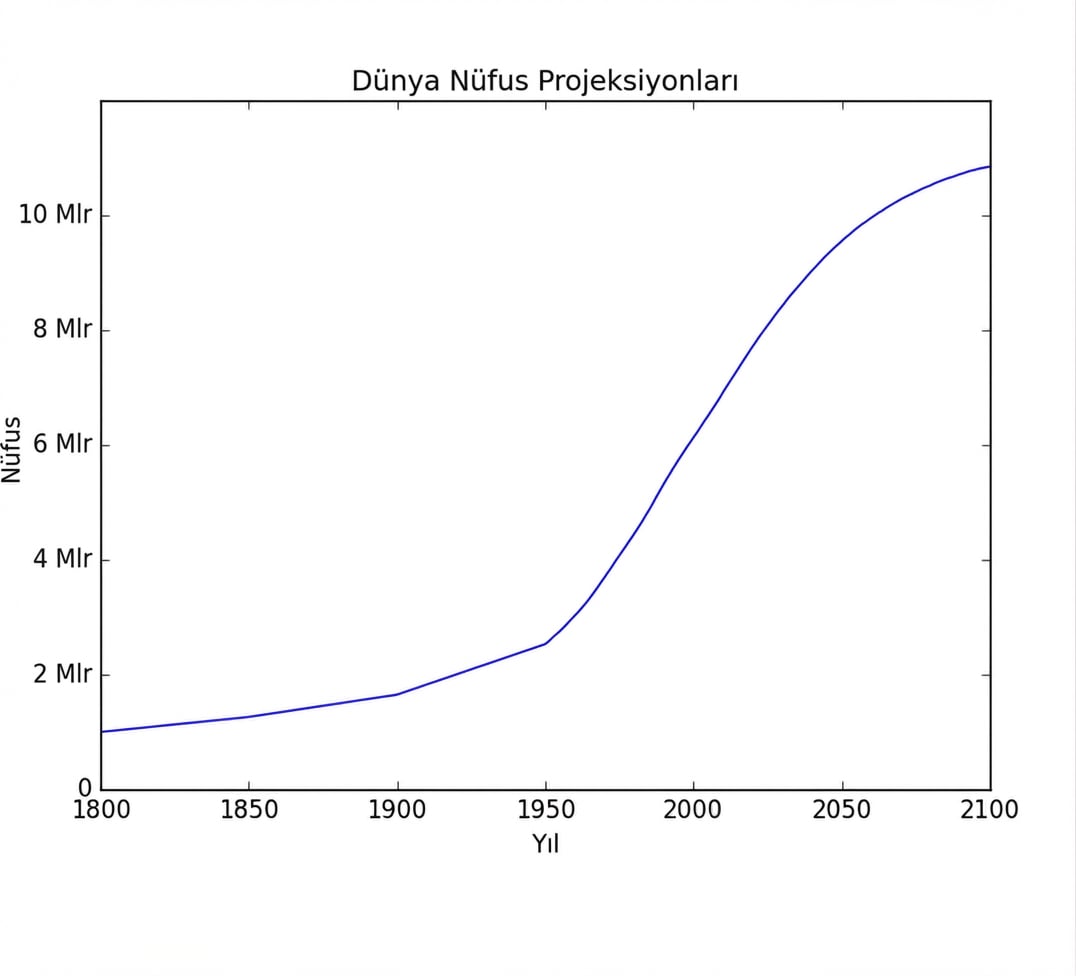
Tarihsel veri ekleme
Tarihsel veri ekleme
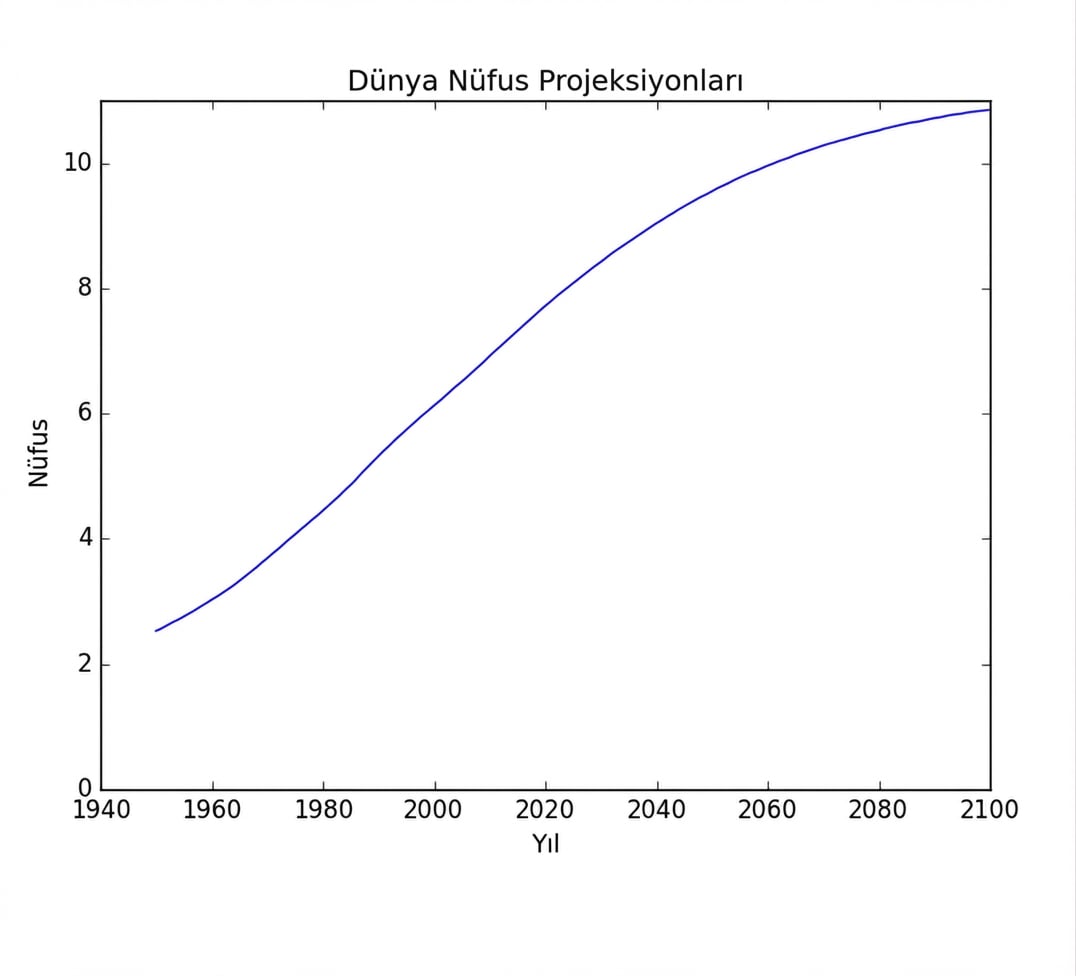
Öncesi ve sonrası