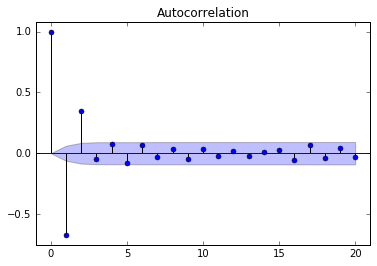
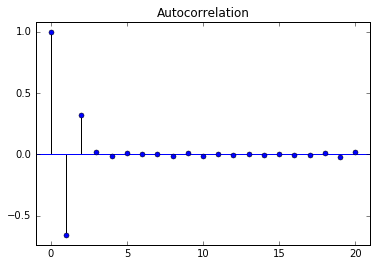
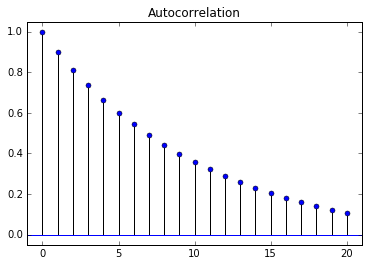
Autocorrelation Function
Time Series Analysis in Python

Rob Reider
Adjunct Professor, NYU-Courant Consultant, Quantopian
ACF Example 1: Simple Autocorrelation Function
- Can use last two values in series for forecasting
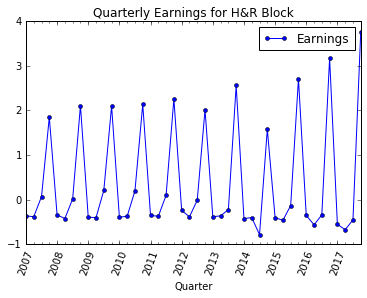
ACF Example 2: Seasonal Earnings
- Earnings for H&R Block
- ACF for H&R Block
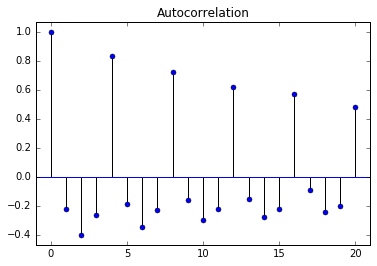
ACF Example 3: Useful for Model Selection
- Model selection
Confidence Interval of ACF